RESEARCH
Influence of mining related activities
on levels of mercury in water, sediment and fish
from the Ankobra and Tano River basins
in South Western Ghana
Noah Kyame Asare‑Donkor
*and Anthony Apeke Adimado
Abstract
Background: Mercury (Hg) used in gold amalgamation is a major source of contamination in developing countries. The present study evaluates the concentrations of total mercury in water, sediment and fish from the Ankobra and Tano Rivers, which drain the major gold mining areas in Ghana. Total mercury (T‑Hg) analysis was carried out using an atomic absorption spectroscopy (Perkin Elmer model 5100PC) equipped with a flow injection analysis system (FIAS, AS‑90).
Results: Water, sediment and fish T‑Hg concentrations were 0.145–1.078 μg/L, 23.39–73.31, and 0.03–0.443 μg/g dw, respectively in Ankobra basin, while in Tano basin levels of 0.214–0.250 μg/L, 14.43–21.51, 0.068–0.413 μg/g were found for water, sediment and fish, respectively. The T‑Hg concentration in water from both basins were within the World Health Organization threshold limits for drinking water except at River Asuo Kofi. Concentration of T‑Hg in the sediment exceeded Environmental Protection Agency ecotoxicological threshold in some sampling stations, suggest‑ ing potential adverse ecological effects. T‑Hg levels in fish from both basins were lower than the WHO value (<0.500 μg/g (wet wt). The target hazard quotient values, suggest that human should minimizing meals/week of the analyzed species to avoid deleterious effect during lifetime.
Conclusions: The results suggested that mining activities significantly contribute to the considerable environmental Hg contamination in both Ankobra and Tano River basins. Therefore Hg levels should carefully monitored and con‑ trolled to reduce its inputs and mitigate potential health consequences of Hg accumulation in the environment. Keywords: Ecotoxicological thresholds, Accumulation, Target hazard quotient, Total mercury, Fish
© 2016 Asare‑Donkor and Adimado. This article is distributed under the terms of the Creative Commons Attribution 4.0 Interna‑ tional License (http://creativecommons.org/licenses/by/4.0/), which permits unrestricted use, distribution, and reproduction in any medium, provided you give appropriate credit to the original author(s) and the source, provide a link to the Creative Com‑ mons license, and indicate if changes were made.
Background
Over the last decades, mercury (Hg) is considered to be one of the environmental pollutants with the great-est impact on the biosphere and human health (Miller et al. 2011). The process by which many developing countries use elemental Hg to extract gold is becoming one of the primary sources of Hg pollution (Tomiyasu et al. 2013). In gold mining, Hg employed in its elemen-tal form to produce Gold-Hg amalgams can escape to
the atmosphere and deposited on surrounding soils and aquatic ecosystems (Rodrigues-Filho and Maddock 1997; Cesar et al. 2011). Once it reaches the ecosystems, Hg is distributed into the air, soil, water, and sediments, form-ing the largest metal deposits in the environment (Mar-tinez-Finley and Aschner 2014). Elemental Hg is highly volatile and easily dispersed at the high temperatures that often occur at sites of amalgamation and subsequently undergoes global long-range atmospheric transport and deposition that allows its accumulation in biota, with subsequent human health risks (Falandysz et al. 2014).
Moreover, leaching and soil erosion processes can also mobilize mercury to aquatic systems (Cesar et al. 2011).
Open Access
*Correspondence: asaredonkor@yahoo.co.uk
In the aquatic systems, Hg can be bio-transformed by bacteria into Hg and reached the top predators through its bioaccumulation and bio-magnification in the food chain (Ullrich et al. 2001). As a consequence, top preda-tors are expected to exhibit higher mercury concentra-tions compared to non-carnivorous species. Besides the Hg vapor occupational exposure, Hg environmental exposure via fish consumption has become an issue of concern in areas affected by Hg pollution (Castilhos et al. 1998, 2006).
People living in close proximity to artisanal mining areas are vulnerable to Hg exposure. One of the major problems of Hg is its ability to cause neurotoxicity (Woods et al. 2013) and teratogenesis (Heinz et al. 2011), as well as lesions in organs such as the liver and kidneys (Sonne et al. 2013). Much of the neurotoxicity of Hg is associated with its ability to reach the brain by binding to cysteine, which uses the neutral amino acid transporter (Aschner and Aschner 1990).
Methyl mercury, the commonest organic mercury, can accumulate in human beings through the food chain and may give rise to both acute and chronic toxicity (Tchoun-wou et al. 2003; Morel et al. 1998; Harris et al. 2003; Boening 2000). Fish samples are commonly used as an indicator of Hg exposure (Dabeka et al. 2003, 2004; Thom et al. 2006; Konig et al. 2005; Virtanen et al. 2005; Wenn-berg et al. 2007; Yoshizawa et al. 2002; D’Itri and D’Itri 1975).
Increased use of mercury in gold recovery mining operations in many developing countries has raised con-cern over its release into the environment (Oppong et al.
2010). Studies on mercury contamination and health
effects in the Amazon have been carried out (Pfeiffer and Larceda 1988; Larceda and Salomons 1991; Nriagu et al. 1992; Akagi and Nishimura 1991). However, in Ghana studies on assessment of mercury levels in water, sedi-ments, soil, food crops, fish and some human tissues have been carried out in different areas (Amonoo-Neizer et al. 1996; Adimado and Baah 2002; Golow and Adzei 2002; Bannerman et al. 2003; Bonzongo et al. 2003; Babut et al. 2003; Golow and Mingle 2002; Donkor et al. 2006).
In Ghana, small-scale and artisanal gold extraction is one of the leading causes of Hg release to aquatic ecosys-tems (Ayensu 1997). Although this activity contributes significantly to rural employment in Ghana, the apparent wealth resulting from gold mining contrasts with the loss of ecosystems, as well as both health and social impair-ment on communities. The inappropriate use of Hg and the poor technical knowledge on handling and recover-ing have facilitated Hg contamination of water bodies and the atmosphere. Since artisanal gold mining activi-ties using mercury are carried out close by the rivers, it is likely that mercury may be carried along the river.
Aquatic species like fish may be affected by this contami-nation and eventually affect living organisms that may also feed on these aquatic species. Therefore, the main aim of this study is to determine the extent of Hg pol-lution derived from gold mining in Ankobra and Tano River basins, as well as sediment contamination and the health risk due to Hg intake via fish consumption.
Methods Study area
The Ankobra Basin is one of the south-western basins of Ghana. It is located within latitudes 4°52′–6°27′N, and lon-gitudes 1°42′–2°33′W. It is bounded to the East; West and South by the Pra Basin, Tano Basin and the Gulf of Guinea, respectively. The basin has an area of 8403 km2 spanning 11 districts in three regions with Wassa Amenfi, Wassa West and Nzema East Districts. The basin falls under the South-Western Equatorial and the Wet Semi-Equatorial climatic regions. The South-Western Equatorial is the wet-test climatic region in Ghana with mean annual rainfall above 1900 mm. The vegetation of the basin comprises the Rain forest as well as the Moist-semi deciduous forest.
The Tano Basin is located in the southwestern part of Ghana and lies between latitudes 50°00′–70°40′N and longitudes 20°00′–30°15′W. The southern section is generally low in altitude, ranging between 0 and 150 m above the mean sea level. The general topography of the entire basin, however, ranges between 0 and 700 m above the mean sea level. The climate of the Tano Basin falls partly under the wet semi-equatorial and partly under south-western equatorial climatic zones of Ghana. It is thus characterized by double rainfall maxima. The Tano basin traverses three administrative regions: The Brong Ahafo, Ashanti, and Western Regions, compris-ing 21 administrative districts. There is commercial farming of cocoa, plantain, and other commercial and food crops. Only about 10 % of the landmass is used for human settlement. The forest cover represents the sec-ond highest land use pattern in the basin and follows closely after agricultural lands, occupying about 50 % of the total landmass of the basin. The remaining 40 % of the landmass is covered by forests which are largely protected areas. The Tano basin has its source within the forest in Pooyem, 4 km from Techiman, and flows roughly north–south into the sea. The basin enters the sea outside Ghana, in the Cote d’Ivoire. The main trib-utaries of the Tano River system are the Abu, Amama, Bo, Disue, Soro, Atronie, Sabom, Gaw, Kwasa, Sumre, and Totua. The Tano River System has a total
catch-ment area of about 15,000 Km2 shared between Ghana
Sampling locations
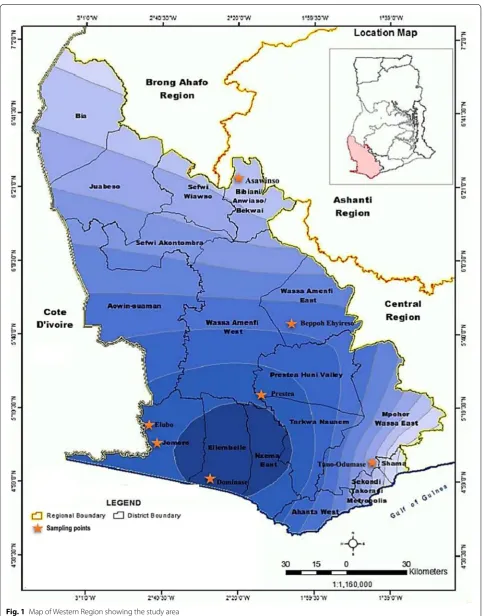
Sampling locations were carefully selected along the courses of Ankobra and Tano river (Fig. 1). These loca-tions include Asawinso, Beppoh Ehyireso, Heman-Prestea and Dominase all along the Ankobra River, and Tano-Odumase, Jomoro and Elubo, all along the Tano River. Samples were also taken from Bonsaso and Asuo Kofi River, which are tributaries of the Ankobra River.
Sample collection
Sampling was done during two periods in April/May 2014 (on-set of rainy season) and November/December 2014 (on-set of dry season) from the various locations indicated above. Depth integrated water samples were collected over bridges and preserved at about pH 2 with
conc. HNO3, whilst sediment samples were collected
through coring with a PVC tube. Two water and sedi-ment samples were taken from each location. The fish samples were collected using dragnet and stored in an ice chest at 4 °C and transported to the laboratory. The sam-ples were later identified in the laboratory and prepared for analysis.
Sample preparation
The water samples from each location were bulked and filtered through a Whatman No 41 filter paper prior to digestion. The sediment samples from each location were also bulked and dried in an oven at 60 °C to a constant weight. The dried samples were then pulverized and sieved through 20 mm-mesh size. Separate aliquots parts of the fish samples were weighed and dried in an oven at 105 °C to a constant weight.
Hg in water
5 mL concentrated H2SO4 was added to 50 mL of three representative aliquots from the bulked water sample in 100 mL volumetric flask followed by 2.5 mL concentrated HNO3 and then 15 mL of 5 % KMnO4. The mixture was allowed to stand for at least 15 min, 8 mL of 5 % K2S2O8 solution was added and then heated in a water bath at 95 °C. The sample was allowed to cool to room temper-ature after which 10 % HONH3Cl was added to reduce excess KMnO4 and then diluted with double distilled water (Greenberg et al. 1992; Perkin Elmer 1994).
Hg in sediment
About 2 ± 0.05 g of three representative aliquot from the
bulk of dry, finely ground and sieved sample was weighed into a 250 mL beaker follow by the addition of 25 mL concentrated H2SO4. A 1 mL additions of 50 % H2O2 was carefully added, allowing sufficient time for decomposi-tion of the peroxide. The sample was heated gently on a sand bath to decompose any sediment and then sufficient
amount of 5 % KMnO4 was added to the solution in
order to maintain a permanent pink color. After cooling
to room temperature, the excess KMnO4 was reduced
by addition of sufficient amount of 10 % HONH3Cl solu-tion (Larry et al. 1991). The resultant solution was then filtered into a 250 mL volumetric flask and made to mark with distilled water.
Hg in fish
Samples of fish tissue were cut into small pieces on a plastic cutting board using a stainless-steel knife. Four representative aliquots were sampled by halving and quartering prior to weighing. About 0.5 ± 0.05 g of each aliquot was weighed into a 100 mL beaker and 4 mL con-centrated H2SO4 was added followed by1 mL concen-trated HNO3 and then placed in a water bath maintained at 58 °C until the tissue completely dissolved. The sam-ple was then cooled to 4 °C in an ice bath and 5 mL of 5 % KMnO4 in 1 mL increments was cautiously added. About 8 mL of 5 % K2S2O8 was then added and allowed to stand overnight at room temperature. Excess amount of KMnO4 was reduced by addition of sufficient amount of 10 % HONH3Cl and then transferred quantitatively into a 100 mL volumetric flask and dilute to the mark.
Reagent blanks were prepared for each batch of sample and standard using equal amounts of all reagents used in the sample or standard preparation. The reagent blanks were used to correct for background absorption due to the reagent.
Analytical quality control
The quality assurance and control aspects of the analy-sis were implemented through the analytical protocols, including sampling and sample preservation, instrument performance evaluation, instrument calibration, recovery and reagent blank analyses. The instrument performance evaluation involved optimizing instrument parameters followed by sensitivity check. The measured average characteristic concentration was 0.146 ng/0.0044 A with a confidence interval of 0.146 ± 0.004 (n = 5) at the 95 % confidence level as against the instrument manufactur-ers specification of 0.138 ng/0.0044 A. The optimized instrument parameters were maintained throughout the analyses, and the average percent recoveries for Hg was recorded as 0.098 ± 0.001 (n = 5).
Calibration of instrument
to the mark with distilled water. A 1 mL of the resulting solution of concentration 1.0 mg/mL Hg was transferred into a 1 L volumetric flask and treated with concentrated H2SO4, 5 % K2S2O8 and 10 % HONH3Cl, and made up to the mark with double distilled water. The resulting solu-tion of concentrasolu-tion 1000 μg/L was diluted serially to obtain other solutions of lower concentrations.
Sample analyses
All samples were analyzed in triplicates using the cold vapor technique with Perkin-Elmer 5100PC AAS equipped with a flow injection analysis system (FIAS, AS-90). A mixture 3 % HCl and 1.1 % SnCl2 in 3 % HCl was used as a carrier solution and reducing agent respectively.
Assessment of sediment contamination
The geochemical accumulation index (Igeo) was employed as a quantitative tool to assess the level of Hg contamina-tion in sediments. This index was calculated using Eq. (1) proposed by Müller (1969):
where Cn is the sediment metal concentration; A is the constant for modifying the fluctuation of the background value caused by lithological movement, usually 1.5 (Bhui-yan et al. 2010); and Bn is the geochemical background value of the metal. In this work, two reported back-ground values were utilized: 0.06 (Lecce and Pavlowsky 2014) and 0.08 μg/g (Hortellani et al. 2013). Based on the results, Hg pollution in the sediment was classified into seven different categories: class 0 (unpolluted), Igeo ≤ 0; class 1 (unpolluted to moderately polluted), 0 ≤ Igeo ≤ 1; class 2 (moderately polluted), 1 ≤ Igeo ≤ 2; class 3 (mod-erately to strongly polluted), 2 ≤ Igeo ≤ 3; class 4 (strongly polluted), 3 ≤ Igeo ≤ 4; class 5 (strongly to extremely pol-luted), 4 ≤ Igeo ≤ 5; and class 6 (extremely contaminated), Igeo > 5 (Müller 1969).
Risk‑based consumption limits
Risk factors were calculated according to the guidelines of the US Environmental Protection Agency (US-EPA 1989, 2000), previously reported by (Marrugo-Negrete et al. 2008; Copat et al. 2013a, b). It was assumed that the ingestion dose was equal to the adsorbed Hg dose (Chien et al. 2002). Hg consumption limit calculations were based on the reference dose (RfDo) set by the US-EPA. Target hazard quotient (THQ), indicate the ratio between exposure and the reference dose, and calculations were made using the standard assumption for an integrate US-EPA risk analysis. The estimated daily intake per meal (EDIm) and for the target hazard quotient (THQ) were (1)
Igeo= log2
Cn
1.5×Bn
calculated using Eqs. (2) and (3), respectively reported by (Copat et al. 2013a, b,):
where EDIm is the estimated daily intake of Hg per meal size; MS is the standard portion size of 230 g for adults (Hosseini et al. 2013); C is the Hg concentration (mg/ kg w.w.) (Marrugo-Negrete et al. 2008); BW is the body weight of 70 kg for adults (Copat et al. 2013a). According to US-EPA (1989), when THQ risk is above 1, systemic effects may occur. RfD for T-Hg is 0.1 µg/g/day.
The allowable number of fish meals of a specific meal size that may be consumed over a given period of time was also evaluated. For noncarcinogenic effects, maxi-mum allowable fish consumption rate in meals/week (CRmw) (US-EPA 2000) that would not be expected to cause any chronic systemic effects was obtained using Eq. (4):
Considering an average adult body weight of 70 kg (USEPA 1994), the Hg USEPA Acceptable Daily Intake (ADI) can be approximated as 7 μg/day/adult (49 μg Hg/ week) (Hosseini et al. 2013).
Statistical analysis
Data for Hg analysis are presented as mean ± stand-ard deviation. Correlation or multiple linear regression analysis was used to establish relationships between the two variables. For all purposes, significance was set at p < 0.05. Statistical analysis was carried out using both Microsoft Excel (2016 edition) and statistical Package for Social Science (IBM SPSS version 20) software.
Results and discussion
Mercury in sediments and geoaccumulation analysis Levels of T-Hg in sediment samples revealed high vari-ability (Table 1). Hg recorded the maximum mean value of 73.31 μg/g at Heman Prestea and the minimum mean value of 23.39 μg/g at Beppoh Ehyireso in the Ankobra River basin. Significant levels have also been detected in other areas such as Dominase, with a mean value of 66.30 μg/g, downstream of Asuo Kofi (Table 1). The overall mean value of Hg in sediment from the Ankobra River basin was found to be 43.12 μg/g with a %RSD of 56.9. In the Tano River basin, the concentration of Hg in sediment ranged from 14.43 to 21.51 μg/g with an overall (2)
EDIm= MS×C
BW
(3)
THQ = EDIm
RfD
(4)
Crmw= 49
mean value of 17.37 μg/g with 21.2 % RSD. T-Hg con-centrations were greater than those reported for Mina Santa Cruz Marsh (gold-mining site), Colombia [0.140– 0.355 μg/g dw (Olivero and Solano 1998)] and village of Caimito, San Jorge River basin [0.155 ± 0.016 μg/g dw
(Olivero et al. 2004)]. On the other hand, considering a Hg threshold of 0.2 μg/g as the level of concern for Hg
in continental water sediments (Salomons and Förstner 1984), on average, both basins may be categorized as highly polluted.
Based on sediment T-Hg levels, sampling sites repre-senting the two basins have significant differences between them (p > 0.05). Heman Prestea, has the highest concentra-tions, and it receives a direct impact from gold mining along the Ankobra River, where Hg used during gold amalgama-tion reaches the river together with washed sediments.
The Igeo data for the sampling sites are presented in Table 1. The Mullers geochemical index (Igeo) values ranged from 8.02–9.67 and 7.32–7.90 for both Anko-bra and Tano River basin, respectively. According to the Igeo indexes, Hg pollution in these sediments classifies them as highly to strongly polluted (class 6), comparable to sediments found in an abandoned gold mining area in southern Minas Gerais State, Brazil (Cesar et al. 2011) and the Middle Odra River (Germany/Poland) (Boszke et al. 2004). These concentrations are far from the allowable limit of 0.81 μg/g suggested by the International Atomic Energy Agency (IAEA) (Kwaansa-Ansah et al. 2011). Table 1 Hg concentrations in sediment (µg/g) collected
from the Ankobra and Tano River Basins
Site Hg (µg/g) Igeo Sediment quality
Ankobra
Basin AsawinsoBeppoh Ehyireso 23.39 27.76 ±± 8.55 8.27 Extremely contaminated 7.05 8.02 Extremely contaminated Heman Prestea 73.31 ± 55.60 9.67 Extremely contaminated Dominase 66.30 ± 51.51 9.52 Extremely contaminated Bonsaso 24.82 ± 9.94 8.11 Extremely contaminated Tano
Basin Tano OdumasiJomoro 14.43 16.18 ±± 4.47 7.32 Extremely contaminated 4.08 7.49 Extremely contaminated Elubo 21.51 ± 0.24 7.90 Extremely contaminated
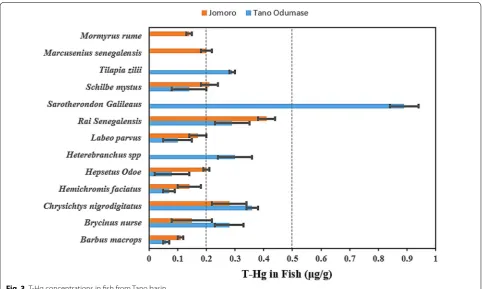
Mercury in Fish from the Ankobra and Tano River basins The average muscle T-Hg concentrations in fish are depicted in Figs. 2 and 3. The Ankobra River basin meas-ured levels of T-Hg in the range of 0.03–0.443 μg/g (wet wt), whereas Tano River basin measured T-Hg concen-tration in the range of 0.068–0.413 μg/g (wet wt). The highest T-Hg concentrations were observed in Tano Odumase, (Sarotherodon Galilaeus, 0.89 ± 0.05 μg/g).
In Tano Basin, Tilapia guineensis recorded lower T-Hg levels of 0.03 ± 0.01 μg/g. The overall mean T-Hg
con-centration was found to be <0.5 μg/g fresh wt, the maxi-mum T-Hg concentration that should be present in fish for human consumption according to JOINT FAO/WHO (2010), except Sarotherondon Galilaeus.
To protect vulnerable people, in particular, preg-nant women, those under 15 years of age, and frequent
fish consumers, the WHO (1990) has recommended
the lower T-Hg guideline of 0.2 μg/g fresh wt for those groups. T-Hg concentrations found in most fish species were higher than 0.2 μg/g.
Risk‑based consumption limits
Estimated EDIm, THQ, and CRmw values are presented in Table 2. Values of estimated daily intake per meal size of seafood for humans in some species were higher than the accepted tolerable intake provided by Joint FAO/WHO
Expert Committee on Food Additive (JECFA 2010), sug-gesting that levels of assumed exposure are likely to cause deleterious effect during lifetime in humans. The specific consumption limits obtained, confirming THQ values above 1, indicate that it would be appropriate to minimize the weekly meals of the analyzed fish species, to avoid the chronic systemic effects due to Hg content. Special concern are Hemichromis fasciatus, Schilbe intermedius, Hepsetus Odoe, Rai Senegalensis, Sarotherodon Tila-pia zillii, Galilaeus Brycinus nurse, Heterobranchus spp, Chrysichthys nigrodigitatus and Chrysichthys nigrodigita-tus species. All the CRmw values were > 14 meals/week. Tano basin showed the lowest level of fish meals sug-gested. EDIm, THQ, and CRmw results, indicates that the species that can be eaten with low risk for human health are Tilapia guineensis, Barbus macrops, Schilbe mystus, Chromidotilopia guntheri, Liza grandisquamis, Labeo parvus, and Mormyrus rume.
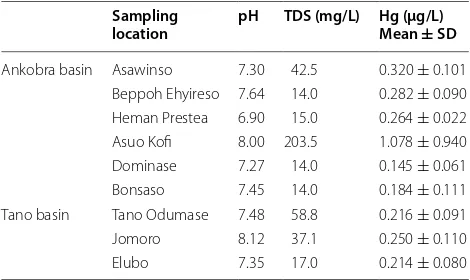
Mercury in water
Table 2 Estimated daily intake per meal (EDIm) (µg/g daily), target hazard quotient (THQ), and maximum allowable fish consumption rate in meals/week (CRmw) in adults
Sampling sites Fish species T‑Hg (μg/g)
Mean ± SD EDIm THQ CRmw
Ankobra basin
Asawinso Tilapia zillii 0.22 ± 0.05 0.79 7.86 1
Tilapia guineensis 0.03 ± 0.01 0.11 1.07 7
Hepsetus Odoe 0.23 ± 0.03 0.82 8.21 1
Hemichromis fasciatus 0.28 ± 0.09 1.00 10.00 1
Schilbe intermedius 0.29 ± 0.04 1.04 10.36 1
Heterobranchus spp. 0.08 ± 0.02 0.29 2.86 3
Chrysichthys nigrodigitatus 0.10 ± 0.01 0.36 3.57 2
Beppoh Ehyireso Tilapia zillii 0.04 ± 0.02 0.14 1.43 5
Hemichromis fasciatus 0.41 ± 0.03 1.46 14.64 1
Tilapia guineensis 0.18 ± 0.09 0.64 6.43 1
Heterobranchus spp 0.20 ± 0.07 0.71 7.14 1
Sarotherodon galilaeus 0.07 ± 0.02 0.25 2.50 3
Barbus macrops 0.10 ± 0.01 0.36 3.57 2
Schilbe mystus 0.12 ± 0.01 0.43 4.29 2
Hepsetus Odoe 0.07 ± 0.03 0.25 2.50 3
Heman prestea Hepsetus Odoe 0.44 ± 0.07 1.57 15.71 0
Tilapia guineensis 0.04 ± 0.06 0.14 1.43 5
Barbus macrops 0.08 ± 0.01 0.29 2.86 3
Sarotherodon galilaeus 0.11 ± 0.02 0.39 3.93 2
Chromidotilopia guntheri 0.15 ± 0.05 0.54 5.36 1
Heterobranchus spp 0.07 ± 0.06 0.25 2.50 3
Schilbe mystus 0.21 ± 0.04 0.75 7.50 1
Bonsaso Schilbe mystus 0.04 ± 0.01 0.14 1.43 5
Brycinus nurse 0.13 ± 0.03 0.46 4.64 2
Hepsetus Odoe 0.20 ± 0.04 0.71 7.14 1
Barbus macrops 0.17 ± 0.01 0.61 6.07 1
Heterobranchus spp 0.08 ± 0.02 0.29 2.86 3
Dominase Schilbe mystus 0.09 ± 0.03 0.32 3.21 2
Barbus macrops 0.13 ± 0.02 0.46 4.64 2
Liza falcipinnis 0.08 ± 0.01 0.29 2.86 3
Chrysichthys nigrodigitatus 0.22 ± 0.09 0.79 7.86 1
Liza grandisquamis 0.10 ± 0.06 0.36 3.57 2
Tano basin
Tano odumase Rai Senegalensis 0.29 ± 0.06 1.04 10.36 1
Labeo parvus 0.10 ± 0.05 0.36 3.57 2
Sarotherodon Galilaeus 0.89 ± 0.05 3.18 31.79 0
Barbus macrops 0.06 ± 0.01 0.21 2.14 4
Hemichromis fasciatus 0.07 ± 0.02 0.25 2.50 3
Brycinus nurse 0.28 ± 0.05 1.00 10.00 1
Schilbe mystus 0.14 ± 0.06 0.50 5.00 2
Heterobranchus spp 0.30 ± 0.06 1.07 10.71 1
Chrysichthys nigrodigitatus 0.36 ± 0.02 1.29 12.86 1
Tilapia zillii 0.29 ± 0.01 1.04 10.36 1
mean level of Hg in the entire Ankobra River basin is 0.348 μg/L with a root square deviation (RSD) of 94.0 %. The maximum mean concentration of Hg in the Tano River basin was found to be 0.250 μg/L at Jomoro whilst the minimum mean value of 0.214 μg/L was recorded at Elubo. The maximum concentration of were below the WHO guideline value of 1.00 μg/L for drinking water
(WHO 1985). The corresponding mean value for the
entire Tano River basin is 0.227 µg/L. Comparing the overall mean values for the two River basins, the Anko-bra River basin is being impacted more with Hg pollution than the Tano River basin.
It is quite apparent that in areas of high discharges of trace metals usually associated with mining activities, these metals do not occur in very high concentrations in surface waters. The pH range of 6.0–8.0 as observed for water from both the Ankobra and Tano River basin and in the presence of suspended solids, adsorption and co-precipitation processes can remove metals such as Hg from solutions as sulfides under anoxic conditions (Hamilton 1971). This may account for the observed low concentrations of Hg in water from both River basins as
compared to the very high Hg concentrations in sedi-ments (Table 1). Water T-Hg values found in this study are lower than those reported for other rivers contami-nated with artisanal gold mining in Ghana [162–164 ng/L (Donkor et al. 2006)], Indonesia [up to 250 ng/L (Lim-bong et al. 2005)] and Brazil [up to 800 ng/L (Palheta and Taylor 1995)].
Conclusions
The study revealed considerable Hg contamination in sediment, water and fish collected from the Anko-bra and Tano River basins which drain the major gold mining areas in Ghana. Human T-Hg concentrations together with the THQ data indicates more extensive and intensive ecological and environmental health studies in the region by the local government. Although fish are considered the main source of Hg exposure, they are the only source of protein from the daily food intake of many populations in this region. In addition, it should be pointed out that, besides fish eaters, min-ers are exposed to Hg but in its inorganic form, and this could also end up in severe health problems. However, since Hg like any other heavy metal undergo bioaccu-mulation and bio magnification, the levels should be carefully monitored and controlled to minimize inputs of Hg into the environment to mitigate the potential health risk associated with Hg exposure through fish consumption.
Abbreviations
AAS: atomic absorption spectrophotometer; CF: contamination factor; Igeo: geochemical index; RSD: relative standard deviation; FIAS: flow injection analy‑ sis system; BW: body weight; EPA: Environmental Protection Agency; WHO: World Health Organization; FAO: Food and Agricultural Organization; THQ: target hazard quotient; EDIm: estimated daily intake per meal; CRmw: consump‑ tion rate in meal/weak.
Authors’ contributions
All authors read and approved the final manuscript.
Table 2 continued
Sampling sites Fish species T‑Hg (μg/g)
Mean ± SD EDIm THQ CRmw
Jomoro Chrysichthys nigrodigitatus 0.28 ± 0.06 1.00 10.00 1
Rai senegalensis 0.41 ± 0.03 1.46 14.64 1
Hepsetus Odoe 0.20 ± 0.01 0.71 7.14 1
Marcusenius senegalensis 0.20 ± 0.02 0.71 7.14 1
Schilbe mystus 0.21 ± 0.03 0.75 7.50 1
Mormyrus rume 0.14 ± 0.01 0.50 5.00 2
Barbus macrops 0.11 ± 0.01 0.39 3.93 2
Hemichromis fasciatus 0.14 ± 0.04 0.50 5.00 2
Labeo parvus 0.17 ± 0.03 0.61 6.07 1
Brycinus nurse 0.15 ± 0.07 0.54 5.36 1
Table 3 Mean concentrations of Hg in water from Ankobra and Tano basin (n = 6)
Sampling
location pH TDS (mg/L) Hg (μg/L) Mean ± SD
Acknowledgements
The authors gratefully acknowledge Dr. Kofi Abban of the Fisheries Biology Department of the Water research Institute, CSIR, for identifying the fish species.
Competing interests
The authors declare that they have no competing interests.
Received: 13 October 2015 Accepted: 12 January 2016
References
Adimado AA, Baah DA (2002) Mercury in human blood, urine, hair, nail and fish from the Ankobra and Tano river Basin in South Western Ghana. Bull Environ Contam Toxicol 68:339–346
Akagi H, Nishimura H (1991) Speciation of mercury in the environment. In: Suzuki T, Imura N, Clarkson TW (eds) Advances in mercury toxicology. Plenum Press, New York, pp 53–76
Amonoo‑Neizer EH, Nyamah D, Bakiamoh SB (1996) Mercury and arsenic pol‑ lution in soil and biological samples around the mining towns of Obuasi, Ghana. Water Air Soil Pollut 91:363–373
Aschner M, Aschner JL (1990) Mercury neurotoxicity: mechanisms of blood‑brain barrier transport. Neurosci Biobehav Rev 14(2):169–176. doi:10.1016/S0149‑7634(05)80217‑9
Ayensu EA (1997) Ashanti Gold, Marshad Edition Development Ltd, p 90–92 Babut M, Sekyi R, Rambaud A (2003) Improving the environmental manage‑ ment of small scale gold mining in Ghana: a case study of Dumasi. J Cleaner Prod 11:215–221
Bannerman W, Potin‑Gautier M, Amouroux D, Tellier S, Rambaud A, Babut M, Adimado A, Beinhoff C (2003) Mercury and arsenic in the gold mining regions of the Ankobra river basin in Ghana. J Phys IV 107:107–110 Bhuiyan MA, Parvez L, Islam M, Dampare SB, Suzuki S (2010) Heavy metal
pollution of coal mine‑affected agricultural soils in the northern part of Bangladesh. J Hazard Mater 173(1):384–392. doi:10.1016/j. jhazmat.2009.08.085
Boening DW (2000) Ecological effects, transport, and fate of mercury: a gen‑ eral review. Chemosphere 40(12):1335–1351
Bonzongo JC, Donkor AK, Nartey VK (2003) Environmental impacts of mercury related to artisanal gold mining in Ghana. J Phy IV 107:217–220 Boszke L, Sobczynski T, Glosinska G, Kowalski A, Siepak J (2004) Distribution
of mercury and other heavy metals in bottom sediments of the Middle Odra River (Germany/Poland). Pol J Environ Stud 13(5):495–502 Castilhos ZC, Bidone ED, Lacerda LD (1998) Increase of the reference human
exposure to mercury through fish consumption due to gold mining at the Tapajos river region, Amazon. Bull Environ Cont Toxicol 6:202–209. doi:10.1007/s001289900749
Castilhos ZC, Rodrigues‑Filho S, Rodrigues APC, Viilas‑Bôas RCV, Siegel S, Veiga M, Beinhoff C (2006) Mercury contamination in fish from gold mining areas in Indonesia and human health risk assessment. Sci Total Environ 368:320–325. doi:10.1016/j.scitotenv.2006.01.039
Cesar R, Egler S, Polivanov H, Castilhos Z, Rodrigues AP (2011) Mercury, copper and zinc contamination in soils and fluvial sediments from an abandoned gold mining area in southern Minas Gerais State, Brazil. Environ Earth Sci 64:211–222. doi:10.1007/s12665‑010‑0840‑8
Chien LC, Hung TC, Choang KY, Yeh CY, Meng PJ, Shieh MJ, Han BC (2002) Daily intake of TBT, Cu, Zn, Cd and As for fishermen in Taiwan. Sci Total Environ 285(1):177–185
Copat C, Arena G, Fiore M, Ledda C, Fallico R, Sciacca S, Ferrante M (2013a) Heavy metals concentrations in fish and shellfish from eastern Mediter‑ ranean Sea: consumption advisories. Food Chem Toxicol 53:33–37. doi:10.1016/j.fct.2012.11.038
Copat C, Conti GO, Signorelli C, Marmiroli S, Sciacca S, Vinceti M, Ferrante M (2013b) Risk assessment for metals and PAHs by mediterranean seafood. Food Nut Sci 4(7A):10–13. doi:10.4236/fns.2013.47A002
D’Itri FM, D’Itri PA (1975) Progress Water Technol 7:223–227
Dabeka RW, McKenzie AD, Bradley P (2003) Survey of total mercury in total diet food composites and an estimation of the dietary intake of mercury by adults and children from two Canadian cities, 1998–2000. Food Addit Contam 20(7):629–638
Dabeka RW, McKenzie AD, Forsyth DS, Conacher HBS (2004) Survey of total mercury in some edible fish and shellfish species collected in Canada in 2002. Food Addit Contam 21(5):434–440
Donkor AK, Bonzongo JC, Nartey VK, Adotey DK (2006) Mercury in different environmental compartments of the Pra River Basin, Ghana. Sci Total Environ 368:164–176
Falandysz J, Dryżałowska A, Saba M, Wang J, Zhang D (2014) Mercury in the fairy‑ring of Gymnopus erythropus (Pers.) and Marasmius dryo‑ philus (Bull.) P. Karst. mushrooms from the Gongga Mountain, Eastern Tibetan Plateau. Ecotoxicol Environ Saf 104:18–22. doi:10.1016/j. ecoenv.2014.02.012
Golow AA, Adzei EA (2002) Mercury in surface soil and cassava crop near an alluvial goldmine at Dunkwa‑on‑Offin, Ghana. Bull Environ Contam Toxicol 69:228–235
Golow AA, Mingle LC (2002) Mercury in river water and sediments in some rivers near Dunkwa‑on‑Offin, an alluvial goldmine, Ghana. Bull Environ Contam Toxicol 70:379–384
Greenberg EA, Clesceri LS, Eaton AD (1992) Standard Methods for Examination of Water and Waste Water, 18th edn
Hamilton A (1971) Proc. Intern. Sympos. On mercury in man’s environment. Prog Soc Conf Ottawa, p 87
Harris HH, Pickering IJ, George GN (2003) The chemical form of mercury in fish. Science 301:1203
Heinz GH, Hoffman DJ, Klimstra JD, Stebbins KR, Kondrad SL, Erwin CA (2011) Teratogenic effects of injected methylmercury on avian embryos. Environ Toxicol Chem 30(7):1593. doi:10.1002/etc.530
Hortellani MA, Sarkis JE, Menezes LC, Bazante‑Yamaguishi R, Pereira AS, Garcia PF, Maruyama L, Castro PM (2013) Assessment of metal concentration in the billings reservoir sediments, São Paulo State, Southeastern Brazil. J Braz Chem Soc 24(1):58–67. doi:10.1590/S0103‑50532013000100009 Hosseini SM, Mirghaffari N, Sufiani NM, Hosseini SV, Ghasemi AF (2013) Risk
assessment of the total mercury in Golden gray mullet (Liza aurata) from Caspian Sea. Intl J Aquat Biol 1(6):258–265
JOINT FAO/WHO expert consultation on the risks and benefits of fish con‑ sumption (2010) health risks associated with fish consumption focus on methylmercury, dioxins and dioxin‑like PCBS EC: RBFC/2010/3 Konig A, Bouzan C, Cohen JT, Connor WE, Kris‑Etherton PM, Gray GM,
Lawrence RS, Savitz DA, Teutsch SM (2005) A quantitative analysis of fish consumption and coronary heart disease mortality. Am J Prev Med 29:335–346
Kwaansa‑Ansah E, Agorku S, Nriagu J (2011) Levels of total mercury in dif‑ ferent fish species and sediments from the Upper Volta Basin at Yeji in Ghana. Bull Environ Contam Toxicol 86(4):406–409. doi:10.1007/ s00128‑011‑0214‑2
Larceda LD, Salomons W (1991) Mercury in the Amazon. A chemical time bomb? Dutch Ministry of Housing, Physical planning and the environ‑ ment. Hague
Larry B, Lobring, Billy BP (1991) Eds. Methods for the Determination of Metals in Environmental Samples. USEPA, p 266
Lecce SA, Pavlowsky RT (2014) Floodplain storage of sediment contaminated by mercury and copper from historic gold mining at Gold Hill, North Carolina, USA. Geomorphology 206:122–132
Limbong D, Kumampung J, Ayhuan D, Arai T, Miyazaki N (2005) Mercury pollu‑ tion related to artisanal gold mining in north Sulawesi Island, Indonesia. Bull Environ Contam Toxicol 75:989–996
Marrugo‑Negrete J, Benitez LN, Olivero‑Verbel J (2008) Distribution of mercury in several environmental compartments in an aquatic ecosystem impacted by gold mining in northern Colombia. Arch Environ Contam Toxicol 55(2):305–316. doi:10.1007/s00244‑007‑9129‑7
Martinez‑Finley EJ, Aschner M (2014) Recent advances in mercury research. Curr Environ Health Rep 1(2):163–171. doi:10.1007/s40572‑014‑0014‑z Miller MB, Gustin MS, Eckley CS (2011) Measurement and scaling of air–
surface mercury exchange from substrates in the vicinity of two Nevada gold mines. Sci Total Environ 409(19):3879–3886. doi:10.1016/j. scitotenv.2011.05.040
Morel FMM, Kraepiel AML, Amyot M (1998) Photooxidation of Hg(0) in an estuarine system. Annu Rev Ecol Syst 29:543–566
Müller G (1969) Index of geoaccumulation in the sediments of the Rhine River. Geoj 2(3):108–118
Olivero J, Solano B (1998) Mercury in environmental samples from a water‑ body contaminated by gold mining in Colombia, South America. Sci Total Environ 217:83–89
Olivero J, Johnson B, Mendoza C, Paz R, Olivero R (2004) Mercury in the aquatic environment of the village of Caimito in the Mojana region, north of Colombia. Water Air Soil Pollut 159:409–420
Oppong SOB, Voegborlo RB, Agorku SE, Adimado AA (2010) Total Mercury in Fish, Sediments and Soil from the River Pra Basin, Southwestern Ghana. Bull Environ Contam Toxicol 85:324–329. doi:10.1007/s00128‑010‑0059‑0 Palheta D, Taylor A (1995) Mercury in environmental and biological samples from a
gold mining area in the Amazon region of Brazil. Sci Total Environ 168:63–69 Perkin Elmer (1994) Analytical Methods for Atomic Absorption Spectropho‑
tometry, p 136
Pfeiffer WC, Larceda LD (1988) Mercury input into the Amazon region, Brazil. Environ Technol Lett 9:325–330
Rodrigues‑Filho S, Maddock JEL (1997) Mercury pollution in two gold mining areas of the Brazilian Amazon. J Geoch Expl 58:231–240
Salomons W, Förstner U (1984) Metals in the hydrocycle. Springer, New York Sonne C, Leifsson PS, Dietz R (2013) Liver and renal lesions in mercury con‑
taminated narwhals (Monodon monoceros) from North West Greenland. Toxicol Environ Chem 95(3):1–14. doi:10.1080/02772248.2013.783666 Tchounwou PB, Ayensu WK, Ninashvili N, Sutton D (2003) Environmental expo‑
sure to mercury and its toxicopathologic implications for public health. Environ Toxicol 18:149–175
Thom T, Haase N, Rosamond W, Howard VJ, Rumsfeld J, Manolio T, Zheng ZJ, Flegal K, O’Donnell C, Kittner S, Lloyd‑Jones D, Goff DC Jr, Hong Y, Adams R, Friday G, Furie K, Gorelick P, Kissela B, Marler J, Meigs J, Roger V, Sidney S, Sorlie P, Steinberger J, Wasserthiel‑Smoller S, Wilson M, Wolf P (2006) Heart disease and stroke statistics‑2006 update: a report from the American Heart Association Statistics Committee and Stroke Statistics Subcommittee. Circulation 113:e85–e151
Tomiyasu T, Kono Y, Kodamatani H, Hidayati N, Rahajoe JS (2013) The distribu‑ tion of mercury around the small‑scale gold mining area along the Cikaniki river, Bogor, Indonesia. Environ Res 125:12–19. doi:10.1016/j. envres.2013.03.015
Ullrich SM, Tanton TW, Abdrashitova SA (2001) Mercury in the aquatic environ‑ ment: a review of factors affecting methylation. Crit Rev Environ Sci Technol 31(3):241–293
US‑EPA (1989) Risk assessment guidance for superfund, vol. I. human health evaluation manual (Part A), Interim final. EPA 540/1–89/002. United States Environmental Protection Agency, Washington, DC
US‑EPA (2000) Guidance for assessing chemical contamination data for use in fish advisories, vol. II. Risk assessment and fish consumption limits. EPA/823‑B94‑004. United States Environmental Protection Agency, Washington, DC
Virtanen JK, Voutilainen S, Rissanen TH, Mursu J, Tuomainen TP, Korhonen MJ, Valkonen VP, Seppanen K, Laukkanen JA, Salonen JT (2005) Mercury, fish oils, and risk of acute coronary events and cardiovascular disease, coronary heart disease, and all‑cause mortality in men in eastern Finland. Arterioscler Thromb Vasc Biol 25:228–233
Wennberg M, Bergdahl IA, Stegmayr B, Hallmans G, Lundh T, Skerfving S, Stromberg U, Vessby B, Jansson JH (2007) Fish intake, mercury, long‑chain n‑3 polyunsaturated fatty acids and risk of stroke in northern Sweden. Br J Nutr 98:1038–1045
Woods JS, Heyer NJ, Russo JE, Martin MD, Pillai PB, Farin FM (2013) Modifica‑ tion of neurobehavioral effects of mercury by genetic polymorphisms of metallothionein in children. Neurotoxicol Teratol 39:36–44. doi:10.1016/j. ntt.2013.06.004
World Health Organisation (1985) Environmental Pollution control in Relation to Development. WHO Experts Committees Report, Geneva, p 39 World Health Organisation (1990) Methylmercury. Environmental Health
Criteria 101. World Health Organization, Geneva