Other uses, including reproduction and distribution, or selling or licensing copies, or posting to personal, institutional or third party
websites are prohibited.
In most cases authors are permitted to post their version of the article (e.g. in Word or Tex form) to their personal website or institutional repository. Authors requiring further information
regarding Elsevier’s archiving and manuscript policies are encouraged to visit:
Animal Feed Science and Technology 146 (2008) 160–168
Short communication
Phytate utilization and phosphorus excretion by
broiler chickens fed diets containing cereal
grains varying in phytate and
phytase content
A.B. Leytem
a
,
∗
, B.P. Willing
b
, P.A. Thacker
b
aUSDA-ARS, Northwest Irrigation and Soils Research Laboratory, 3793 N. 3600 E.,
Kimberly, ID 83341-5076, USA
bDepartment of Animal and Poultry Science, University of Saskatchewan,
Saskatoon, Saskatchewan, S7N 5A8, Canada
Received 2 July 2007; received in revised form 8 November 2007; accepted 9 November 2007
Abstract
Eighty, 12-day-old, male broiler chicks, were fed one of four diets to determine the effects of feeding grains varying in phytate phosphorus (P) and intrinsic phytase activity on ileal and excreta P digestibility and composition. The diets contained approximately 970.7 g grain kg−1 (maize, high
fat–low lignin oat, normal barley or low-phytate barley) with the cereal supplying the sole source of dietary P. The diets were fed for a 7-day acclimation period followed by a 2 day excreta collection while ileal digesta was collected at slaughter on day 21. The coefficients of ileal apparent digestibility (CIAD) for P and phytate P ranged from 0.79 (normal barley) to 0.86 (maize and low-phytate barley) and 0.76 (low-phytate barley) to 0.89 (maize), respectively. The CIAD for phytate P was significantly greater in the maize and high fat–low lignin oat diets, while the low-phytate barley diet had the lowest coefficient (P>0.002). The coefficients of total tract apparent digestibility (CTTAD) for P and phytate P ranged from 0.25 (maize) to 0.35 (low-phytate barley) and 0.90 (maize and low-phytate barley) to 0.96 (high fat–low lignin oat), respectively, with no significant differences between diets. There was
Abbreviations: AOAC, Association of Official Analytical Chemists; Ca, calcium; CIAD, coefficient of ileal apparent digestibility; Cr, chromium; CTTAD, coefficient of total tract apparent digestibility; P, phosphorus;31P
NMR, 31-phosphorus nuclear magnetic resonance spectroscopy. ∗ Corresponding author. Tel.: +1 208 423 6530; fax: +1 208 423 6555.
A.B. Leytem et al. / Animal Feed Science and Technology 146 (2008) 160–168 161
very little phytate P in excreta regardless of the type of grain fed (<0.13 of total P) with no significant differences between diets. Phytate P degradation was not related to the level of intrinsic phytase in the diet. In summary, current results indicate that, regardless of the type of grain fed, dietary phytate P is highly digestible when large amounts of calcium and P are not added into poultry diets and little phytate P is excreted.
© 2007 Elsevier B.V. All rights reserved.
Keywords: Endogenous phytase; Phytate degradation; Poultry; Phosphorus; NMR
1. Introduction
The environmental fate of phosphorus (P) in poultry manure is determined in part by
its chemical composition (
Leytem et al., 2006
). Soil sorption capacity differs among the
various forms of P with phytate P being very tightly bound to soil while other P forms
such as phosphates are more mobile (
Celi and Barberis, 2005
). Therefore, dietary factors
that influence the amount of phytate P excreted by poultry could alter the solubility of the
resultant excreta and impact their potential for P loss once applied to agricultural soils. One
factor that could affect the solubility of the P in poultry excreta is the type of grain that they
are fed. There is little published data examining phytate P degradation and P characterization
of ileal digesta and excreta from birds fed various grains. Therefore, the current experiment
was conducted to test the hypothesis that feeding broiler chickens grains, varying in phytate
P and intrinsic phytase activities, would influence the utilization of dietary phytate P and
the form in which P is excreted.
2. Material and methods
2.1. Experimental diets
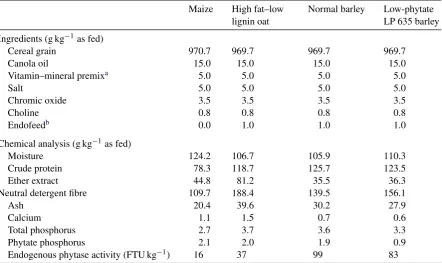
Eighty, 12-day-old, male broiler chicks (Ross-308 line, Lilydale Hatchery, Wynyard, Saskatchewan), weighing 1578±161 g, were fed one of four diets in a completely randomized block design (Table 1). The grains used as the principle ingredient in the four experimental diets were com-mercial grade maize, a newly developed high fat–low lignin oat (CDC SO-1), Harrington barley and a low-phytate, mutant barley (LP 635) containing approximately 0.50 of the phytate P found in normal barley. No supplemental protein, calcium (Ca) or P was included in the diet as their inclusion might have masked differences in phytate P utilization and P excretion resulting from the grain. However, sufficient other vitamins and minerals were added to meet or exceed the levels recommended by theNational Research Council (1994). Diets were supplemented with 1 g enzyme (Endofeed, GNC Bioferm Inc., Saskatoon, Sask) kg−1 to avoid potential digestibility problems arising from the
pres-ence of-glucans and pentosans in the grains. The experimental diets were provided in mash form (3 mm screen) and contained 3.5 g chromic oxide kg−1as an indigestible marker.
2.2. Bird housing and management
Table 1
Ingredient composition and chemical analysis of diets used to determine phytate utilization and ileal and excreta phosphorus characterization of broiler chicks fed diets based on various cereal grains
Maize High fat–low lignin oat
Normal barley Low-phytate LP 635 barley Ingredients (g kg−1as fed)
Cereal grain 970.7 969.7 969.7 969.7
Canola oil 15.0 15.0 15.0 15.0
Vitamin–mineral premixa 5.0 5.0 5.0 5.0
Salt 5.0 5.0 5.0 5.0
Chromic oxide 3.5 3.5 3.5 3.5
Choline 0.8 0.8 0.8 0.8
Endofeedb 0.0 1.0 1.0 1.0
Chemical analysis (g kg−1as fed)
Moisture 124.2 106.7 105.9 110.3
Crude protein 78.3 118.7 125.7 123.5
Ether extract 44.8 81.2 35.5 36.3
Neutral detergent fibre 109.7 188.4 139.5 156.1
Ash 20.4 39.6 30.2 27.9
Calcium 1.1 1.5 0.7 0.6
Total phosphorus 2.7 3.7 3.6 3.3
Phytate phosphorus 2.1 2.0 1.9 0.9
Endogenous phytase activity (FTU kg−1) 16 37 99 83
a Supplied per kilogram of diet: 11,000 IU vitamin A (retinyl acetate + retinyl palmitate), 2200 IU vitamin D 3,
30 U vitamin E (dl-␣-topheryl acetate), 2.0 mg menadione, 1.5 mg thiamine, 6.0 mg riboflavin, 60 mg niacin, 4 mg pyridoxine, 0.02 mg vitamin B12, 10.0 mg pantothenic acid, 6.0 mg folic acid, 0.15 mg biotin, 0.625 mg ethoxyquin,
500 mg calcium carbonate, 80 mg iron, 80 mg manganese, 10 mg copper, 0.8 mg iodine, 0.3 mg selenium.
b GNC Bioferm, Saskatoon, Saskatchewan. Provided 750 units g−1of -glucanase and 650 units g−1of
pen-tosanase.
There were five birds per pen and four replicate pens per treatment. Feed and water were availablead libitumthroughout the 9-day experiment. The battery brooder temperature was maintained at 22◦C. Incandescent lighting (23 h light, 1 h dark) was provided with a lighting intensity of 10 lux.
The broilers were given a 7-day period to adapt to the experimental diets. Following adaptation, clean excreta (free from feathers and feed) were collected twice a day (morning and afternoon) for two consecutive days from plastic liners placed in the collection trays underneath each pen. The pooled samples were then frozen. Prior to analysis, the samples were dried in a forced air oven at 55◦C for 72 h, followed by fine grinding (<1 mm). Following the final excreta collection on day 21, the birds were killed by cervical dislocation and the entire intestinal length from the proventriculus to the cloaca was excised. The entire content of the ileum from two birds was placed into a single 15 mL conical tube and snap frozen in liquid nitrogen to arrest microbial activity. The samples were lyophilized and ground (<2 mm) prior to analysis.
2.3. Chemical analysis of feed, ileal digesta, and excreta
A.B. Leytem et al. / Animal Feed Science and Technology 146 (2008) 160–168 163
as “phytase units” or “FTU” per unit of feed; 1 FTU is the amount of phytase that liberates 1mol of inorganic P per minute from an excess of sodium phytate at pH 5.5 and 37◦C) was determined according to the method ofEngelen et al. (2001).
Samples of feed and excreta were wet-ashed and total P was determined colorimetrically (Phar-macia LKB Ultraspec III, Cambridge, England) using a molybdovanadate reagent (AOAC method 965.17). The ferric precipitation method was used to extract and precipitate the phytate P and the result-ing extracts were analyzed for phytate by a colorimetric assay followresult-ing the procedures described by Leytem et al. (2007). Chromic oxide was determined by the method ofFenton and Fenton (1979). The P composition of the ileal digesta and excreta was determined by solution 31-P nuclear magnetic resonance spectroscopy (31P NMR) as described byLeytem et al. (2007). This method was used as it
allows simultaneous identification and quantification of all P compounds with one extraction method and analytical procedure.
2.4. Calculations and statistical analyses
The coefficients of ileal (CIAD) and total tract apparent digestibility (CTTAD) (i.e. overall reten-tion) were calculated using the indicator method based on the following equation:
CIAD or CTTAD=1−
Crdiet
Crout ×
Nutout
Nutdiet
(1)
where Crdiet was the initial chromic oxide concentration in the diet; Nutdiet was the initial dietary
concentration of the nutrient or dietary component (i.e. dry matter, P and phytate P) being assessed; and Crout and Nutout were the respective concentrations of either chromic oxide or nutrient/dietary
component in the ileal digesta or excreta, respectively. Data were analyzed as a one-way Analysis of Variance using the Proc Mixed procedure of the Statistical Analysis Software Institute (2004). Where appropriate, means for treatments were compared using Tukey’s procedure. Differences were considered significant when P<0.05.
3. Results
3.1. Chemical analysis of feed
The total P concentrations ranged from 2.7 g P kg−1for the maize diet to 3.7 g P kg−1for the high
fat–low lignin oat diet (Table 1). Phytate P concentration ranged from 0.90 g P kg−1for the low-phytate barley to 2.1 g P kg−1for maize. Endogenous phytase activity ranged from 16 FTU phytase kg−1for
maize to 99 FTU phytase kg−1for the normal barley.
3.2. Apparent digestibility
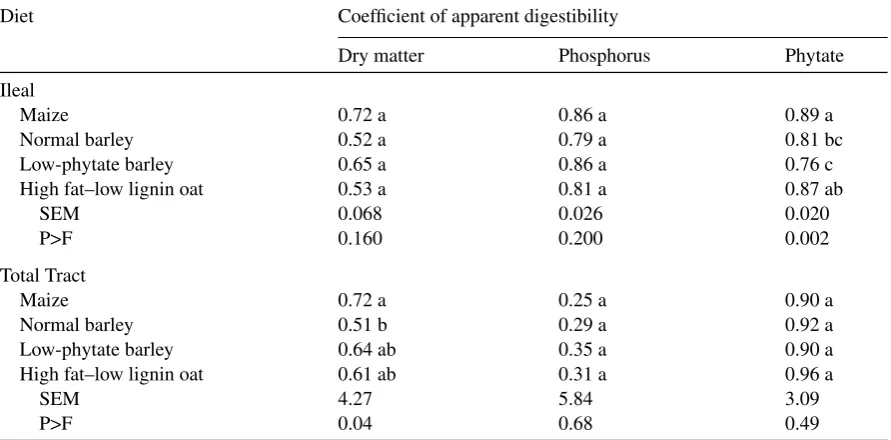
Table 2
Coefficients of ileal and total tract apparent digestibility for dry matter, phosphorus and phytate phosphorus from diets comprised of maize, normal barley, low-phytate barley and high fat–low lignin oat fed to broilers
Diet Coefficient of apparent digestibility
Dry matter Phosphorus Phytate
Ileal
Maize 0.72 a 0.86 a 0.89 a
Normal barley 0.52 a 0.79 a 0.81 bc
Low-phytate barley 0.65 a 0.86 a 0.76 c
High fat–low lignin oat 0.53 a 0.81 a 0.87 ab
SEM 0.068 0.026 0.020
P>F 0.160 0.200 0.002
Total Tract
Maize 0.72 a 0.25 a 0.90 a
Normal barley 0.51 b 0.29 a 0.92 a
Low-phytate barley 0.64 ab 0.35 a 0.90 a
High fat–low lignin oat 0.61 ab 0.31 a 0.96 a
SEM 4.27 5.84 3.09
P>F 0.04 0.68 0.49
Within each location, means in the same column followed by the same letter (a, b) do not differ (P>0.05).
3.3. Ileal and excreta phosphorus characterization
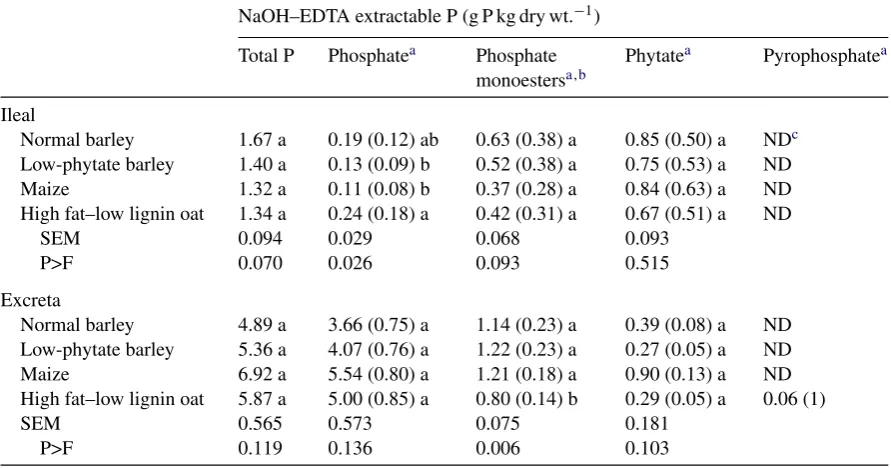
Total P in the ileal digesta ranged from 1.32 g P kg−1 for maize to 1.67 g P kg−1 for normal
bar-ley (P>0.05; Table 3). The P in the ileal digesta was dominated by phytate P which ranged from 0.67 g P kg−1for high fat–low lignin oat to 0.85 g P kg−1for normal barley and comprised between
0.50 and 0.63 of the total P in the digesta. There was also a substantial amount of phosphate monoester P (lower inositol phosphate esters), which ranged from 0.37 g P kg−1for maize to 0.63 g P kg−1 for
normal barley, comprising 0.28–0.38 of the total P in the digesta. The remaining P in the ileal digesta was present as phosphate P and ranged from 0.11 g P kg−1for maize to 0.24 g P kg−1for high fat–low lignin oat. The only significant difference in ileal P composition was for ileal phosphate P (P>0.03) where the high fat–low lignin oat treatment had the greatest concentration and the low-phytate barley and maize treatments had the lowest.
Total P in the excreta ranged from 4.89 g P kg−1 for normal barley to 6.92 g P kg−1 for maize
(Table 3). Phosphate was the dominant form of P found in the excreta ranging from 3.66 g P kg−1
for normal barley to 5.54 g P kg−1for maize and comprised 0.75–0.85 of the total excreta P. Excreta
phytate P concentrations ranged from 0.27 g P kg−1for low-phytate barley to 0.90 g P kg−1for maize
and comprised only 0.05–0.13 of total excreta P. Phosphate monoester P ranged from 0.80 g P kg−1
for high fat–low lignin oat to 1.22 g P kg−1for low-phytate barley and comprised 0.14–0.23 of total
excreta P. The only significant difference in excreta P composition was for phosphate monoester P (P>0.006) where the high fat–low lignin oat treatment was lower than the other treatments.
4. Discussion
A.B. Leytem et al. / Animal Feed Science and Technology 146 (2008) 160–168 165
Table 3
Phosphorus characterization of poultry ileal digesta and excreta determined by sodium hydroxide ethylenediamine tetraacetic acid (NaOH–EDTA) extraction and solution31P NMR spectroscopy
NaOH–EDTA extractable P (g P kg dry wt.−1) Total P Phosphatea Phosphate
monoestersa,b
Phytatea Pyrophosphatea
Ileal
Normal barley 1.67 a 0.19 (0.12) ab 0.63 (0.38) a 0.85 (0.50) a NDc Low-phytate barley 1.40 a 0.13 (0.09) b 0.52 (0.38) a 0.75 (0.53) a ND
Maize 1.32 a 0.11 (0.08) b 0.37 (0.28) a 0.84 (0.63) a ND
High fat–low lignin oat 1.34 a 0.24 (0.18) a 0.42 (0.31) a 0.67 (0.51) a ND
SEM 0.094 0.029 0.068 0.093
P>F 0.070 0.026 0.093 0.515
Excreta
Normal barley 4.89 a 3.66 (0.75) a 1.14 (0.23) a 0.39 (0.08) a ND Low-phytate barley 5.36 a 4.07 (0.76) a 1.22 (0.23) a 0.27 (0.05) a ND
Maize 6.92 a 5.54 (0.80) a 1.21 (0.18) a 0.90 (0.13) a ND
High fat–low lignin oat 5.87 a 5.00 (0.85) a 0.80 (0.14) b 0.29 (0.05) a 0.06 (1)
SEM 0.565 0.573 0.075 0.181
P>F 0.119 0.136 0.006 0.103
Within each location, means in the same column followed by the same letter (a–c) do not differ (P>0.05).
a Values in parenthesis are the proportion of the NaOH–EDTA extracted P. b Values for phosphate monoesters include all monoesters other than phytate. c ND = not detected.
that reported in the present study. The numerically higher P digestibility of the low-phytate
barley compared with normal barley agrees with previous work with low-phytate barley
variants in broilers (
Leytem et al., 2007
) and turkey poults (
Li et al., 2001
).
There is little published data reporting CIAD of cereal grains included in diets with
low P and Ca levels.
Dilger and Adeola (2006)
reported ileal P digestibility coefficients of
0.83–0.85 when broiler chicks were fed low-phytate or conventional soybean meal diets
without Ca additions, which was similar to the apparent ileal P digestibilities obtained for
all of the cereal grains evaluated in the present study.
Tamim and Angel (2003)
reported an
apparent P absorption of 0.65 when broilers were fed a maize–soybean meal diet. While
this is lower than the values obtained in the present study, the diets used by
Tamim and
Angel (2003)
contained higher levels of P from added dicalcium phosphate, which would
have reduced the apparent absorption of P at the distal ileum.
The grains used to prepare the diets fed in the present study had varying levels of intrinsic
phytase activity. In spite of this, there were few significant differences in phytate P CIAD
or CTTAD between treatments. This is particularly evident when comparing the phytate P
CIAD of maize and normal barley which were similar (0.89 vs. 0.81, respectively), in spite
of a sixfold difference in dietary phytase activity. As there was little difference in phytate
P CIAD, even though the intrinsic phytase activity of the grains were different, it appears
that the contribution of the endogenous phytase activity of the birds (including microflora
phytase activity) had a greater influence on phytate hydrolysis than the intrinsic phytase
activity of the grain. Our findings are supported by those of
Nelson (1976)
who fed birds
either maize or maize–wheat-based diets and found no significant differences in phytate P
hydrolysis, although
in vitro
tests had previously indicated a higher phytase activity in the
maize–wheat diet.
In the present study, the inclusion of Ca or P from inorganic sources such as limestone or
dicalcium phosphate was avoided in order to create a more sensitive model to detect
differ-ences in phytate P hydrolysis between grains with different endogenous phytase activities.
However, while there was no consistent correlation between intrinsic phytase activity of the
grains and phytate P hydrolysis, the high-phytate P CIAD (0.76–0.89) reflect the substantial
ability of broilers to hydrolyze phytate P in the absence of large quantities of added Ca and
P.
The effect of dietary concentrations of Ca and P on the extent of intestinal phytate P
hydrolysis has been previously reported.
Mohammed et al. (1991)
showed that phytate P
degradation in broilers up to 4 weeks of age was stimulated in maize–soybean meal diets
when the dietary Ca level was decreased.
Ballam et al. (1985)
demonstrated that high
inorganic P levels in broiler diets significantly decreased phytate P hydrolysis.
van der Klis
and Versteegh (1996)
demonstrated a decrease in phytate P hydrolysis of 26–48% in broilers
fed diets with higher available P (AvP) than comparable diets with lower AvP.
Although the P CIAD values were high (0.79–0.86), P CTTAD (i.e. overall retention)
values were much lower (0.25–0.35). This can be explained by the fact that much of the P
absorbed prior to the terminal ileum was not retained, presumably due to insufficient Ca
available for bone mineralization. Absorbed P that is not retained is excreted in the urine,
since poultry excrete urine and excreta together, this resulted in P CTTAD values that were
58–70% lower than the P CIAD values. This is consistent with previous observations by
A.B. Leytem et al. / Animal Feed Science and Technology 146 (2008) 160–168 167
contained appreciable amounts of inorganic Ca and P, it could be expected that differences
in the proportion of phytate P in the excreta were due to the detrimental effects of these
minerals on intestinal phytate P hydrolysis.
5. Conclusions
The current study demonstrates that phytate P content and the intrinsic phytase activity
of grains has very little influence on overall phytate P utilization in poultry when diets
do not contain large amounts of added P or Ca. The broilers were able to hydrolyze over
0.75 of the phytate P present in the cereal-based diets irrespective of the intrinsic phytase
activity of the feed. The phytate P hydrolyzed by the birds was presumably absorbed, as P
CIAD values were
≥
0.79. Phytate P degradation was almost complete in poultry excreta
with less than 0.13 P in the excreta being in the form of phytate P. Further research should
be conducted with diets more typical of those used in commercial poultry production to
confirm these findings, as the importance of differences in endogenous phytase activity
from cereal grains and its effect on overall availability of P from the diet may previously
have been overestimated.
Acknowledgements
The authors thank Dr. Alex Blumenfeld for analytical support. We would also like to
thank Dr. Brian Rossnagel for providing the low-phytate barley and the high fat–low lignin
oat.
References
Association of Official Analytical Chemists, 2005. Official Methods of Analysis, 18th ed., AOAC, Washington, DC (available online at AOAC.org).
Ballam, G.C., Nelson, T.S., Kirby, L.K., 1985. Effect of different dietary levels of calcium and phosphorus on phytate hydrolysis by chicks. Nutr. Rep. Int. 32, 909–913.
Celi, L., Barberis, E., 2005. Abiotic stabilization of organic phosphorus in the environment. In: Turner, B.L., Frossard, E., Baldwin, D.S. (Eds.), Organic Phosphorus in the Environment. CABI Publishing, Wallingford, Oxfordshire, UK, pp. 113–132.
Dilger, R.N., Adeola, O., 2006. Estimation of true phosphorus digestibility and endogenous phosphorus loss in growing chickens fed conventional and low-phytate soybean meals. Poult. Sci. 85, 661–668.
Engelen, A.J., van der Heeft, F.C., Randsdorp, H.G., Somers, W.A.C., 2001. Determination of phytase activity in feed by a colorimetric enzymatic method: collaborative inter—laboratory study. J. AOAC Int. 84, 629– 633.
Fenton, T.W., Fenton, M., 1979. An improved procedure for the determination of chromic oxide in feed and faeces. Can. J. Anim. Sci. 59, 631–634.
Leytem, A.B., Smith, D.R., Applegate, T.J., Thacker, P.A., 2006. The influence of manure phytic acid on phosphorus solubility in calcareous soils. Soil Sci. Soc. Am. J. 70, 1629–1638.
Leytem, A.B., Thacker, P.A., Turner, B.L., 2007. Phosphorus characterization in feces from broiler chicks fed low-phytate barley diets. J. Sci. Food Agric. 87, 1495–1501.
Maenz, D.D., Classen, H.L., 1998. Phytase activity in the small intestinal brush border membrane of the chicken. Poult. Sci. 77, 557–563.
Maguire, R.O., Sims, J.T., Saylor, W.W., Turner, B.L., Angel, R., Applegate, T.J., 2004. Influence of phytase addition to poultry diets on phosphorus forms and solubility in litters and amended soils. J. Environ. Qual. 33, 2306–2316.
Mohammed, A., Gibney, M.J., Taylor, T.G., 1991. The effects of dietary levels of inorganic phosphorus, calcium and cholecalciferol on the digestibility of phytate phosphorus by the chick. Br. J. Nutr. 66, 251–259.
National Research Council, 1994. Nutrient Requirements of Poultry, 9th revised ed. National Academy Press, Washington, DC, 155 pp.
Nelson, T.S., 1976. The hydrolysis of phytate phosphorus by chicks and laying hens. Poult. Sci. 55, 2262–2264. Statistical Analysis Software Institute, 2004. SAS/STAT User’s Guide. Release 9.1. SAS Institute Inc., Cary, NC. Tamim, N.M., Angel, R., 2003. Phytate phosphorus hydrolysis as influenced by dietary calcium and micro-mineral
source in broiler diets. J. Agric. Food Chem. 51, 4687–4693.
Tamim, N.M., Angel, R., Christman, M., 2004. Influence of dietary calcium and phytase on phytate phosphorus hydrolyses in broiler chickens. Poult. Sci. 83, 1358–1367.