R E S E A R C H
Open Access
The quality of reporting methods and
results of cost-effectiveness analyses in
Spain: a methodological systematic review
Ferrán Catalá-López
1,2,3*†, Manuel Ridao
4†, Adolfo Alonso-Arroyo
5, Anna García-Altés
1,6, Chris Cameron
3,7,
Diana González-Bermejo
8, Rafael Aleixandre-Benavent
9, Enrique Bernal-Delgado
4, Salvador Peiró
10,
Rafael Tabarés-Seisdedos
2and Brian Hutton
3,11Abstract
Background:Cost-effectiveness analysis has been recognized as an important tool to determine the efficiency of healthcare interventions and services. There is a need for evaluating the reporting of methods and results of cost-effectiveness analyses and establishing their validity. We describe and examine reporting characteristics of methods and results of cost-effectiveness analyses conducted in Spain during more than two decades.
Methods:A methodological systematic review was conducted with the information obtained through an updated literature review in PubMed and complementary databases (e.g. Scopus, ISI Web of Science, National Health Service Economic Evaluation Database (NHS EED) and Health Technology Assessment (HTA) databases from Centre for Reviews and Dissemination (CRD), Índice Médico Español (IME) Índice Bibliográfico Español en Ciencias de la Salud (IBECS)). We identified cost-effectiveness analyses conducted in Spain that used quality-adjusted life years (QALYs) as outcome measures (period 1989–December 2014). Two reviewers independently extracted the data from each paper. The data were analysed descriptively.
Results:In total, 223 studies were included. Very few studies (10; 4.5 %) reported working from a protocol. Most studies (200; 89.7 %) were simulation models and included a median of 1000 patients. Only 105 (47.1 %) studies presented an adequate description of the characteristics of the target population. Most study interventions were categorized as therapeutic (189; 84.8 %) and nearly half (111; 49.8 %) considered an active alternative as the
comparator. Effectiveness of data was derived from a single study in 87 (39.0 %) reports, and only few (40; 17.9 %) used evidence synthesis-based estimates. Few studies (42; 18.8 %) reported a full description of methods for QALY
calculation. The majority of the studies (147; 65.9 %) reported that the study intervention produced“more costs and more QALYs”than the comparator. Most studies (200; 89.7 %) reported favourable conclusions. Main funding source was the private for-profit sector (135; 60.5 %). Conflicts of interest were not disclosed in 88 (39.5 %) studies.
Conclusions:This methodological review reflects that reporting of several important aspects of methods and results are frequently missing in published cost-effectiveness analyses. Without full and transparent reporting of how studies were designed and conducted, it is difficult to assess the validity of study findings and conclusions.
Keywords:Cost-effectiveness analysis, Cost-utility analysis, Quality-adjusted life years, Methodology, Reporting, Spain
* Correspondence:[email protected] †Equal contributors
1Fundación Instituto de Investigación en Servicios de Salud, Valencia, Spain 2Department of Medicine, University of Valencia/INCLIVA Health Research
Institute and CIBERSAM, Valencia, Spain
Full list of author information is available at the end of the article
Background
Cost-effectiveness analysis has been recognized as an important tool to assist clinicians, scientists and pol-icymakers in determining the efficiency of healthcare interventions, guiding societal decision-making on the financing of healthcare services and establishing research priorities. Given that the information pro-vided by cost-effectiveness analysis has the potential to impact population health and health services, there is a need for evaluating the reporting of methods and results of cost-effectiveness analyses and establishing their validity to inform policy-making [1–4].
Diverse approaches to synthesize evidence have been considered in biomedical research [5–8], including eco-nomic evaluations of healthcare interventions [9–16]. At the same time, decision-making in health care requires an understanding of the state of economic evaluation at a national level, where the completeness of the reporting is generally less well understood but where specific pri-orities are often set. As a way of understanding the ma-turity and growth of the field, several smaller studies have examined a limited set of reporting characteristics of cost-effectiveness analyses published in Spain [17–20]. Spain was a pioneer in proposing the standardization and reporting of methodology applicable to cost-effectiveness analysis [21, 22]. However, the institutional and regulatory framework has so far not helped the ap-plication of the methodology to the public health deci-sions. The central government of Spain is the main decision-maker in pricing and reimbursement related to new medicines and healthcare technologies, although with a high decentralization of health jurisdictions in several regional health services, but traditionally, there have been no national requirements related to the cost-effectiveness for making coverage decisions.
We present herein a case study about reporting prac-tices of economic evaluations of healthcare interventions in one Western European country: Spain. Specifically, this study expands upon previous research [23, 24] to comprehensively describe and examine reporting charac-teristics of methods and results of cost-effectiveness ana-lyses conducted in Spain during more than two decades.
Methods
This methodological systematic review has been re-ported according to the Preferred Reporting Items for Systematic Reviews and Meta-Analyses (PRISMA) statement [25] (see Additional file 1: Table S3). A brief protocol was developed prior to the initiation of this review. It can be acquired by request from the corresponding authors. We did not register the proto-col with PROSPERO given that the register does not accept methodological reviews.
Literature search
The results from a previous review that examined col-laborative patterns of scientific production in a cohort of cost-effectiveness analyses conducted in Spain within the period 1989–2011 [23] were updated with the studies published until December 2014 and subsequently ana-lysed. A systematic search was performed in PubMed/ MEDLINE and other databases such as Scopus, ISI Web of Science, National Health Service Economic Evaluation Database (NHS EED) and Health Technology Assess-ment (HTA) databases of the Centre for Reviews and Dissemination (CRD) at the University of York, UK, as well as Índice Médico Español(IME) and Índice Biblio-gráfico Español en Ciencias de la Salud (IBECS). The search included a broad range of terms related to eco-nomic evaluations of healthcare interventions, cost-effectiveness analyses and the geographical area “Spain”. For the section of geographical area, the search was based on a previously validated filter by Valderas [26] to minimize bias regarding the indexing of geographical items. This filter is constructed around three comple-mentary approaches: (a) the term “Spain” and its vari-ants in various languages; (b) related mainly to region and province place names and (c) acronyms for regional health services. PubMed/MEDLINE and the above men-tioned complementary databases were searched from January 1, 2011 to December 31, 2014; the PubMed/ MEDLINE search strategy is provided in an online sup-plement to this review (see Additional file 1: Table S1). Furthermore, manual searches were made for publicly available reports from the Health Technology Agencies and publications in specialized Spanish journals.
Inclusion criteria and study selection
Our selection of studies was based on cost-effectiveness analyses of healthcare interventions that used quality-adjusted life years (QALYs) as outcome measure (see Table 1 for terminology). In the health economic
Table 1Terminology
Cost-effectiveness analysisis a specific form of economic evaluation comparing two or more alternative programmes by measuring costs and consequences. Consequences are measured in natural units (e.g. life years gained or cases averted).
Cost-utility analysisis a variant of cost-effectiveness analysis, where consequences are measured in terms of summary measures of population health such as quality-adjusted life years.
Cost-effectiveness acceptability curveis a graphical representation of the cost-effectiveness comparison between two interventions and plots the probability that one intervention is more cost-effective than other, as a function of the willingness-to-pay threshold for one additional unit of benefits.
Incremental cost-effectiveness ratio(ICER) is the ratio of the change in costs of an intervention (compared to the alternative) to the change in effects of the intervention.
literature, this type of studies is sometimes known as “cost-utility analyses”. We selected this type of cost-effectiveness analyses because many scientists and pol-icymakers have recommended the QALY framework as the standard reference for cost-effectiveness [27]. Studies had to be undertaken in the Spanish population. Review studies, editorials, and abstracts of congresses were ex-cluded. If an article was found repeated in several publi-cations, that published earlier (e.g. when there are two or more articles of the same study) and/or published in a journal with higher impact factor (e.g. when there ex-ists a study published in both health technology assess-ment report and journal manuscript) was included.
All citations of potential relevance identified from the literature search were screened by one reviewer. Two re-viewers reviewed all potentially relevant articles in full text. Final inclusion was confirmed if both reviewers felt the study was directly relevant to the objectives of this methodological review. Planned involvement of a third party to deal with unresolved discrepancies was not required.
Data collection
Two reviewers (with expertise in health economics and evidence synthesis) extracted data from each retrieved paper independently. Data were collected using a self-developed item data collection form designed to assess reporting details of the studies. The process of data ex-traction was piloted in 20 records. A final data extrac-tion form was then agreed. To enable descripextrac-tion of the characteristics and the quality of reporting of cost-effectiveness analyses in each report, we gathered the following information from all studies: year and journal of publication, impact factor (according to 2014 Journal Citation Report), country of first author, mention of a protocol, study objective, study design (e.g. randomized trial, observational study, simulation model), interven-tion targeted (e.g. preveninterven-tion, diagnosis/prognosis, treat-ment, rehabilitation), type of comparators (e.g. active alternative, do nothing or placebo, usual care), perspec-tive of analysis (in terms of which costs are considered, e.g. society, national healthcare system, hospital, others), type of costs (e.g. direct or indirect) and sources of in-formation, the main cause of disease to which the inter-vention or health programme was addressed, description of population characteristics, time horizon, sources of clinical effectiveness (e.g. based on a single study or based on systematic reviews and meta-analyses), full de-scription of methods for QALY calculation, discussion of assumptions and validation of models (if applicable), dis-count rates for costs and outcomes, results for the pri-mary outcome in the base case scenario (e.g. “more costs, more QALYs”, “less costs, more QALYs”, “less costs, comparable QALYs”), incremental analyses
including incremental cost-effectiveness ratios (ICERs), uncertainty measures (e.g. confidence intervals, accept-ability curves), sensitivity analyses, limitations of study, comparison of results with those of other studies, hypo-thetical willingness-to-pay threshold and study conclu-sions. Conclusions reported in the published article were defined as follows: favourable if the intervention was clearly claimed to be the preferred choice (e.g. cited as “cost-effective”,“reduced costs”,“produced cost savings”, “an affordable option”, “value for money”); unfavourable if the final comments were negative (e.g. the interven-tion is “unlikely to be cost-effective”, “produced higher costs”, “is economically unattractive” or “exceeded con-ventional thresholds of willingness to pay”); and neutral or uncertain when the intervention of interest did not surpass the comparator and/or when some uncertainty was expressed in the conclusions. Disclosures of funding source, conflicts of interest and authors’ contributions were also evaluated.
Statistical analysis
A descriptive analysis was performed using frequency and percentage counts. All calculations were performed using Stata (Version 13, StataCorp LP, College Station, TX, USA).
Results
Search
The flow diagram in Additional file 1: Figure S1 presents the process of study selection.
Eight out of 131 identified studies from the cohort of cost-effectiveness analysis conducted within the period 1989–2011 [23] were excluded for not meeting the de-fined criteria. Our updated search identified 2014 re-cords. Initial screening excluded 1914 rere-cords. The remaining 100 full-text articles were assessed for add-itional scrutiny, of which 21 where ineligible. Comple-mentary searches through other sources (e.g. publicly available reports from the Health Technology Agencies and publications in specialized Spanish journals) identi-fied 21 additional studies and were added to the previ-ously identified, obtaining a total sample of 223 studies (see Additional file 1: Table S2).
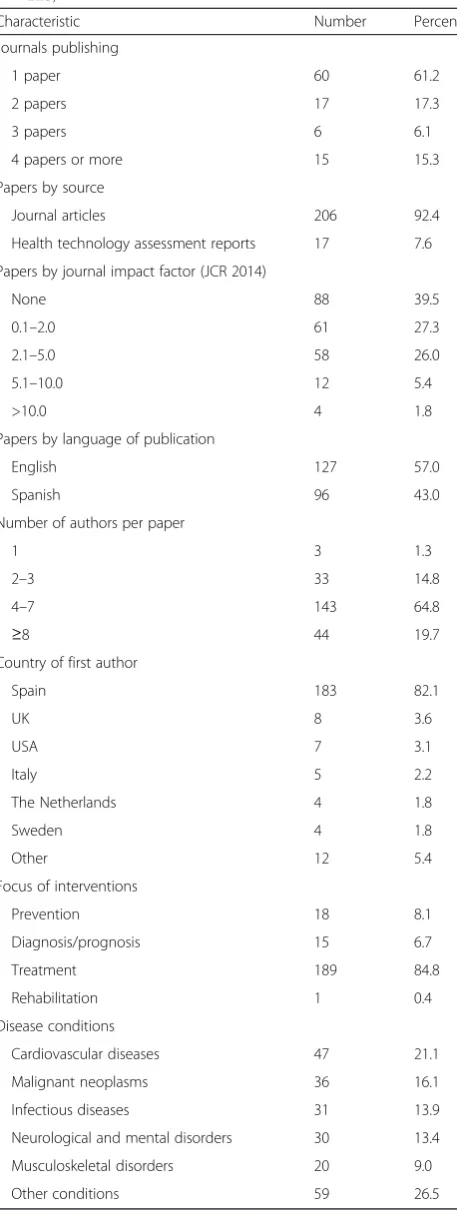
General characteristics
(Additional file 1: Figure S2), with nearly half of the cost-effectiveness analyses published during 2011–2014 (110; 49.3 %). More than half (127; 57.0 %) of the reports were written in English. The studies included a median of six authors although 44 (19.7 %) were authored by eight or more authors and only 3 (1.3 %) reports were single authored. The majority of the interventions were classified as treatments (189; 84.8 %)—of which more than 75 % (143/189) were pharmaceuticals. Cardiovascu-lar diseases (47; 21.1 %) and malignant neoplasms (36; 16.1 %) were the disease conditions most commonly studied.
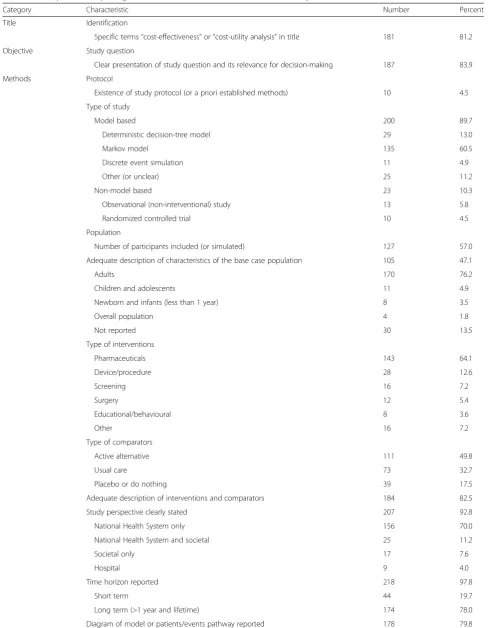
Reporting characteristics of methods and results
Table 3 provides a summary of the descriptive and reporting characteristics of the included studies. The majority of the study reports used the specific terms “cost-effectiveness” or “cost-utility analysis” in the title (181; 81.2 %) and presented clearly the study question (187; 83.9 %). However, only 10 studies (4.5 %) reported working from a protocol—of which 7 were randomized controlled trials, 2 were simulation models and 1 was an observational study.
Of the identified studies, 200 (89.7 %) were model-based being Markov models as the most frequently reported (135; 60.5 %). A minimal number of non-model-based studies were randomized controlled trials (10; 4.5 %).
Overall, most of the analyses were conducted in the adult population (170; 76.2 %) but only 105 (47.1 %) pre-sented an adequate description of the characteristics of the base case population or identified the indication clearly. The studies reporting the sample size (127; 57.0 %) included a median of 1000 patients (25th percentile = 301; 75th percentile = 10000), although this number varied considerably by the type of the study (e.g. clinical trials, median = 115 patients; observational studies, median = 200 patients; and simulation models, median = 1000 pa-tients). Most of the studies included an adequate descrip-tion of the intervendescrip-tions and comparators (184; 82.5 %). Nearly half (111; 49.8 %) of the studies considered an ac-tive alternaac-tive as the comparator (e.g. drug, device, pro-cedure, programme), 73 (32.7 %) used usual care and 39 (17.5 %) placebos or“do nothing”. The study perspective was clearly stated in most of the analyses (207; 92.8 %). The national healthcare system perspective was the most commonly used (156; 70.0 %).
The time horizon was clearly reported in the majority of studies (218; 97.8 %). Overall, 174 studies (78.0 %) used a time horizon greater than 1 year.
Most studies (178; 79.8 %) reported on the diagram of modelling or flow of patients (e.g. in the case of random-ized controlled trials and observational studies). Most studies (172; 77.1 %) reported on the assumptions adopted for the analyses. Regarding the simulation and Table 2Characteristics of included cost-effectiveness analyses
(n= 223)
Characteristic Number Percent
Journals publishing
1 paper 60 61.2
2 papers 17 17.3
3 papers 6 6.1
4 papers or more 15 15.3
Papers by source
Journal articles 206 92.4
Health technology assessment reports 17 7.6 Papers by journal impact factor (JCR 2014)
None 88 39.5
0.1–2.0 61 27.3
2.1–5.0 58 26.0
5.1–10.0 12 5.4
>10.0 4 1.8
Papers by language of publication
English 127 57.0
Spanish 96 43.0
Number of authors per paper
1 3 1.3
2–3 33 14.8
4–7 143 64.8
≥8 44 19.7
Country of first author
Spain 183 82.1
UK 8 3.6
USA 7 3.1
Italy 5 2.2
The Netherlands 4 1.8
Sweden 4 1.8
Other 12 5.4
Focus of interventions
Prevention 18 8.1
Diagnosis/prognosis 15 6.7
Treatment 189 84.8
Rehabilitation 1 0.4
Disease conditions
Cardiovascular diseases 47 21.1
Malignant neoplasms 36 16.1
Infectious diseases 31 13.9
Neurological and mental disorders 30 13.4 Musculoskeletal disorders 20 9.0
Other conditions 59 26.5
Table 3Descriptive and reporting characteristics of included cost-effectiveness analyses (n= 223)
Category Characteristic Number Percent
Title Identification
Specific terms“cost-effectiveness”or“cost-utility analysis”in title 181 81.2 Objective Study question
Clear presentation of study question and its relevance for decision-making 187 83.9
Methods Protocol
Existence of study protocol (or a priori established methods) 10 4.5 Type of study
Model based 200 89.7
Deterministic decision-tree model 29 13.0
Markov model 135 60.5
Discrete event simulation 11 4.9
Other (or unclear) 25 11.2
Non-model based 23 10.3
Observational (non-interventional) study 13 5.8
Randomized controlled trial 10 4.5
Population
Number of participants included (or simulated) 127 57.0
Adequate description of characteristics of the base case population 105 47.1
Adults 170 76.2
Children and adolescents 11 4.9
Newborn and infants (less than 1 year) 8 3.5
Overall population 4 1.8
Not reported 30 13.5
Type of interventions
Pharmaceuticals 143 64.1
Device/procedure 28 12.6
Screening 16 7.2
Surgery 12 5.4
Educational/behavioural 8 3.6
Other 16 7.2
Type of comparators
Active alternative 111 49.8
Usual care 73 32.7
Placebo or do nothing 39 17.5
Adequate description of interventions and comparators 184 82.5
Study perspective clearly stated 207 92.8
National Health System only 156 70.0
National Health System and societal 25 11.2
Societal only 17 7.6
Hospital 9 4.0
Time horizon reported 218 97.8
Short term 44 19.7
Long term (>1 year and lifetime) 174 78.0
Table 3Descriptive and reporting characteristics of included cost-effectiveness analyses (n= 223)(Continued)
Assumptions discussed 172 77.1
Model validation discussed (when applicable) 88 44.0
Reasons for the specific model used (when applicable) 91 45.5 Measurement of effectivenessa
Based on a single study 87 39.0
Based on evidence synthesis (e.g. systematic review and/or meta-analysis) 40 17.9
Full description of QALY calculation 42 18.8
Harms were considered 129 57.8
Cost and resources information
Source of valuation for all cost items reported 216 96.9
Quantity of resources 107 48.0
Year of monetary units 195 87.4
Costing
Direct costs only 182 81.6
Direct and indirect costs 41 18.4
Discount rate for costs and QALYs 161 72.2
Results Net costs reported 197 88.3
Net benefits reported 192 86.1
Incremental cost-effectiveness ratio (ICER) reported 207 92.8
Confidence intervals (e.g. 95 % CI) 27 12.1
Cost-effectiveness plane 99 44.4
Acceptability curves 92 41.3
Sensitivity analysis reported 201 90.1
For costs 170 76.2
For estimates of effectiveness 158 70.9
For utility weights 95 42.6
For discount rates 82 36.8
Type of sensitivity analysis
Deterministic univariate 85 38.1
Deterministic multivariate 6 2.7
Probabilistic 110 49.3
Results for the primary outcome in the base case scenario
More costs, more QALYs 147 65.9
Less costs, more QALYs 63 28.3
Less costs, comparable QALYs 5 2.2
More costs, comparable QALYs 4 1.8
Less costs, less QALYs 2 0.9
Comparable costs, more QALYs 2 0.9
Discussion Limitations of study discussed 197 88.3
Results compared with those of other economic evaluations 165 74.0 Hypothetical willingness-to-pay (WTP) threshold reported
<30,000€/QALY 4 1.8
30,000€/QALY 126 56.5
>30,000€/QALY–≤50,000€/QALY 36 16.1
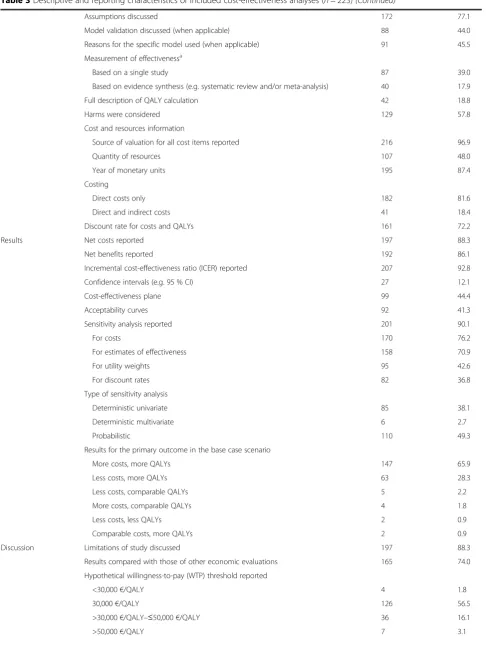
modelling-based studies, nearly half reported reasons for the specific model used (91/200; 45.5 %) and/or provided some information on the model validation (88/200; 44.0 %) such as previous publication in other settings.
Effectiveness of data was derived from a single study in 87 (39.0 %) analyses. Only 40 (17.9 %) used evidence synthesis-based estimates (e.g. systematic reviews and meta-analyses).
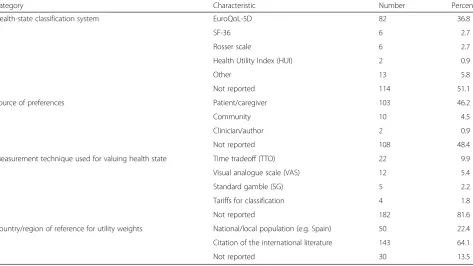
The methods that were reported for calculating QALYs are detailed in Table 4. Overall, a small number of the
studies (42; 18.8 %) reported a full description of methods for QALY calculation. About half of the studies (109; 48.9 %) reported information on the health-state classification system, of which the EuroQoL-5D was the instrument most commonly reported (82; 36.8 %). Half of the studies (115; 51.6 %) provided the source of the preferences. Most frequently, the patients and their care-givers (103; 46.2 %) were the source. Only a small num-ber of the studies (43; 19.3 %) provided information on the measurement technique used for valuing health Table 3Descriptive and reporting characteristics of included cost-effectiveness analyses (n= 223)(Continued)
Unclear or not reported 50 22.4
Study conclusions
Favourable 200 89.7
Unfavourable 12 5.4
Neutral/unclear 11 4.9
Other Disclosed funding sources 169 75.8
Private/for profit 135 60.5
Public 38 17.0
None/not reported 49 22.0
Mixed 1 0.4
Disclosed conflicts of interest 135 60.5
With conflicts of interest 94 42.1
With no conflicts of interest 41 18.4
Disclosed authors’contribution 46 20.6
a
Measurement of effectiveness only relates to effect estimates. The epidemiology of disease and/or transition probabilities were not necessarily based on a systematic review and meta-analysis
Table 4Descriptive and reporting characteristics of methods used in calculating QALYs
Category Characteristic Number Percent
Health-state classification system EuroQoL-5D 82 36.8
SF-36 6 2.7
Rosser scale 6 2.7
Health Utility Index (HUI) 2 0.9
Other 13 5.8
Not reported 114 51.1
Source of preferences Patient/caregiver 103 46.2
Community 10 4.5
Clinician/author 2 0.9
Not reported 108 48.4
Measurement technique used for valuing health state Time tradeoff (TTO) 22 9.9
Visual analogue scale (VAS) 12 5.4
Standard gamble (SG) 5 2.2
Tariffs for classification 4 1.8
Not reported 182 81.6
Country/region of reference for utility weights National/local population (e.g. Spain) 50 22.4 Citation of the international literature 143 64.1
states. The time tradeoff (22; 9.9 %) was the most com-monly used technique. The majority of the studies used the published international literature for data on utility weights (143; 64.1 %) and only 50 studies (22.4 %) re-ported country-specific utility weights for Spain.
Half of the studies (129; 57.8 %) reported on some as-pect of harms.
Ninety-seven percent (216) of the studies identified sources of valuation for costing items, and 87.4 % (195) in-dicated the year of currency. Overall, 107 (48.0 %) studies described quantity of resources. Eighteen percent (41) of studies included indirect costs. Seventy-two percent (161) of studies discounted both costs and QALYs. Of the stud-ies with a time horizon greater than 1 year (Table 5), the most commonly used was a 3 % discount rate.
In terms of results (Table 3), most of the studies (207; 92.8 %) reported ICERs (median = 16,908 €; 25th per-centile = 8,998 €; 75th percentile = 38,000 €). However, few studies (27; 12.1 %) described point estimates to-gether with an associated confidence interval. Nearly half of the studies (99; 44.4 %) reported the cost-effectiveness plane. Similarly, less than half of the studies (92; 41.3 %) reported a willingness-to-pay curve (“ cost-effectiveness acceptability curve”) to contrast the results of the analyses against an arbitrary efficiency threshold. Overall, 90.1 % (201) of studies reported sensitivity ana-lyses. About half of the studies (110; 49.3 %) conducted a probabilistic sensitivity analysis. The majority of the studies (147; 65.9 %) reported that the study intervention produced“more costs and more QALYs” than the alter-native comparator for the primary outcome of the base case scenario. Sixty-three (28.3 %) studies reported that the intervention was a dominant strategy, that means that the study intervention was “more effective and less costly”than the alternative.
Overall, the vast majority of the studies (197; 88.3 %) discussed limitations of the analyses. Most studies (165; 74.0 %) compared their results with those of previous
economic analyses. About half of the studies (126; 56.5 %) mentioned a hypothetical willingness-to-pay threshold of 30,000 €/QALY. The majority of studies (200; 89.7 %) reported favourable conclusions for the primary outcomes. Only a minority (12; 5.4 %) of pub-lished cost-effectiveness analyses reported unfavourable conclusions. About three fourths (169; 75.8 %) reported funding sources, being the private for-profit sector the main source (135; 60.5 %). Conflicts of interest were not disclosed in 88 (39.5 %) studies. Authors’contributions were only reported in 46 (20.6 %) studies (Table 3).
Discussion
In this methodological systematic review, we identified 223 reports of cost-effectiveness analyses conducted in Spain over the period 1989–2014. Overall, the studies covered a wide range of disease conditions but predom-inantly addressed questions about the efficiency of thera-peutic interventions. Our review, as well as other previously published reviews [11–14], showed that the quality of reporting of cost-effectiveness analyses varies widely and, in many cases, essential components of reporting methods and results were missing in published reports, such as the use of study protocols, the adequate description of patient characteristics, the measurement of clinical effectiveness using a systematic review process or the adequate description of QALY calculation.
Our study suggests the need for improvement in sev-eral aspects of published cost-effectiveness analyses. An important element in assessing research conduct and reporting is the study protocol. As showed in this re-view, only 4 % of studies reported working from a proto-col. Study protocols play an essential role in planning, conduct, interpretation, and external review of primary studies, but also in evidence synthesis of primary re-search. For example, the preparation and publication of a well-written protocol may reduce arbitrariness in decision-making when extracting and using data from primary research for populating health economic models. When clearly reported protocols are made avail-able, they enable readers to identify deviations from planned methods and whether they bias the interpret-ation of results and conclusions [28, 29]. Interninterpret-ational registries (such as ClinicalTrials.gov for clinical trials and PROSPERO for systematic reviews and meta-analysis) are now a reality. Similarly, in recent years, reporting guidelines for protocols have been endorsed and implemented (e.g. Standard Protocol Items: Recom-mendations for Interventional Trials (SPIRIT) for proto-cols of clinical trials [28] and PRISMA for protoproto-cols (PRISMA-P) of systematic reviews [29]). However, in view of our results, this revolution has not occurred yet in the field of cost-effectiveness research and, thus, could warrant further pragmatic action.
Table 5Discount rates used in included cost-effectiveness analyses
Costs QALYs
Discount rate (%) Number Percent Number Percent
1.5 – – 3 1.7
2 1 0.6 1 0.6
3 107 61.5 109 62.6
3.5 31 17.8 31 17.8
4 1 0.6 1 0.6
5 5 2.9 4 2.3
6 13 7.5 11 4.9
Totala 174 100.0 174 100.0
a
Many cost-effectiveness analyses (about 53 %) did not re-port detailed information on baseline clinical characteristics (e.g. eligibility and exclusion criteria of participants, the se-verity of disease, the stage in the natural history of the dis-ease, comorbidities). Inadequate reporting of the characteristics of the target population is a far greater bar-rier to the assessment of the study’s generalizability (applic-ability) and relevance to decision-making [30–32]. It is possible that this poor reporting reflects a major problem in secondary publications, such as many cost-effectiveness analyses using simulation models. Given that a clear under-standing of these elements is required to judge to whom the results of a study apply (as the Consolidated Standards of Reporting Trials (CONSORT) [31, 32] statement under-lines for randomized controlled trials), this information should also be provided in the report of cost-effectiveness analyses (e.g. in main text or in online supplement when allowed).
The vast majority (about 90 %) of published cost-effectiveness analyses used decision modelling as the main methodology. Decision modelling is considered a methodological approach of evidence synthesis that reaches beyond the scope of systematic reviews and meta-analyses. It is essential for cost-effectiveness re-search to use all relevant evidence on the effectiveness of interventions under evaluation. Rarely will all relevant evidence come from a single study, and typically, it will have to be drawn from several clinical studies [33]. A disappointing result of this review is that few published studies reported the use of a systematic review process for the measurement of clinical effectiveness. While sys-tematic reviews and meta-analyses are considered to be the gold standard in knowledge synthesis, only 18 % of published cost-effectiveness analyses used evidence synthesis-based estimates of effect. Instead, 43 % of the studies make arbitrary decisions about what studies to use to inform effectiveness data, whereas 39 % of the studies reported that the effectiveness data derived from a single study (generally, without a clear description of why the single study was a sufficient source of all rele-vant clinical evidence). The use of QALYs is recognized as the main valuation technique to measure health out-comes in cost-effectiveness analyses. However, in our re-view, it was also troubling that few studies (19 %) reported a full description of methods for QALY estima-tion, thus potentially impairing confidence in the results and conclusions. Future studies should be transparent in reporting these important aspects.
Strong evidence of publication bias and other potential sources of bias have been reported in biomedical re-search [34–38]. For example, randomized controlled tri-als with “positive” findings are published more often, and more quickly, than trials with “negative” findings [37]. Similarly, empirical studies have detected that most
published cost-effectiveness analyses report favourable findings [38]. In our review, very few published studies (about 10 %) reported unfavourable or neutral conclu-sions. Although it is somewhat premature to comment on this finding, this could be indicative of potential biases, such as publication bias or even potential screen-ing a priori that may have been performed by the pro-ducers of studies, which would make that cost-effectiveness analyses would have been only conducted in cases where a “positive” result was expected. In our opinion, this issue requires further investigation.
Several reporting guidelines are available and endorsed for many types of biomedical research [25, 28, 29, 31, 39] but also for cost-effectiveness analyses [40–46]. Such tools promote the consistent reporting of a minimal set of information for scientists and researchers reporting studies and the editors and peer reviewers assessing them for publication. Endorsement of reporting guide-lines by journals for randomized controlled trials [47] and systematic reviews [48] has been shown to improve the quality of reporting. The incorporation of reporting guidelines within the peer-review process could poten-tially contribute to improvements in the quality of re-ports of cost-effectiveness analyses. On this regard, the Consolidated Health Economic Evaluation Reporting Standards (CHEERS) statement [40] has been proposed as an attempt to consolidate and update previous efforts [41–46] into a single useful reporting guideline for cost-effectiveness research. Authors, peer reviewers and edi-tors can promote reporting guideline endorsement and implementation as an important way to improve trans-parency and completeness of what they published, redu-cing waste in reporting research and increasing value [49, 50] of cost-effectiveness research.
patterns. Third, we relied upon the expertise and experi-ence of our authorship team and on existing documents [16, 22] to identify core items related to the conduct and reporting that we would like to see (in the position of potential readers) in any published cost-effectiveness analysis. Given the dynamic nature of research, some op-portunities for future research and development could be the impact assessment of a specific reporting guide-line (such as the CHEERS statement [40]) and/or local recommendations on the reporting quality of published studies [51]. Fourth, the extent of the reporting of cost-effectiveness analyses was limited to the information publicly available in the corresponding report (and on-line data supplements when available). There were no further inquiries or attempts to verify the data sources and tools used in the studies and only information about reporting characteristics was taken into account in the review, without considering other possible sources (e.g. contacting authors and/or their sponsors).
Conclusions
We presented a national case study for more generalizable discussions about quality and transparency issues of reporting cost-effectiveness analyses, likely to be of interest to authors, peer reviewers and editors—but also research funders and regulators—both within and beyond Spain. Based on the existing evidence, several deficiencies in the reporting of important aspects of methods and results are apparent in published cost-effectiveness analyses.
Our study raises challenges for increasing value and reducing waste in cost-effectiveness research. Without full and transparent reporting of how studies were de-signed and conducted, it is difficult to assess validity of study findings and conclusions of published studies. This review also reinforces the need to improve mechanisms of peer review and publication process of cost-effectiveness research.
Additional file
Additional file 1:Reporting methods and results of CEA Spain_annex. Table S1.PubMed/MEDLINE search strategy.Table S2.Included studies. Table S3.PRISMA Checklist.Figure S1.Flow diagram for study selection. Figure S2.Growth in published cost-effectiveness analyses. Spain, 1989-2014.
Abbreviations
CHEERS:Consolidated Health Economic Evaluation Reporting Standards; CONSORT: Consolidated Standards of Reporting Trials; CRD: Centre for Reviews and Dissemination; HTA: Health Technology Assessment; HUI: Health Utility Index; IBECS: Índice Bibliográfico Español en Ciencias de la Salud; ICER: incremental cost-effectiveness ratio; IME: Índice Médico Español; JCR: Journal Citation Report; NHS EED: NHS Economic Evaluation Database; PRISMA: Preferred Reporting Items for Systematic Reviews and Meta-Analyses; PRISMA-P: Preferred Reporting Items for Systematic Reviews and Meta-Analyses extension for Protocols; QALYs: quality-adjusted life years; SF-36: 36-Item Short Form Health Survey; SG: standard gamble; SPIRIT: Standard
Protocol Items: Recommendations for Interventional Trials; TTO: time tradeoff; VAS: visual analogue scale.
Competing interests
The authors declare that they have no competing interests.
Authors’contributions
The study was conceived by FC-L and MR and developed with critical input from AA-A, AG-A, CC, DG-B, RA-B, EB-D, SP, RT-S and BH. FC-L coordinated the study, conducted the literature search, screened citations and full-text ar-ticles, abstracted the data, analysed the data, generated the tables and fig-ures, interpreted the results and wrote the manuscript. MR designed the study, screened citations and full-text articles, abstracted the data, analysed the data, interpreted the results and wrote the manuscript. AA-A and RA-B helped with the literature search, screened the citations, interpreted the results and commented on the manuscript for important intellectual content. AG-A, CC, DG-B, EB-D, SP, RT-S and BH interpreted the results and wrote and edited the final manuscript. FC-L and MR accept full responsibility for the finished article, had access to all of the data, and controlled the decision to publish. All authors read and approved the final manuscript.
Acknowledgements
This study received no specific funding. FC-L and RT-S are partially funded by Generalitat Valenciana (PROMETEOII/2015/021), INCLIVA and Institute of Health Carlos III/CIBERSAM. MR, EB-D and SP are partially funded by the Spanish Health Services Research on Chronic Patients Network (REDISSEC). BH is supported by a New Investigator Award from the Canadian Institutes of Health Research and the Drug Safety and Effectiveness Network. The authors are pleased to acknowledge Dr. Oliver Rivero-Arias (University of Oxford, Oxford, UK), who provided valuable feedback and advice throughout the study. We would like to acknowledge the editor, Dr. Ian Shemilt, and the peer reviewers, Dr. Andrew Booth and Dr Raúl Palacio-Rodríguez, for their helpful comments on our submitted manuscript.
Author details
1Fundación Instituto de Investigación en Servicios de Salud, Valencia, Spain. 2Department of Medicine, University of Valencia/INCLIVA Health Research
Institute and CIBERSAM, Valencia, Spain.3Clinical Epidemiology Program,
Ottawa Hospital Research Institute (OHRI), Ottawa, ON, Canada.4Instituto
Aragonés de Ciencias de la Salud (I + CS), Red de Investigación en Servicios de Salud en Enfermedades Crónicas (REDISSEC), Zaragoza, Spain.
5Department of History of Science and Documentation, University of
Valencia, Valencia, Spain.6CIBERESP, Institut d’Investigació Biomèdica (IIB)
Sant Pau, Barcelona, Spain.7Evidence Synthesis Group, Cornerstone Research
Group, Burlington, ON, Canada.8Division of Pharmacoepidemiology and
Pharmacovigilance, Spanish Medicines and Healthcare Products Agency (AEMPS), Madrid, Spain.9Ingenio-Spanish National Research Council (CSIC)
and UISYS-University of Valencia, Valencia, Spain.10FISABIO-Salud Pública,
Red de Investigación en Servicios de Salud en Enfermedades Crónicas (REDISSEC), Valencia, Spain.11School of Epidemiology, Public Health and
Preventive Medicine, Faculty of Medicine, University of Ottawa, Ottawa, ON, Canada.
Received: 18 September 2015 Accepted: 22 December 2015
References
1. Mason J, Drummond M. Reporting guidelines for economic studies. Health Econ. 1995;4:85–94.
2. Drummond MF. A reappraisal of economic evaluation of pharmaceuticals. Science or marketing? Pharmacoeconomics. 1998;14:1–9.
3. Rennie D, Luft HS. Pharmacoeconomic analyses: making them transparent, making them credible. JAMA. 2000;283:2158–60.
4. Rennie D, Luft HS. Problems in pharmacoeconomic analyses. JAMA. 2000; 284:1922–4.
5. Chan AW, Altman DG. Epidemiology and reporting of randomised trials published in PubMed journals. Lancet. 2005;365:1159–62.
7. Moher D, Tetzlaff J, Tricco AC, Sampson M, Altman DG. Epidemiology and reporting characteristics of systematic reviews. PLoS Med. 2007;4, e78. 8. Hutton B, Salanti G, Chaimani A, Caldwell DM, Schmid C, Thorlund K, et al.
The quality of reporting methods and results in network meta-analyses: an overview of reviews and suggestions for improvement. PLoS One. 2014;9: e92508.
9. Elixhauser A, Luce BR, Taylor WR, Reblando J. Health care CBA/CEA: an update on the growth and composition of the literature. Med Care. 1993;31: JS1–JS11. JS18-149.
10. Elixhauser A, Halpern M, Schmier J, Luce BR. Health care CBA and CEA from 1991 to 1996: an updated bibliography. Med Care. 1998;36:MS1–9. MS18-147. 11. Neumann PJ, Stone PW, Chapman RH, Sandberg EA, Bell CM. The quality of
reporting in published cost-utility analyses, 1976–1997. Ann Intern Med. 2000;132:964–72.
12. Neumann PJ, Greenberg D, Olchanski NV, Stone PW, Rosen AB. Growth and quality of the cost-utility literature, 1976–2001. Value Health. 2005;8:3–9. 13. Rosen AB, Greenberg D, Stone PW, Olchanski NV, Neumann PJ. Quality of
abstracts of papers reporting original cost-effectiveness analyses. Med Decis Making. 2005;25:424–8.
14. Neumann PJ, Fang CH, Cohen JT. 30 years of pharmaceutical cost-utility analyses: growth, diversity and methodological improvement. Pharmacoeconomics. 2009;27:861–72.
15. Jefferson T, Demicheli V, Vale L. Quality of systematic reviews of economic evaluations in health care. JAMA. 2002;287:2809–12.
16. Hutter MF, Rodríguez-Ibeas R, Antonanzas F. Methodological reviews of economic evaluations in health care: what do they target? Eur J Health Econ. 2014;15:829–40.
17. García-Altés A. Twenty years of health care economic analysis in Spain: are we doing well? Health Econ. 2001;10:715–29.
18. Oliva J, Del Llano J, Sacristán JA. Analysis of economic evaluations of health technologies performed in Spain between 1990 and 2000. Gac Sanit. 2002; 16 Suppl 2:2–11.
19. Rodriguez JM, Paz S, Lizan L, Gonzalez P. The use of quality-adjusted life-years in the economic evaluation of health technologies in Spain: a review of the 1990–2009 literature. Value Health. 2011;14:458–64.
20. Rodríguez Barrios JM, Pérez Alcántara F, Crespo Palomo C, González García P, Antón De Las Heras E, Brosa Riestra M. The use of cost per life year gained as a measurement of cost-effectiveness in Spain: a systematic review of recent publications. Eur J Health Econ. 2012;13:723–40.
21. Rovira J, Antoñanzas F. Economic analysis of health technologies and programmes. A Spanish proposal for methodological standardisation. Pharmacoeconomics. 1995;8:245–52.
22. López-Bastida J, Oliva J, Antoñanzas F, García-Altés A, Gisbert R, Mar J, et al. Spanish recommendations on economic evaluation of health technologies. Eur J Health Econ. 2010;11:513–20.
23. Catalá-López F, Alonso-Arroyo A, Aleixandre-Benavent R, Ridao M, Bolaños M, García-Altés A, et al. Coauthorship and institutional collaborations on cost-effectiveness analyses: a systematic network analysis. PLoS One. 2012;7:e38012. 24. Catalá-López F, García-Altés A. Economic evaluation of healthcare
interventions during more than 25 years in Spain (1983–2008). Rev Esp Salud Publica. 2010;84:353–69.
25. Moher D, Liberati A, Tetzlaff J, Altman DG. PRISMA group preferred reporting items for systematic reviews and meta-analyses: the PRISMA statement. Ann Intern Med. 2009;151:264–9. W64.
26. Valderas JM, Mendivil J, Parada A, Losada-Yáñez M, Alonso J. Development of a geographic filter for PubMed to identify studies performed in Spain. Rev Esp Cardiol. 2006;59:1244–51.
27. Gold MR, Siegel JE, Russell LB, Weinstein MC. Cost-effectiveness in health and medicine. Oxford: Oxford University Press; 1996.
28. Chan AW, Tetzlaff JM, Altman DG, Laupacis A, Gøtzsche PC, Krleža-JerićK, et al. SPIRIT 2013 statement: defining standard protocol items for clinical trials. Ann Intern Med. 2013;158:200–7.
29. Moher D, Shamseer L, Clarke M, Ghersi D, Liberati A, Petticrew M, et al. PRISMA-P group. Preferred reporting items for systematic review and meta-analysis protocols (PRISMA-P) 2015 statement. Syst Rev. 2015;4:1. 30. Rothwell PM. External validity of randomised controlled trials:“to whom do
the results of this trial apply?”. Lancet. 2005;365:82–93.
31. Schulz KF, Altman DG, Moher D, CONSORT Group. CONSORT 2010 statement: updated guidelines for reporting parallel group randomized trials. Ann Intern Med. 2010;152:726–32.
32. Moher D, Hopewell S, Schulz KF, Montori V, Gøtzsche PC, Devereaux PJ, et al. CONSORT 2010 explanation and elaboration: updated guidelines for reporting parallel group randomised trials. BMJ. 2010;340:c869. 33. Briggs A, Sculpher M, Claxton K. Decision modeling for health economics
evaluation. Oxford: Oxford University Press; 2006.
34. Dwan K, Altman DG, Clarke M, Gamble C, Higgins JP, Sterne JA, et al. Evidence for the selective reporting of analyses and discrepancies in clinical trials: a systematic review of cohort studies of clinical trials. PLoS Med. 2014; 11:e1001666.
35. Saini P, Loke YK, Gamble C, Altman DG, Williamson PR, Kirkham JJ. Selective reporting bias of harm outcomes within studies: findings from a cohort of systematic reviews. BMJ. 2014;349:g6501.
36. Kirkham JJ, Dwan KM, Altman DG, Gamble C, Dodd S, Smyth R, et al. The impact of outcome reporting bias in randomised controlled trials on a cohort of systematic reviews. BMJ. 2010;340:c365.
37. Hopewell S, Loudon K, Clarke MJ, Oxman AD, Dickersin K. Publication bias in clinical trials due to statistical significance or direction of trial results. Cochrane Database Syst Rev. 2009;1:MR000006.
38. Bell CM, Urbach DR, Ray JG, Bayoumi A, Rosen AB, Greenberg D, et al. Bias in published cost effectiveness studies: systematic review. BMJ. 2006;332: 699–703.
39. von Elm E, Altman DG, Egger M, Pocock SJ, Gøtzsche PC, Vandenbroucke JP, et al. The Strengthening the Reporting of Observational Studies in Epidemiology (STROBE) statement: guidelines for reporting observational studies. PLoS Med. 2007;4:e296.
40. Husereau D, Drummond M, Petrou S, Carswell C, Moher D, Greenberg D, et al. CHEERS Task Force. Consolidated health economic evaluation reporting standards (CHEERS) statement. BMC Med. 2013;11:80.
41. Guidelines for the economic evaluation of health technologies: Canada [3rd Edition]. Ottawa: Canadian Agency for Drugs and Technologies in Health; 2006. Available at: http://www.cadth.ca/media/pdf/186_
EconomicGuidelines_e.pdf
42. Ramsey S, Willke R, Briggs A, Brown R, Buxton M, Chawla A, et al. Good research practices for cost-effectiveness analysis alongside clinical trials: the ISPOR RCT-CEA Task Force report. Value Health. 2005;8:521–33.
43. Weinstein MC, O’Brien B, Hornberger J, Jackson J, Johannesson M, McCabe C, et al. Principles of good practice for decision analytic modeling in health-care evaluation: report of the ISPOR Task Force on Good Research Practices—Modeling Studies. Value Health. 2003;6:9–17.
44. Drummond MF, Jefferson TO. Guidelines for authors and peer reviewers of economic submissions to the BMJ. The BMJ Economic Evaluation Working Party. BMJ. 1996;313:275–83.
45. Siegel JE, Weinstein MC, Russell LB, Gold MR. Recommendations for reporting cost-effectiveness analyses. Panel on cost-effectiveness in health and medicine. JAMA. 1996;276:1339–41.
46. Task Force on Principles for Economic Analysis of Health Care Technology. Economic analysis of health care technology. A report on principles. Ann Intern Med. 1995;123:61–70.
47. Turner L, Shamseer L, Altman DG, Schulz KF, Moher D. Does use of the CONSORT Statement impact the completeness of reporting of randomised controlled trials published in medical journals? A Cochrane review. Syst Rev. 2012;1:60. 48. Panic N, Leoncini E, de Belvis G, Ricciardi W, Boccia S. Evaluation of the
endorsement of the preferred reporting items for systematic reviews and meta-analysis (PRISMA) statement on the quality of published systematic review and meta-analyses. PLoS One. 2013;8:e83138.
49. Chalmers I, Glasziou P. Avoidable waste in the production and reporting of research evidence. Lancet. 2009;374:86–9.
50. Ioannidis JP, Greenland S, Hlatky MA, Khoury MJ, Macleod MR, Moher D, et al. Increasing value and reducing waste in research design, conduct, and analysis. Lancet. 2014;383:166–75.