Dr. Mamatha Veeramachaneni
Department of Pharmaceutical Analysis & Quality Assurance, JNTU Kakinada University,
Vikas College of Pharmacy, Andhra Pradesh, India E-mail: [email protected] Address for correspondence
Access this article online www.japer.in
Development and validation of new ICP-OES Analytical Technique
to quantify the contents of Copper, Magnesium & Zinc in
“Escitalopram Oxalate”
1. INTRODUCTION
Lexapro® (escitalopram oxalate) is an orally administered selective serotonin reuptake inhibitor (SSRI). Escitalopram is the pure Senantiomer (single isomer) of the racemic bicyclic phthalane derivative citalopram. Escitalopram oxalate is designated S-(+)-1-[3-(dimethyl-amino)
propyl]-1-(p-fluorophenyl)-5-phthalancarbonitrile oxalate with the following structural formula:
The molecular formula is C20H21FN2O • C2H2O4 and the molecular weight is 414.40.Escitalopram oxalate drug contains certain inorganic impurities which may be included during the manufacturing process. These inorganic impurities are toxic in nature beyond their limit and may lead to unwanted effects. Hence their
presence is to be tested and must be limited to stated amount.
The general analytical techniques employed for the inorganic metal impurities include titration, ion exchange chromatography, capillary electrophoresis and inductively coupled plasma (ICP). Among the above – said techniques, ICP is a versatile tool for
detection and quantification of elements in accurate manner. The ICP technique is based on atomic spectrometry. Most specifically, the ICP – OES is emission spectrometric technique that exploits the fact that excited atoms emit energy at a given wavelength as the electrons return to their ground state. A given element emits energy at specific wavelengths peculiar to its chemical character. The intensity of the energy emitted at that wavelength is proportional to the amount of that element in the analyzed sample.
ICP – OES has additional advantages over the other techniques in terms of detection limits as well as speed of analysis. In ICP – OES sample experiences temperatures estimated to be in the vicinity of 10,000 K. these results in atomization and excitation of even most refractory elements with high efficiency so that detection limits for these elements with ICP – OES can be well over and order of magnitude better than the An accurate, precise , reproducible and eco friendly Inductively Coupled Plasma Optical Emission Spectroscopic (ICP – OES) method was developed and validated for the estimation of Copper, Magnesium and Zinc in Escitalopram Oxalate drug. The method is selective and is capable of detecting copper, magnesium and zinc in the presence of other elements. The method has been validated using RF power of 1150 watts, plasma flow of 15L/min, and Nebuliser flow of 0.6 L/min and plasma view at axial mode for all the elements. The wavelength was monitored for copper; magnesium and zinc are at 324.754 nm, 285.213 nm and 213.856 nm respectively. The method has been validated in terms of specificity, precision, linearity, accuracy, limit of quantification. The objective of the study is to provide an alternate economical method to estimate the contents of elements in escitalopram oxalate.
Keywords: ICH, Quantification, escitalopram oxalate, Validation.
ABSTRACT ABSTRACT ABSTRACT ABSTRACT
Mamatha Veeramachaneni*, Kumar Raja Jayavarapu
Department of Pharmaceutical Analysis & Quality Assurance, JNTU Kakinada University, Vikas College of pharmacy , Andhra Pradesh, India.
corresponding values of other techniques. The limit of quantification values of most of the elements in ICP – OES is parts per million and even parts per billion. In number of analytical applications speed can be an important factor. Those advocating simultaneous ICP – OES regard it is the only method worth considering for this task because it analyses so much of sample in minutes. In other techniques like ion exchange chromatography, capillary electrophoresis stabilization is a time taking process and sensitivities are low when compared with ICP – OES. The titration methods are not accurate especially while estimating the elements at lower concentrations and also errors could be expected.
Literature reveals that very few methods were reported for the determination of elements in crude drugs and their formulations. However a detailed procedure for determining the elements in drugs is not find in open literature. This paper describes the methodology and validation procedure by Inductively Coupled Plasma Optical Emission Spectroscopy. The method was validated according to the ICH (Q2A 1995) guidelines.
2. EXPERIMENTAL
2.1Chemicals
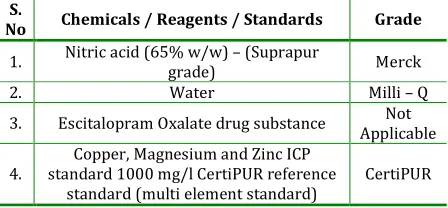
Table 1: Reagents and chemicals
S.
No Chemicals / Reagents / Standards Grade
1. Nitric acid (65% w/w) – (Suprapur
grade) Merck
2. Water Milli – Q
3. Escitalopram Oxalate drug substance Not Applicable
4.
Copper, Magnesium and Zinc ICP standard 1000 mg/l CertiPUR reference
standard (multi element standard)
CertiPUR
2.2 Equipment
A Thermo Fisher Scientific Inductively coupled Plasma system equipped with Optical Emission Spectrophotometer and system controlled through iTEVA software.
2.3 Diluent
5ml of Conc. Nitric acid was transferred into a 1000ml volumetric flask and made up to volume with water to get a dilution of 0.5 % nitric acid.
2.4 Sample Preparation
A solution of escitalopram oxalate was prepared by accurately weighing about 0.25g of sample and transferring it into a clean and dry 50 ml volumetric flask. To this 35 ml of diluent was added and sonicate to dissolve. The final volume was made with diluent. 2.5 Standards Preparation
Initially standard stock solution was prepared by transferring 1.0 ml of copper, magnesium and zinc standard solution (1000 mg/L) into a 10ml clean, dry volumetric flask and making up the volume with diluent. Further working standards were prepared by following dilutions;
Table 2: Standards Solutions
Standard Stock Solution
Amount of std. stock solution
added
Standard concentration
100 ppm
0.8 ml from std. – 4
solution 0.01 ppm
0.125 ml 0.125 ppm
0.625 ml 0.625 ppm
1.25 ml 1.25 ppm
1.875 ml 1.875 ppm
2.6 Method Development
elements. The possible inferences were not observed at this emission lines.
The method was optimized at these wavelengths during method development. To get better sensitivity view mode was selected as Axial. In axial, plasma views down the central channel of the plasma and collects all the analyte emission over the entire length of the remaining plasma after the shear gas. This region is much larger than that viewed by normal radial or normal side on ICP resulting higher intensity for elements.
2.7 ICP – OES Conditions
The RF power used was 1150 watts, plasma flow was 15 L/min, Auxiliary gas flow was kept at 0.5 L/min, Nebulizer Flow was kept at 0.6 L/min, and Pump Rate was kept at 50 rmp. Copper, Magnesium and zinc were monitored at wavelengths 324.752 nm, 285.213 nm
and 213.856 nm respectively. Plasma view was in axial mode.
2.8 Validation of the Method
2.8.1 Specificity
The International Conference on Harmonization defines specificity as the ability to assess unequivocally the analyte in the presence of components that may be expected to be present, such as impurities, degradation products.
The test samples (control samples) in triplicate and test samples spiked with multi elements including copper, magnesium and zinc standard (spiked sample) in triplicate were aspirated as per test method and individual metal contents were determined.
An acceptance criterion for specificity as per USP is 10%.
Table 3: Specificity of Elements
ELEMENT ELEMENT CONTENT IN
CONTROLLED SAMPLE (ppm)
SPIKED AMOUNT (ppm)
RECOVERED AMOUNT (ppm)
LIMIT OF % DIFFERENCE
% DIFFERENCE
Copper 0.03 247.75 255.25 NMT 10 3.01
Magnesium 0.69 248.0 246.29 NMT 10 0.97
Zinc 0.76 248.0 249.56 NMT 10 0.32
2.8.2 Linearity
The linearity of an analytical method is its ability to elicit test results that are directly, or by a well defined mathematical transformation, proportional to the concentration of analyte in samples within a given range.
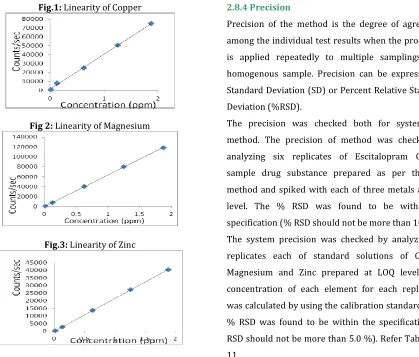
Linearity was evaluated by preparing a linear series of standard solutions of Copper, Magnesium and Zinc in the concentrations range from LOQ level to 150% level of specification level. From the linear solutions, Correlation co – efficient, Y – Intercept, slope and residual sum of squares (STEYX) were calculated and thus the linear relationship of concentration Vs counts/S was verified over the range specified.
The correlation coefficient for copper, magnesium and zinc were found to be 1.000, 0.9999 and 0.9999 respectively which indicates good linearity. Refer fig. 1, 2, 3
Table 4: Linearity of Copper
S. No Statistical Analysis Observation
1. Slope 40242
2. Y – Intercept 26
3. STEYX 301
4. Correlation Co – efficient 1.0000
Table 5: Linearity of Magnesium
S. No Statistical Analysis Observation
1. Slope 63334
2. Y – Intercept 166
3. STEYX 642
4. Correlation Co – efficient 0.9999
Table 6: Linearity of Zinc
S. No Statistical Analysis Observation
1. Slope 21545
2. Y – Intercept 88
3. STEYX 211
2.8.3 Accuracy
Accuracy is the measure of exactness of an analytical method, or the closeness of agreement between the measured value and the value of an accepted reference value.
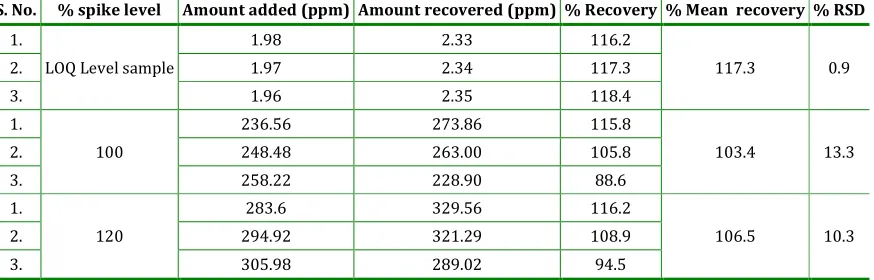
Sample solutions were spiked with copper, magnesium and zinc at LOQ level, 100% level and 120% level with respect to working concentration. Each spiked solution was prepared in triplicate and
aspirated. The recovery of copper, magnesium and zinc was calculated against the standard working concentration. The recovery of copper, magnesium and zinc ranged from 86.8 – 117.3 % (Acceptance criteria: 80.0 – 120.0 %). Refer Table 7, 8, 9 for accuracy values.
Table 7: Accuracy of Copper
S. No. % spike level Amount added (ppm) Amount recovered (ppm) % Recovery % Mean recovery% RSD
1.
LOQ Level sample
1.98 2.33 116.2
117.3 0.9
2. 1.97 2.34 117.3
3. 1.96 2.35 118.4
1.
100
236.56 273.86 115.8
103.4 13.3
2. 248.48 263.00 105.8
3. 258.22 228.90 88.6
1.
120
283.6 329.56 116.2
106.5 10.3
2. 294.92 321.29 108.9
3. 305.98 289.02 94.5
Table 8: Accuracy of Magnesium
S. No. % spike level Amount added (ppm) Amount recovered (ppm) % Recovery % Mean recovery % RSD
1.
LOQ Level sample
1.98 2.39 85.9
86.8 3.0
2. 1.97 2.36 84.8
3. 1.96 2.45 89.8
1.
100
236.80 244.90 103.1
99.2 8.7
2. 248.72 262.40 105.2
3. 258.48 231.58 89.3
1.
120
283.89 297.04 104.4
102.3 6.9
2. 295.22 319.91 108.1
3. 306.90 289.47 94.3
Table 9: Accuracy of Zinc
S. No. % spike level Amount added (ppm) Amount recovered (ppm) % Recovery % Mean recovery % RSD
1.
LOQ Level sample
1.98 2.89 107.6
110.8 4.0
2. 1.97 2.91 109.1
3. 1.96 3.03 115.8
1.
100
236.80 254.74 107.3
100.6 10.2
2. 248.72 263.60 105.7
3. 258.48 230.34 88.8
1.
120
283.89 307.63 108.1
103.5 7.9
2. 295.22 320.70 108.4
Fig.1: Linearity of Copper
Fig 2: Linearity of Magnesium
Fig.3: Linearity of Zinc
2.8.4 Precision
Precision of the method is the degree of agreement among the individual test results when the procedure is applied repeatedly to multiple samplings of a homogenous sample. Precision can be expressed by Standard Deviation (SD) or Percent Relative Standard Deviation (%RSD).
The precision was checked both for system and method. The precision of method was checked by analyzing six replicates of Escitalopram Oxalate sample drug substance prepared as per the test method and spiked with each of three metals at LOQ level. The % RSD was found to be within the specification (% RSD should not be more than 10%). The system precision was checked by analyzing six replicates each of standard solutions of Copper, Magnesium and Zinc prepared at LOQ levels. The concentration of each element for each replication was calculated by using the calibration standards. The % RSD was found to be within the specification (% RSD should not be more than 5.0 %). Refer Tables 10, 11.
Table 10: System Precision Values
Sample Repetitions Results
1 2 3 4 5 6
Copper (ppm)
Average of 3 reading 0.0096 0.0098 0.0100 0.0098 0.0099 0.0098
Mean 0.0098
SD 0.0001
%RSD 1.0
Magnesium (ppm)
Average of 3 reading 0.0103 0.0105 0.0105 0.0105 0.0107 0.0105
Mean 0.0105
SD 0.0001
%RSD 1.0
Zinc(ppm)
Average of 3 reading 0.0100 0.0101 0.0102 0.0102 0.0103 0.0103
Mean 0.0102
SD 0.0001
%RSD 1.0
Table 11: Method Precision Values
Sample Repetitions Results
1 2 3 4 5 6
Copper (ppm) 2.33 2.34 2.35 2.28 2.20 2.20
Mean 2.28
SD 0.07
%RSD 3.1
Magnesium (ppm) 2.39 2.36 2.45 2.42 2.38 2.41
Mean 2.40
SD 0.03
%RSD 1.3
Zinc(ppm) 2.89 2.91 3.03 2.90 3.02 2.98
Mean 2.96
SD 0.06
2.8.5 LOD & LOQ
Limit of detection is defined as the lowest concentration of an analyte in a sample that can be detected, though not necessarily quantitated. It is a limit test that specifies whether or not an analyte is above or below a certain value.
Limit of Quantification is defined as the lowest concentration of an analyte in a sample that can be determined with acceptable precision and accuracy under the stated operational conditions of the method. LOQ is directly proportional to the precision.
Linear series of Copper, Magnesium and Zinc standard solutions were prepared in the concentration range from 0.003 ppm to 1.875 ppm. From the linear solutions, slope and residual sum of squares (STEYX) were calculated, and thus the limit of detection and quantification were calculated and the predicted LOD and LOQ levels were verified for the required precision. (Acceptance Criteria:- % RSD is not more than 33.0 for LOD and 10.0 for LOQ)
Refer Tables 12, 13 & 14 for LOQ & LOD values
Table 12: LOQ & LOD of Copper
S. No LOD LOQ 1. 0.0023 0.0102 2. 0.0025 0.0102 3. 0.0025 0.0101 4. 0.0026 0.0102 5. 0.0026 0.0102 6. 0.0026 0.0104 Mean 0.0025 0.0102 SD 0.0001 0.0001 % RSD 4.0 1.0
Table 13: LOD & LOQ of Magnesium
S. No LOD LOQ
1. 0.0028 0.0097
2. 0.0028 0.0096
3. 0.0028 0.0098
4. 0.0027 0.0096
5. 0.0030 0.0097
6. 0.0028 0.0097
Mean 0.0028 0.0097
SD 0.0001 0.0001
% RSD 3.6 1.0
Table 14: LOD & LOQ of Zinc
S. No LOD LOQ
1. 0.0027 0.0099
2. 0.0027 0.0098
3. 0.0027 0.0099
4. 0.0027 0.0099
5. 0.0027 0.0100
6. 0.0027 0.0100
Mean 0.0027 0.0099
SD 0.0000 0.0001
% RSD 0.0 1.0
2.8.6 Ruggedness
The ruggedness of a method was defined as degree of reproducibility of results obtained by analysis of the same sample under variety of normal test conditions such as different labs, different analysts, different instruments and different lots of reagents.
The recovery levels tested tested in Section 2.8.3 (laboratory A) were again carried out in laboratory B using different instrument. The recovery values were found to be comparable.
3. CONCLUSION
estimate elements not only in Escitalopram Oxalate but also in other drug substances.
4. ACKNOWLEDGEMENTS
I take this privilege and pleasure to acknowledge the contributions of many individuals who have inspirational and supportive throughout my work. I specially thank the Head of the Pharmaceutical Analysis Department and my guide for their moral support and encouragement during the work and to the Aurobindo Pharmaceuticals, Hyderabad, for providing the necessary facilities to carry out this research work.
5. REFERENCE
1. B.K Sharma, instrumental methods of chemical
analysis, introduction to analytical chemistry, edition
19th , goel publishing house, Meerut, PP – 1 – 4.
2. Venkata Vivkanand Vallapragada et al; A Validated
Inductively Coupled Plasma – Optical Emission
Spectrometry (ICP - OES) Method to Estimate
Calcium and Phosphorous in In -Vitro Phosphate
Binding Study of Eliphos Tablets. American Journal
of Analytical Chemistry,2011,2,718 – 725.
3. Nobrega A. Joaquim et al; Evaluation of inductively
coupled plasma optical emission spectrometers with
axially and radially viewed configurations. Elsevier
Science B.V., Spectrochimia Acta Part B 57 (2002)
4. Perkin Elmer’s ‘Guide to inorganic analysis in AA, ICP
– OES and ICP – MS’.
5. ICH Q3AR Guideline “ Impurity Testing Guideline &
Impurities in New Drug Substances” Qualification of
Impurities in Drug Substances and Drug Products
Karl A. Traul, K.A.Traul Pharmaceutical Consulting
USP
6. Mark E. Tatro ‘Optical Emission Inductively Coupled
Plasma in Environmental Analysis’. Encyclopedia of
Analytical Chemistry
7. Application of ICP – OES as a Multi – Element
Detector for Sulfur and Metal Hydride Impurities in
Hydrocarbon Matrices.
8. Transient acid effects in inductively coupled plasma
optical emission spectroscopy.
9. Determination of metals in wine by ICP-OES by
Maurizio Aceto, Ornella Abollino, Maria Concetta et
all
10. Determination of Trace Elements in Yak Meat by
microwave digestion method by Zhang Yu – Yu, Tang
Shan – Hu, Hu zi - wen
11. Study on multi – element determination in drinking
water by ICP – OES by Shenzen Research Center,
Chinese Academy of Preventive Medicine, China.
12. Determination of trace elements in liquid aspartame
sweeteners by ICP-OES following acid digestion by
de Sousa, Rafael. Anderason S, Vilera. Mariana A,
Curtlus. Adilson J, Nivaldo. Cadore, Solange
13. A Comparison of Reliability of Soil Cadmium,
Determination by ICP-OES by M. B. McBride
14. Determination of Metals in Lubricating Oil by
ICP-OES by Tran T. Nham, Roman M.Bombolka
15. Determination of Arsenic in soil by ICP-OES by
Alexander Edward Sibriri Whaley, University of
Pretoria
16. A comparative study of acid – extractable and total
digestion methods for the determination of inorganic
elements in peat material by ICP – OES by Charun
Yafa, John G. Farmer, University of Edinburgh, UK.
17. Determination of Nutrition labeling Education Act
Minerals in Foods by ICP – OES by Karen W. Barenes
and Ebenezer Debrah, The Perkin – Elmer
Corporation, Norwalk, USA
18. Beone G.M. et al; Determination of heavy metals in
soils and sediments by microwave – assisted
digestion and ICP – OES analysis. Elsevier Science
B.V. ,Spectrochimia Acta 424 (2000) IP – 2010, 2007
19. Martinez L.D et al; Trace element determination of
Argentine wines using ETAAS and USN – ICP – OES
Elsevier Science B.V. ,Spectrochimia Acta (2005)293
– 297
20. Buscher Wolfgang et al; trace element determination
using static high – sensitivity inductively coupled
plasma optical emission spectrometry (SHIP - OES).
Elsevier Science B.V. ,Spectrochimia Acta583 (2007)
319 – 325
21. Douglas A. Skoog, Donald M. West and James Holler
F., Fundamentals of Analytical Chemistry, 7th edition,
1-3, 628-641.
22. Beckett, A.H and Stenlake J.B., Practical
Pharmaceutical Chemistry, CBS Publishers and
23. Jeffery, G.H and Basselt J., Vogel’s Text Book of
Quantitative pharmaceutical Chemistry, 5th Edition,
1991, 21-23
24. Gurdeep R Chatwal, Sham K and Anand.,
Instrumental methods of Chemical Analysis., 5th
edition, Himalaya publishing House, New Delhi,
561-567
25. Willard H.H, Merritt L.L, Dean J.A and Settle F.A.,
Instrumental methods of Analysis., 7th edition, CBS
Publishers & Distributors, New Delhi, 1986, 169-180
26. Sethi P.D., Quantitative analysis of Drugs in
Pharmaceutical Formulations., 3rd edition, 1997,
5-57.
27. Validation of Analytical procedures: Methodology,
ICH Harmonised tripartite Guideline, 1996, 1-8,
[online] available at www.ich.org
28. Ronald Denny, Roy Sinclair., Visible and Ultra Violet
Spectroscopy., John Wiley & sons publishers,
Singapore, 3rd Edition, 2001, 116-123
29. Alfonso genera in Remington’s Pharmaceutical
series, 18th edition, Mack publishing company, 1990,
648.
How to cite this article: Mamatha Veeramachaneni*, Kumar
Raja Jayavarapu; Development and validation of new ICP-OES Analytical Technique to quantify the contents of Copper, Magnesium & Zinc in “Escitalopram Oxalate”; J. Adv. Pharm. Edu. & Res. 2013: 3(4): 516-523.