Two Faces of the Framework
for Analysis and Prediction,
Part 2 - Research
ITC 3/47
Journal of Information Technology and Control
Vol. 47 / No. 3 / 2018 pp. 489-502
DOI 10.5755/j01.itc.47.3.18747 © Kaunas University of Technology
Two Faces of the Framework for Analysis and Prediction, Part 2 - Research
Received 2017/08/02 Accepted after revision 2018/06/26
http://dx.doi.org/10.5755/j01.itc.47.3.18747
Corresponding author: [email protected]
Vladimir Kurbalija, Mirjana Ivanović
Department of Mathematics and Informatics, Faculty of Sciences, University of Novi Sad, Trg D. Obradovića 4, 21000 Novi Sad, Serbia, {kurba, mira}@dmi.uns.ac.rs
Zoltan Geler
Department of Media Studies, Faculty of Philosophy, University of Novi Sad, Dr Zorana Đinđića 2, 21000 Novi Sad, Serbia, [email protected]
Miloš Radovanović
Department of Mathematics and Informatics, Faculty of Sciences, University of Novi Sad, Trg D. Obradovića 4, 21000 Novi Sad, Serbia, [email protected]
Continuing Two Faces of the Framework for Analysis and Prediction, Part 1 - Education, this article overviews the successful applications of the Framework for Analysis and Prediction (FAP) – a Java-based tool dedicated to time-series analysis – in research, highlighting the influence applications had on subsequent development and enhancements of the FAP software. Research applications include applications in data mining (develop-ment of a new time-series representation and various interactions between time-series distance measures and classification) and multidisciplinary research (in psychology, medicine, emotion recognition, and agent-based distributed computing).
KEYWORDS: data mining, time-series analysis, tools for time-series processing, application of time-series in research.
1. Introduction
In Two Faces of the Framework for Analysis and
pre-Information Technology and Control 2018/3/47 490
senting its architecture and supported features for time-series preprocessing, distance/similarity com-putation, classification and representation, after which we extensively discussed applications of FAP in the domain of education. The present article will round off the discussion by overviewing other relat-ed systems that motivatrelat-ed the development of FAP in Section 2, as well as applications of FAP in research (Section 3). General conclusions will be given in Sec-tion 4.
2. Software Packages for
Time-Series Analysis and Mining
Many modern research and practice scenarios are faced with large quantities of data in the form of time series [8, 43]. Therefore, numerous techniques and procedures are constantly developed and implement-ed for time-series processing, as well as exploring and explaining the phenomena from which they originate. In Two Faces of the Framework for Analysis and Pre-diction, Part 1 - Education [32], we described the ba-sic concepts related to time series and appropriate distance measures. The current section will comple-ment this introduction by presenting several soft-ware packages that can be utilized for some tasks of time-series analysis and mining, also discussing the motivation for creating FAP.
Discovery of useful knowledge from data relies on methods for statistical analysis and data mining. However, in contrast to the classical statistics, data mining is a rather new scientific discipline aimed at processing complex and massive data. In this section, we will give an overview of the best known (most-ly free and open source) software packages that are in some way related to time-series data mining and analysis. A more detailed review of the available general-purpose machine-learning and data-mining tools can be found in [6, 38].
One of the most popular free and open source soft-ware packages for machine learning and data mining is probably Weka (Waikato Environment for Knowl-edge Analysis – www.cs.waikato.ac.nz/ml/ weka/) [23], which is being developed and maintained at the University of Waikato in New Zealand since the beginning of the 1990s. It is written in Java and
dis-tributed under the terms of the GNU General Public License. The initial Weka workbench was developed with the aim to allow researchers easy access to state-of-the-art techniques in machine learning [23]. Weka provides a uniform interface to a wide range of differ-ent machine learning and data mining algorithms, in-cluding data pre- and postprocessing, classification, clustering, regression, association rules, and visual-ization. It also supports large-scale statistical experi-ments employing distributed computing [53]. Besides three interactive graphical environments (Explorer, Experimenter and Knowledge Flow) that provide ac-cess to its basic functionality, all of its features can be accessed directly through a command-line interface (Simple CLI). Furthermore, it can be incorporated into Java applications as a library. A detailed descrip-tion of Weka’s capabilities and various possibilities of its usage can be found in [53]. Although Weka is a general-purpose data-mining library, and it is not specialized for time-series data mining, it has a ded-icated time-series analysis environment (in the form of a plugin) that allows forecasting models to be de-veloped, evaluated, and visualized [40].
(commercial licenses exist for companies requiring technical support). Incorporating solutions from sev-eral other open source packages (e.g. machine-learn-ing and data-minmachine-learn-ing algorithms from Weka [23] and statistical routines from R [45]) KNIME, represents a powerful tools integration platform [3] and supports several topics, including: univariate and multivariate statistics, data mining, text mining, image processing, and time-series analysis.
RapidMiner Studio (https://rapidminer.com) is an open source predictive analytics platform developed in Java by the RapidMiner company, whose first ver-sion was implemented under the name YALE (Yet Another Learning Environment) at the Technical University of Dortmund in Germany [39]. It provides an easy-to-use sophisticated graphical user interface for interactive design and execution of the various steps of the data-mining process (loading, preparing, analyzing, and visualizing) by connecting the cor-responding operators (represented as boxes) which have configurable parameters [11]. RapidMiner Stu-dio’s functionality can be enhanced by installing ex-tensions using the RapidMiner Marketplace. These plugins include operators for text mining, web min-ing, and time-series analysis, too. The Basic and Com-munity Edition versions of the RapidMiner Studio are available free of charge.
In addition to software packages based on machine learning methods, there is a considerable number of systems that support time-series analysis relying on statistical and econometric modeling. The most famous representative of this group of applications is most likely the SAS (Statistical Analysis System – http://www.sas.com) software suite developed by the SAS Institute [27]. Among the diverse components (more than 200) that are part of the SAS software, the SAS/EST and the SAS Enterprise Miner support work with time series, too. SAS/EST provides tech-niques for econometric analysis, forecasting, time-se-ries decomposing, transformation, seasonal adjust-ment, outlier detection, and similarity analysis. SAS Enterprise Miner offers statistical, data-mining, and machine-learning algorithms including several tasks of time-series data mining and analysis: data prepa-ration, similarity analysis, clustering, exponential smoothing, dimensionality reduction, and seasonal decomposition. The freely available SAS Universi-ty Edition incorporates SAS Studio, Base SAS, SAS/
STAT, SAS/IML, SAS/ACCESS, and several time-se-ries forecasting procedures from SAS/ETS.
MATLAB (MATrix LABoratory – http://www. math-works.com/) is another well-known commercial soft-ware package for interactive numerical computation, and a high-level programming language developed by MathWorks [18]. It supports data analysis, pro-cessing and visualization, modeling and simulation, algorithm development, and application deployment. Several MATLAB functions assist in working with time-series data and additional toolboxes can be pur-chased that support different aspects of time-series analysis including: System Identification Toolbox, Econometric Toolbox, Neural Network Toolbox, Fi-nancial Toolbox, and Signal Processing Toolbox. Other examples of commercial products that support statistical and econometric models of time series in-clude: IBM SPSS Statistics (http://www-01.ibm.com/ software/analytics/spss/), STATA (http://www.stata. com), RATS (https://estima.com/ratsmain .shtml), and Mathematica (http://www.wolfram.com/ math-ematica/).
The best-known free and open source software envi-ronment for statistical computing, data analysis, and graphics is probably R (https://www.r-project.org) [45]. R is a system for statistical computation avail-able on multiple platforms (UNIX, Windows, and macOS) and a programming language based on two languages: S and Scheme. It consists of two parts: the base system and a collection of add-on packages [24] – they are distributed through the Comprehensive R Ar-chive Network (CARN – https://cran.r-project.org). R supports statistical modeling, statistical tests, classi-fication, clustering, regression, time-series analysis, and others. Several packages implement functions for working with time series, including forecasting, uni-variate and multiuni-variate modeling, regression, sea-sonality, decomposition, and filtering.
GRETL (GNU Regression, Econometrics and Time-se-ries Library – http://gretl.sourceforge.net/) is an open source, platform-independent library for economet-ric analysis [2]. It supports several least-square based statistical estimators, time-series models, and several maximum-likelihood methods. GRETL also encloses a graphical user interface for the X-12-ARIMA envi-ronment.
Information Technology and Control 2018/3/47 492
supports several interesting concepts such as: alter-native seasonal, trading-day and holiday effect ad-justment; an alternative seasonal-trend-irregular decomposition; extensive time-series modeling and model-selection capabilities for linear regression models with ARIMA errors. The currently main-tained version of this program, called X-13ARIMA- SEATS (https://www.census.gov/srd/www/x13as/), was created by incorporating X-12-ARIMA and TRA-MO/SEATS [44]. TRAMO (Time Series Regression with ARIMA Noise, Missing Observations and Out-liers) is a program for estimation and forecasting of regression models with possibly nonstationary (ARIMA) errors and any sequence of missing values; SEATS (Signal Extraction in ARIMA Time Series) is a program for estimation of unobserved components in time series based on ARIMA model [20]. Both of these programs are provided by the national central bank of Spain (Banco de España – http://www.bde.es).
Evidently, we can distinguish two types of software packages for time-series analysis and mining:
1 general-purpose machine-learning and data-min-ing platforms which to some extent support pro-cessing time series, and
2 statistical software systems that provide the means for statistical analysis and modeling of real world situations based on time series.
Furthermore, all existing systems have at least one of the following three shortcomings:
1 they are not free and/or open-sourced, 2 their main focus is not on time series,
3 they do not support all the functionality of FAP. Since the statistical methods are not sufficient for the realization of different time-series data mining tasks [47], it has become important to design new solutions in this field and to enhance the existing ones. This has led to publication of a significant number of competi-tive techniques.
Motivated by the lack of a free and open source frame-work which could fully support different aspects of time-series mining (including distance measures, preprocessing, classification, and representations) and help researchers in testing and comparing the alternatives, we have implemented our FAP ( Frame-work for Analysis and Prediction) system.
Our system can cover all main features and
function-alities needed for time-series analysis (pre-process-ing tasks, distance measures, time-series representa-tions) and necessary for different data-mining tasks (indexing, classification, prediction, etc).
In the past ten years, our research group has been continuously developing and employing different al-gorithms and aspects necessary for time-series data mining and analysis. Therefore, we realized that it would be valuable to systematize all these concepts in form of an open-source framework. Such a frame-work could be useful to other research groups as well, not only in the computer science field [25, 29, 30, 34, 37], but in all other areas where real phenomena are based on and could be modeled by time series.
Furthermore, we realized that we can utilize it in ed-ucation as well, for some specialized artificial intelli-gence and data mining subjects and seminars [32].
3. Applications of FAP in Research
This section will present several successful applica-tions of FAP in research, illustrating the usefulness and comprehensiveness of the FAP system, as well as its ability to be applied in diverse domains. The applications influenced subsequent development of FAP on the basis of the obtained results and feedback, encouraging new directions for further development, upgrade, and improvement.From the very beginning of its development, FAP has had a dual role in research. Firstly, extending it with new elements, features, and functionalities facilitat-ed the investigation and comparison of an increasing number of diverse approaches in the field of time-se-ries data mining. Secondly, these expansions yielded the possibility of its application as a research tool in other domains, too.
3.1 FAP in Time-Series Data Mining
Application 1. Spline representation. The most fundamental classes of FAP were implemented with-in the CuBaGe (Curve Based Generator) system [31]. The aim of this work was to create a decision support system based on Case-Based Reasoning (CBR) [5] technology, but where the cases are represented as time series.
of a qualitative similarity/distance measure with an appropriate representation technique for time series. In CuBaGe, as the first implementation of time-se-ries concepts in our group, a representation based on cubic splines was chosen for this purpose. For such a representation, the distance measure based on defini-tive integrals was the natural choice [28].
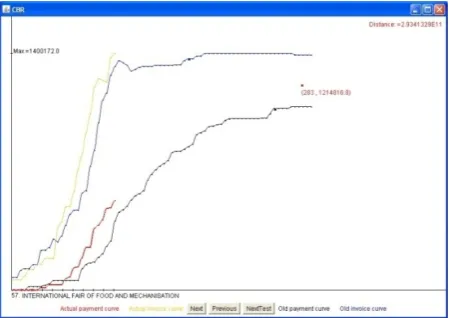
This system has been applied successfully in predict-ing the rhythm of issupredict-ing invoices and receivpredict-ing actual payments at the company “Novi Sad Fair” [50, 51]. The management of “Novi Sad Fair” wanted to know how high (and at what moment) would be the payment of some services over a future time, with respect to its invoicing. The calculation of the saturation point for the payment time series (the point where the value of payment will not change by more than 10%) is based on similarity between existing and previous invoicing and payment time series. An example of a saturation point can be seen on Fig. 1. A detailed evaluation of the proposed methodology using 10-fold-cross-valida-tion showed that the system predicts satura10-fold-cross-valida-tion point with 14.12% error rate in time and 5.88% in value di-mension. This is completely understandable from the operational manager’s point of view, because time of saturation depends on many other economical and po-litical factors. Furthermore, the value of payment has a greater importance than the time of actual payment. The need for a dedicated time-series library has ini-tially appeared during the process of implementing the CuBaGe system. In this early stage of develop-ment, the most fundamental classes (closely related
Figure 1
Actual payment and invoice time series, some similar time series from database and saturation point
representation, the distance measure based on definitive integrals was the natural choice [28]. This system has been applied successfully in predicting the rhythm of issuing invoices and receiving actual payments at the company “Novi Sad Fair” [50, 51]. The management of “Novi Sad Fair” wanted to know how high (and at what moment) would be the payment of some services over a future time, with respect to its invoicing. The calculation of the saturation point for the payment time series (the point where the value of payment will not change by more than 10%) is based on similarity between existing and previous invoicing and payment time series. An example of a saturation point can be seen on Fig. 1. A detailed evaluation of the proposed methodology using 10-fold-cross-validation showed that the system predicts saturation point with 14.12% error rate in time and 5.88% in value dimension. This is completely understandable from the operational manager’s point of view, because time of saturation depends on many other economical and political factors. Furthermore, the value of payment has a greater importance than the time of actual payment.
Figure 1 Actual payment and invoice time series, some similar time series from database and saturation point
The need for a dedicated time-series library has initially appeared during the process of implementing the CuBaGe system. In this early stage of development, the most fundamental classes (closely related to data points and time series) and interfaces (related to similarity measures and time-series representations) were outlined. They constitute the central part of the core package of FAP. Furthermore, the Spline distance measure and representation were also introduced [31].
Application 2. The influence of global constraints on 1NN. One of the research areas of time-series data mining for which there is a growing interest is classification [19, 21, 49, 52, 54]. The simple nearest-neighbor (1NN) rule [12] has proven to be one of the most accurate classifiers in the domain of time series [46, 54]. To provide a deeper insight into the influence of the Sakoe-Chiba band [15] on the classification accuracy, in [35] and [36], we have investigated its imprint on the nearest-neighbor graph. The 1NN graph
is a directed graph where each time series is connected with its nearest neighbor. As the 1NN classifier assigns the class of the nearest neighbor to the unlabeled time series, the changes in the 1NN graph directly affect classification accuracy. A comprehensive set of experiments was conducted on 46 datasets from the UCR Time Series Repository [10] with the most widely used elastic similarity measures: DTW, LCS, ERP, and EDR.
In the first phase of the experiments, we have investigated the percentage of the NN graph's nodes that changed their nearest neighbors under the influence of the Sakoe-Chiba band with different warping window widths. Fig. 2a (from [36]) illustrates the results obtained with DTW for several representative datasets. As the warping window becomes smaller, there are more and more nodes with changed nearest neighbors. In the second phase, we have examined to what extent the nodes of the 1NN graph change their classes when applying the Sakoe-Chiba band. These changes are not as intense as in the previous phase, but it can be clearly seen that with smaller warping windows the difference between the constrained and unconstrained measures becomes more significant (Fig. 2b).
Through these extensive investigations, we have showed that the constrained measures are qualitatively different than the unconstrained ones. For low values of the constraint (less than 15%–10%), the change of the 1NN graph becomes significant for all of the considered distance measures. Comparing the accuracy of the 1NN classifier, we have found that DTW has a slight advantage over the others, but it is more sensitive to the choice of the warping window's width.
To meet the needs of these experiments, the initial version of FAP, outlined as a basic auxiliary tool for the CuBaGe system, has been expanded with the unconstrained, and the constrained versions of the main elastic time-series distance/similarity measures: DTW, LCS, ERP and EDR. The constrained measures were implemented relying on the Sakoe-Chiba band [15]. In addition, basic classes and interfaces for classifiers have been introduced alongside the implementation of the 1NN classifier.
Application 3. The influence of global constraints on kNN. In [16], as a continuation of the above studies, we have extended our research on the majority voting k-nearest neighbor (kNN) classifier [14]. In this experimental setup, we have looked for the minimal value of the warping window that maximizes the classification accuracy and recorded the obtained error rates for different values of the parameter k.
Based on the results shown in Fig. 3 (taken from [16]), we can see that, as k grows, we need wider and wider warping windows to get the best accuracy (Fig. 3b), and that the relationship between the parameter k and the average smallest error rate is almost linear – the growth of parameter k leads to the decline of classification accuracy (Fig. 3a). These experiments to data points and time series) and interfaces (related to similarity measures and time-series representa-tions) were outlined. They constitute the central part of the core package of FAP. Furthermore, the Spline distance measure and representation were also intro-duced [31].
Application 2.The influence of global constraints on 1NN. One of the research areas of time-series data mining for which there is a growing interest is classi-fication [19, 21, 49, 52, 54]. The simple nearest-neigh-bor (1NN) rule [12] has proven to be one of the most accurate classifiers in the domain of time series [46, 54]. To provide a deeper insight into the influence of the Sakoe-Chiba band [15] on the classification ac-curacy, in [35] and [36], we have investigated its im-print on the nearest-neighbor graph. The 1NN graph is a directed graph where each time series is con-nected with its nearest neighbor. As the 1NN classi-fier assigns the class of the nearest neighbor to the unlabeled time series, the changes in the 1NN graph directly affect classification accuracy. A comprehen-sive set of experiments was conducted on 46 datasets from the UCR Time Series Repository [10] with the most widely used elastic similarity measures: DTW, LCS, ERP, and EDR.
In the first phase of the experiments, we have inves-tigated the percentage of the NN graph’s nodes that changed their nearest neighbors under the influence of the Sakoe-Chiba band with different warping win-dow widths. Fig. 2a (from [36]) illustrates the re-sults obtained with DTW for several representative datasets. As the warping window becomes smaller, there are more and more nodes with changed nearest neighbors. In the second phase, we have examined to what extent the nodes of the 1NN graph change their classes when applying the Sakoe-Chiba band. These changes are not as intense as in the previous phase, but it can be clearly seen that with smaller warping windows the difference between the constrained and unconstrained measures becomes more significant (Fig. 2b).
Information Technology and Control 2018/3/47 494
has a slight advantage over the others, but it is more sensitive to the choice of the warping window’s width. To meet the needs of these experiments, the initial version of FAP, outlined as a basic auxiliary tool for the CuBaGe system, has been expanded with the un-constrained, and the constrained versions of the main elastic time-series distance/similarity measures: DTW, LCS, ERP and EDR. The constrained measures were implemented relying on the Sakoe-Chiba band [15]. In addition, basic classes and interfaces for clas-sifiers have been introduced alongside the implemen-tation of the 1NN classifier.
Application 3. The influence of global constraints on kNN. In [16], as a continuation of the above stud-ies, we have extended our research on the majority voting k-nearest neighbor (kNN) classifier [14]. In this experimental setup, we have looked for the mini-mal value of the warping window that maximizes the classification accuracy and recorded the obtained er-ror rates for different values of the parameter k. Based on the results shown in Fig. 3 (taken from [16]), we can see that, as k grows, we need wider and wider warping windows to get the best accuracy (Fig. 3b), and that the relationship between the parameter k Figure 2
Change of 1NN graph for DTW: (a) the percentage of changed nodes; (b) the percentage of nodes with changed classes
Figure 3
The impact of the Sakoe-Chiba band on the kNN classifier in case of DTW: (a) average lowest error rates; (b) average smallest warping window widths
have confirmed the special importance of the first neighbor in time-series data: without applying a weighting scheme, the kNN classifier gives the best results when the value of k is 1.
In this step, the main elements of the upgrade of the FAP library included the implementation of the
majority-voting kNN classifier, and the preliminary versions of the basic methods for evaluating the performance of classifiers (holdout, k-fold (stratified) cross-validation and leave-one-out).
(a) (b)
Figure 2 Change of 1NN graph for DTW: (a) the percentage of changed nodes; (b) the percentage of nodes with changed classes
(a) (b)
Figure 3 The impact of the Sakoe-Chiba band on the kNN classifier in case of DTW: (a) average lowest error rates; (b) average smallest warping window widths
Application 4. Comparison of weighting schemes. One of the possible disadvantages of the kNN classifier can be the equality of the nearest neighbors disregarding their distance from the unlabeled time series. We can try to correct this potential drawback by assigning the neighbor's weights proportional to their distances: closer time series will have greater weights. A great number of different weighting schemes was introduced and described within the machine learning and data mining literature [15]. In [17], we have compared several weighting schemes in the domain of time series utilizing the Euclidean distance and the four most widely used unconstrained elastic distance measures (DTW, LCS, ERP, and EDR). Our investigations were based on the largest set of freely available labeled time-series datasets [10] and the obtained results were supported by statistical tests. In these experiments, the accuracy of classification was obtained by 10 runs of stratified 10-fold cross-validation (SCV10x10) using the best value of parameter k obtained in the range from 1 to 30 by
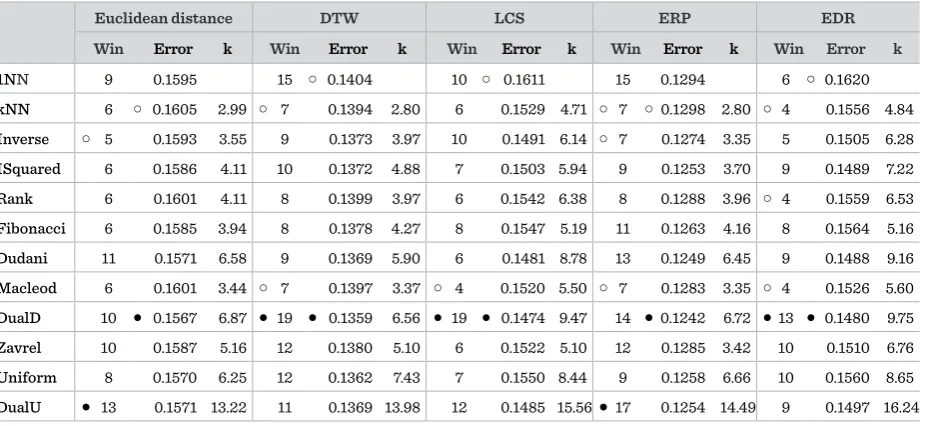
stratified 9-fold cross-validation (SCV1x9) on the respective training sets from the folds. The average classification errors of the examined classifiers and the average values of the parameter k are shown in Table 1 (taken from [17]). The best results are marked with symbol ●, and the worst ones with symbol ○. Column Win denotes the number of datasets for which the corresponding NN classifier gave the smallest classification error, and column Error the average classification error across all datasets. We can see that the best results were achieved by the dual distance-weighted function denoted with DualD [22] in this table.
With these examinations, we have confirmed the view that the simple 1NN classifier is very hard to beat (especially in the case of DTW) [54], but there are some weighting functions with which the kNN classifier can produce better results. Among the analyzed weighting schemes, the best performances were obtained with the dual distance-weighting have confirmed the special importance of the first
neighbor in time-series data: without applying a weighting scheme, the kNN classifier gives the best results when the value of k is 1.
In this step, the main elements of the upgrade of the FAP library included the implementation of the
majority-voting kNN classifier, and the preliminary versions of the basic methods for evaluating the performance of classifiers (holdout, k-fold (stratified) cross-validation and leave-one-out).
(a) (b)
Figure 2 Change of 1NN graph for DTW: (a) the percentage of changed nodes; (b) the percentage of nodes with changed classes
(a) (b)
Figure 3 The impact of the Sakoe-Chiba band on the kNN classifier in case of DTW: (a) average lowest error rates; (b) average smallest warping window widths
Application 4. Comparison of weighting schemes. One of the possible disadvantages of the kNN classifier can be the equality of the nearest neighbors disregarding their distance from the unlabeled time series. We can try to correct this potential drawback by assigning the neighbor's weights proportional to their distances: closer time series will have greater weights. A great number of different weighting schemes was introduced and described within the machine learning and data mining literature [15]. In [17], we have compared several weighting schemes in the domain of time series utilizing the Euclidean distance and the four most widely used unconstrained elastic distance measures (DTW, LCS, ERP, and EDR). Our investigations were based on the largest set of freely available labeled time-series datasets [10] and the obtained results were supported by statistical tests. In these experiments, the accuracy of classification was obtained by 10 runs of stratified 10-fold cross-validation (SCV10x10) using the best value of parameter k obtained in the range from 1 to 30 by
stratified 9-fold cross-validation (SCV1x9) on the respective training sets from the folds. The average classification errors of the examined classifiers and the average values of the parameter k are shown in Table 1 (taken from [17]). The best results are marked with symbol ●, and the worst ones with symbol ○. Column Win denotes the number of datasets for which the corresponding NN classifier gave the smallest classification error, and column Error the average classification error across all datasets. We can see that the best results were achieved by the dual distance-weighted function denoted with DualD [22] in this table.
With these examinations, we have confirmed the view that the simple 1NN classifier is very hard to beat (especially in the case of DTW) [54], but there are some weighting functions with which the kNN classifier can produce better results. Among the analyzed weighting schemes, the best performances were obtained with the dual distance-weighting
a b
a b
have confirmed the special importance of the first neighbor in time-series data: without applying a weighting scheme, the kNN classifier gives the best results when the value of k is 1.
In this step, the main elements of the upgrade of the FAP library included the implementation of the
majority-voting kNN classifier, and the preliminary versions of the basic methods for evaluating the performance of classifiers (holdout, k-fold (stratified) cross-validation and leave-one-out).
(a) (b)
Figure 2 Change of 1NN graph for DTW: (a) the percentage of changed nodes; (b) the percentage of nodes with changed classes
(a) (b)
Figure 3 The impact of the Sakoe-Chiba band on the kNN classifier in case of DTW: (a) average lowest error rates; (b) average smallest warping window widths
Application 4. Comparison of weighting schemes. One of the possible disadvantages of the kNN classifier can be the equality of the nearest neighbors disregarding their distance from the unlabeled time series. We can try to correct this potential drawback by assigning the neighbor's weights proportional to their distances: closer time series will have greater weights. A great number of different weighting schemes was introduced and described within the machine learning and data mining literature [15]. In [17], we have compared several weighting schemes in the domain of time series utilizing the Euclidean distance and the four most widely used unconstrained elastic distance measures (DTW, LCS, ERP, and EDR). Our investigations were based on the largest set of freely available labeled time-series datasets [10] and the obtained results were supported by statistical tests. In these experiments, the accuracy of classification was obtained by 10 runs of stratified 10-fold cross-validation (SCV10x10) using the best value of parameter k obtained in the range from 1 to 30 by
stratified 9-fold cross-validation (SCV1x9) on the respective training sets from the folds. The average classification errors of the examined classifiers and the average values of the parameter k are shown in Table 1 (taken from [17]). The best results are marked with symbol ●, and the worst ones with symbol ○. Column Win denotes the number of datasets for which the corresponding NN classifier gave the smallest classification error, and column Error the average classification error across all datasets. We can see that the best results were achieved by the dual distance-weighted function denoted with DualD [22] in this table.
With these examinations, we have confirmed the view that the simple 1NN classifier is very hard to beat (especially in the case of DTW) [54], but there are some weighting functions with which the kNN classifier can produce better results. Among the analyzed weighting schemes, the best performances were obtained with the dual distance-weighting have confirmed the special importance of the first
neighbor in time-series data: without applying a weighting scheme, the kNN classifier gives the best results when the value of k is 1.
In this step, the main elements of the upgrade of the FAP library included the implementation of the
majority-voting kNN classifier, and the preliminary versions of the basic methods for evaluating the performance of classifiers (holdout, k-fold (stratified) cross-validation and leave-one-out).
(a) (b)
Figure 2 Change of 1NN graph for DTW: (a) the percentage of changed nodes; (b) the percentage of nodes with changed classes
(a) (b)
Figure 3 The impact of the Sakoe-Chiba band on the kNN classifier in case of DTW: (a) average lowest error rates; (b) average smallest warping window widths
Application 4. Comparison of weighting schemes. One of the possible disadvantages of the kNN classifier can be the equality of the nearest neighbors disregarding their distance from the unlabeled time series. We can try to correct this potential drawback by assigning the neighbor's weights proportional to their distances: closer time series will have greater weights. A great number of different weighting schemes was introduced and described within the machine learning and data mining literature [15]. In [17], we have compared several weighting schemes in the domain of time series utilizing the Euclidean distance and the four most widely used unconstrained elastic distance measures (DTW, LCS, ERP, and EDR). Our investigations were based on the largest set of freely available labeled time-series datasets [10] and the obtained results were supported by statistical tests. In these experiments, the accuracy of classification was obtained by 10 runs of stratified 10-fold cross-validation (SCV10x10) using the best value of parameter k obtained in the range from 1 to 30 by
stratified 9-fold cross-validation (SCV1x9) on the respective training sets from the folds. The average classification errors of the examined classifiers and the average values of the parameter k are shown in Table 1 (taken from [17]). The best results are marked with symbol ●, and the worst ones with symbol ○. Column Win denotes the number of datasets for which the corresponding NN classifier gave the smallest classification error, and column Error the average classification error across all datasets. We can see that the best results were achieved by the dual distance-weighted function denoted with DualD [22] in this table.
and the average smallest error rate is almost linear – the growth of parameter k leads to the decline of clas-sification accuracy (Fig. 3a). These experiments have confirmed the special importance of the first neigh-bor in time-series data: without applying a weight-ing scheme, the kNN classifier gives the best results when the value of k is 1.
In this step, the main elements of the upgrade of the FAP library included the implementation of the ma-jority-voting kNN classifier, and the preliminary versions of the basic methods for evaluating the per-formance of classifiers (holdout, k-fold (stratified) cross-validation and leave-one-out).
Application 4.Comparison of weighting schemes.
One of the possible disadvantages of the kNN classi-fier can be the equality of the nearest neighbors dis-regarding their distance from the unlabeled time se-ries. We can try to correct this potential drawback by assigning the neighbor’s weights proportional to their distances: closer time series will have greater weights. A great number of different weighting schemes was introduced and described within the machine learn-ing and data minlearn-ing literature [15]. In [17], we have compared several weighting schemes in the domain of time series utilizing the Euclidean distance and the four most widely used unconstrained elastic distance measures (DTW, LCS, ERP, and EDR). Our
investiga-tions were based on the largest set of freely available labeled time-series datasets [10] and the obtained re-sults were supported by statistical tests.
In these experiments, the accuracy of classification was obtained by 10 runs of stratified 10-fold cross-val-idation (SCV10x10) using the best value of parameter k obtained in the range from 1 to 30 by stratified 9-fold cross-validation (SCV1x9) on the respective training sets from the folds. The average classification errors of the examined classifiers and the average values of the parameter k are shown in Table 1 (taken from [17]). The best results are marked with symbol ●, and the worst ones with symbol ○. Column Win denotes the number of datasets for which the corresponding NN classifier gave the smallest classification error, and column Error the average classification error across all datasets. We can see that the best results were achieved by the dual distance-weighted func-tion denoted with DualD [22] in this table.
With these examinations, we have confirmed the view that the simple 1NN classifier is very hard to beat (es-pecially in the case of DTW) [54], but there are some weighting functions with which the kNN classifier can produce better results. Among the analyzed weighting schemes, the best performances were obtained with the dual distance-weighting scheme (DualD) and with the weighting function defined by Dudani [15].
Table 1
Comparison the average accuracies of different NN classifiers
Euclidean distance DTW LCS ERP EDR
Win Error k Win Error k Win Error k Win Error k Win Error k
1NN 9 0.1595 15 ○ 0.1404 10 ○ 0.1611 15 0.1294 6 ○ 0.1620
Information Technology and Control 2018/3/47 496
Investigating the issue of selecting the best weight-ing scheme in the domain of time-series data minweight-ing has led to the next major upgrade of FAP: it has been updated with the implementation of several variants of the distance-weighted kNN. Moreover, the exist-ing techniques for dividexist-ing the initial set of labeled objects into training and test sets have been adapted in accordance with the requirements of the experi-ments.
3.2 FAP in Multidisciplinary Research
We have used FAP in several multidisciplinary re-search areas including psychology, medicine and emotion recognition.
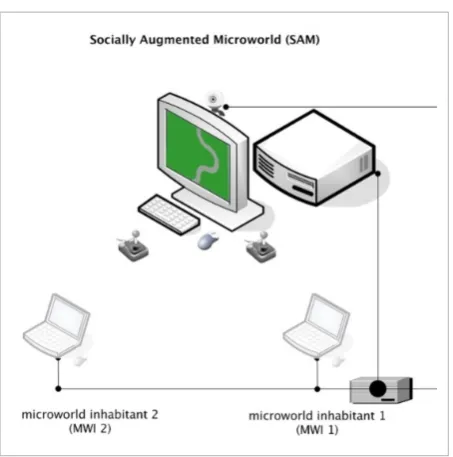
Application 5. Psychological domain. During the bilateral project “Intelligent Techniques for Data Inte-gration and Decision Support in the Medical Domain” in cooperation with our colleagues from Humboldt University, Berlin, we recognized the potential of us-ing FAP in a specific domain from the psychological area. On the basis of its usable characteristics, FAP was used in an experiment with a particular type of microworlds, called Socially Augmented Microworld (SAM). Microworlds represent real-time, ecologically valid computer simulations and are proposed as a tool to study human behavior and decision-making [4, 9]. In [29] and [30], FAP was used for analyzing team be-havior as part of a research project aimed at investi-gating whether artificial agents, developed based on observations of human behaviors, can be considered true substitutes of humans – using data from SAM, a novel type of computer-based simulation developed at Humboldt University, Berlin. In this microworld, two human participants (so called navigators) steer a driving object along 11 virtual tracks (4 solo and 7 cooperative) on a computer display using joysticks (Fig. 4, taken from [30]). The control over the object is shared between the navigators: each of them has only 50% steering input. Their task is to avoid collisions with obstacles and to choose an appropriate direction at forks. The navigators are not allowed to communi-cate, and they receive different instructions regarding their goals (not knowing that their tasks are not the same). For example, one of them may have been told to focus on speed, and the other one on accuracy. In a previous study [7], 26 navigator teams (pairs of navigators) performed individual and cooperative steering over 11 tracks. Their acceleration and
deflec-tion data were recorded into log files. Visually exam-ining the obtained data by two raters, four different types of navigation styles were identified: adapter navigator, extreme steering navigator, no steering navigator, and parallel navigator.
During the experiments in this application, the ob-ject’s speed and position were logged at regular in-tervals. From the collected data, three types of time series (speed, acceleration, and deviation) were ex-tracted and analyzed using FAP in order to validate the four navigator types spotted by visual examina-tion. The investigations were based on classification accuracy of the 1NN classifier by 10-fold cross-val-idation using several distance measures: different forms of the Lp norm, the unconstrained DTW, LCS, EDR, and ERP and their constrained versions using the Sakoe-Chiba band. The experiments showed good classification accuracies, which suggests that the type of the driver could be predicted just on the basis of a few time series of speed, acceleration, and deviation. Furthermore, the obtained results could be used in creation of artificial agents, since the mentioned time series contain valuable information about drivers be-havior and styles.
This application was the first usage of FAP with re-al-world data. Naturally, the data were not in the Figure 4
Socially Augmented Microworld (SAM)
scheme (
DualD
) and with the weighting function
defined by Dudani [15].
Investigating the issue of selecting the best weighting
scheme in the domain of time-series data mining has
led to the next major upgrade of FAP: it has been
updated with the implementation of several variants of
the distance-weighted
k
NN. Moreover, the existing
techniques for dividing the initial set of labeled
objects into training and test sets have been adapted in
accordance with the requirements of the experiments.
Table 1 Comparison the average accuracies of different NN classifiers
Euclidean distance DTW LCS ERP EDR
Win Error k Win Error k Win Error k Win Error k Win Error k
1NN 9 0.1595 15 ○ 0.1404 10 ○ 0.1611 15 0.1294 6 ○ 0.1620
kNN 6 ○ 0.1605 2.99 ○ 7 0.1394 2.80 6 0.1529 4.71 ○ 7 ○ 0.1298 2.80 ○ 4 0.1556 4.84
Inverse ○ 5 0.1593 3.55 9 0.1373 3.97 10 0.1491 6.14 ○ 7 0.1274 3.35 5 0.1505 6.28
ISquared 6 0.1586 4.11 10 0.1372 4.88 7 0.1503 5.94 9 0.1253 3.70 9 0.1489 7.22
Rank 6 0.1601 4.11 8 0.1399 3.97 6 0.1542 6.38 8 0.1288 3.96 ○ 4 0.1559 6.53
Fibonacci 6 0.1585 3.94 8 0.1378 4.27 8 0.1547 5.19 11 0.1263 4.16 8 0.1564 5.16
Dudani 11 0.1571 6.58 9 0.1369 5.90 6 0.1481 8.78 13 0.1249 6.45 9 0.1488 9.16
Macleod 6 0.1601 3.44 ○ 7 0.1397 3.37 ○ 4 0.1520 5.50 ○ 7 0.1283 3.35 ○ 4 0.1526 5.60
DualD 10 ● 0.1567 6.87 ● 19 ● 0.1359 6.56 ● 19 ● 0.1474 9.47 14 ● 0.1242 6.72 ● 13 ● 0.1480 9.75
Zavrel 10 0.1587 5.16 12 0.1380 5.10 6 0.1522 5.10 12 0.1285 3.42 10 0.1510 6.76
Uniform 8 0.1570 6.25 12 0.1362 7.43 7 0.1550 8.44 9 0.1258 6.66 10 0.1560 8.65
DualU ● 13 0.1571 13.22 11 0.1369 13.98 12 0.1485 15.56 ● 17 0.1254 14.49 9 0.1497 16.24
3.2 FAP in Multidisciplinary Research
We have used FAP in several multidisciplinary
research areas including psychology, medicine and
emotion recognition.
Application 5. Psychological domain.
During the
bilateral project “
Intelligent Techniques for Data
Integration and Decision Support in the Medical
Domain
” in cooperation with our colleagues from
Humboldt University, Berlin, we recognized the
potential of using FAP in a specific domain from the
psychological area. On the basis of its usable
characteristics, FAP was used in an experiment with a
particular type of microworlds, called
Socially
Augmented Microworld
(SAM). Microworlds
represent real-time, ecologically valid computer
simulations and are proposed as a tool to study human
behavior and decision-making [4, 9].
In [29] and [30], FAP was used for analyzing team
behavior as part of a research project aimed at
investigating whether artificial agents, developed
based on observations of human behaviors, can be
considered true substitutes of humans – using data
from SAM, a novel type of computer-based simulation
developed at Humboldt University, Berlin. In this
microworld, two human participants (so called
navigators
) steer a driving object along 11 virtual
tracks (4 solo and 7 cooperative) on a computer
display using joysticks (Fig. 4, taken from [30]). The
control over the object is shared between the
navigators: each of them has only 50% steering input.
Their task is to avoid collisions with obstacles and to
choose an appropriate direction at forks. The
navigators are not allowed to communicate, and they
receive different instructions regarding their goals (not
knowing that their tasks are not the same). For
example, one of them may have been told to focus on
speed, and the other one on accuracy.
Figure 4 Socially Augmented Microworld (SAM)
In a previous study [7], 26 navigator teams (pairs of
navigators) performed individual and cooperative
steering over 11 tracks. Their acceleration and
deflection data were recorded into log files. Visually
examining the obtained data by two raters, four
different types of navigation styles were identified:
adapter navigator, extreme steering navigator, no
steering navigator, and parallel navigator.
suitable form for usage with FAP system. Therefore, several preprocessing algorithms were implemented in order to prepare the data for further analysis. Fur-thermore, most of the preprocessing tasks, even those not needed for this particular application, were devel-oped here for use in some further applications.
Application 6. Medical domain. Within the same bilateral project, FAP was used in a pure medical do-main for examination of medical checkups. Time-se-ries methods proved to be very valuable for analysis of different medical indicators which are recorded regularly over time. In [37], FAP was utilized to ex-amine the adequacy of various time-series distance measures in an effort to detect Tacrolimus-sensitive patients. Tacrolimus, one of the most frequently used immunosuppressive drugs, prevents the kidney from being rejected after transplantation. It is assumed that the level of administered Tacrolimus should di-rectly influence the level of creatinine which serves as an indicator of the kidney function. The standard measurement for monitoring kidney function (Global Filtration Rage – GFR) is estimated based on plasma creatinine concentration, gender, and age of patients (eGFR – estimated GFR) and is expected to be strong-ly correlated with creatinine.
The medical data analyzed in this study were collect-ed at the Department of Nephrology of University Hospital Charité in Berlin. They contain creatinine and eGFR parameters, as well as Tacrolimus levels of 761 patients in the form of time series. The data were recorded at the scheduled visits in the outpatient
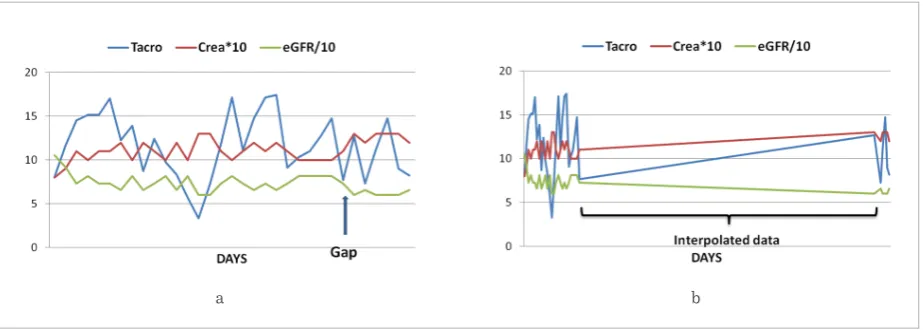
department and during stays at the inpatient ward. Because the number of measurements and the dura-tion of the gaps between successive recordings varies from patient to patient, the resulting time series are not equidistant and are not of the same length. Tak-ing into account these characteristics of the data, two strategies for time-series extraction were implement-ed: the time series were used in their original form, and by applying linear interpolation. An example of these strategies is given in Fig. 5 (taken from [37]). The main goal of this research was to enable the detec-tion of those patients for which the creatinine/eGFR and Tacrolimus values are not related in the assumed manner. The presumption was that such patients are more sensitive to high Tacrolimus levels and should be treated carefully in order not to overdose them with Tacrolimus. To achieve this objective, the dis-tances between Tacrolimus and creatinine/eGFR time series were computed and investigated. The fol-lowing distance measures were examined: L½, L1, L2, L∞, DTW, ERP, Pearson, and Spearman. Among them,
the Spearman and Pearson measures have provided the most promising results in case of the non-inter-polated approach, and the constrained DTW measure (using small values of the warping window) in case of the strategy with interpolated time-series.
The application in another real-world domain intro-duced the problem of non-equidistant time series, which is very common in real data. This influenced the integration of linear interpolation into the FAP system. Spline interpolation could also be used here,
Figure 5
Tacrolimus, Creatinine, and eGFR time series generated without (a) and with (b) interpolation accuracies, which suggests that the type of the driver
could be predicted just on the basis of a few time series of speed, acceleration, and deviation. Furthermore, the obtained results could be used in creation of artificial agents, since the mentioned time series contain valuable information about drivers behavior and styles.
This application was the first usage of FAP with real-world data. Naturally, the data were not in the suitable form for usage with FAP system. Therefore, several preprocessing algorithms were implemented in order to prepare the data for further analysis. Furthermore, most of the preprocessing tasks, even those not needed for this particular application, were developed here for use in some further applications.
Application 6. Medical domain. Within the same bilateral project, FAP was used in a pure medical domain for examination of medical checkups. Time-series methods proved to be very valuable for analysis of different medical indicators which are recorded regularly over time. In [37], FAP was utilized to examine the adequacy of various time-series distance measures in an effort to detect Tacrolimus-sensitive patients. Tacrolimus, one of the most frequently used immunosuppressive drugs, prevents the kidney from being rejected after transplantation. It is assumed that the level of administered Tacrolimus should directly influence the level of creatinine which serves as an indicator of the kidney function. The standard measurement for monitoring kidney function (Global Filtration Rage – GFR) is estimated based on plasma creatinine concentration, gender, and age of patients (eGFR – estimated GFR) and is expected to be strongly correlated with creatinine.
The medical data analyzed in this study were collected at the Department of Nephrology of University Hospital Charité in Berlin. They contain creatinine and eGFR parameters, as well as Tacrolimus levels of 761 patients in the form of time series. The data were
recorded at the scheduled visits in the outpatient department and during stays at the inpatient ward. Because the number of measurements and the duration of the gaps between successive recordings varies from patient to patient, the resulting time series are not equidistant and are not of the same length. Taking into account these characteristics of the data, two strategies for time-series extraction were implemented: the time series were used in their original form, and by applying linear interpolation. An example of these strategies is given in Fig. 5 (taken from [37]).
The main goal of this research was to enable the detection of those patients for which the creatinine/eGFR and Tacrolimus values are not related in the assumed manner. The presumption was that such patients are more sensitive to high Tacrolimus levels and should be treated carefully in order not to overdose them with Tacrolimus. To achieve this objective, the distances between Tacrolimus and creatinine/eGFR time series were computed and investigated. The following distance measures were examined: L½, L1, L2, L∞, DTW, ERP, Pearson, and
Spearman. Among them, the Spearman and Pearson measures have provided the most promising results in case of the non-interpolated approach, and the constrained DTW measure (using small values of the warping window) in case of the strategy with interpolated time-series.
The application in another real-world domain introduced the problem of non-equidistant time series, which is very common in real data. This influenced the integration of linear interpolation into the FAP system. Spline interpolation could also be used here, but it was assumed that it will give similar results with much greater calculation time. On the other hand, linear interpolation is the most fair approach for “filling the gaps” when nothing is known about the process which generated the time series.
(a) (b)
Figure 5 Tacrolimus, Creatinine, and eGFR time series generated without (a) and with (b) interpolation
Application 7. Emotion recognition. During the bilateral project “Emotional Intelligence and Applications Based on Multi-Agent Systems”, together with colleagues from Fudan University, Shanghai, we have used the Framework for Analysis and Prediction to examine the possibility of applying time-series
data-mining techniques in the field of emotion recognition [25, 33, 34]. Within these experiments, participants of two nationalities (four Chinese and two Serbian) listened to short vocal sentences pronounced by native Mandarin speakers in different emotional states (angry, fear, happy, neutral, sad, surprised), and accuracies, which suggests that the type of the driver
could be predicted just on the basis of a few time series of speed, acceleration, and deviation. Furthermore, the obtained results could be used in creation of artificial agents, since the mentioned time series contain valuable information about drivers behavior and styles.
This application was the first usage of FAP with real-world data. Naturally, the data were not in the suitable form for usage with FAP system. Therefore, several preprocessing algorithms were implemented in order to prepare the data for further analysis. Furthermore, most of the preprocessing tasks, even those not needed for this particular application, were developed here for use in some further applications.
Application 6. Medical domain. Within the same bilateral project, FAP was used in a pure medical domain for examination of medical checkups. Time-series methods proved to be very valuable for analysis of different medical indicators which are recorded regularly over time. In [37], FAP was utilized to examine the adequacy of various time-series distance measures in an effort to detect Tacrolimus-sensitive patients. Tacrolimus, one of the most frequently used immunosuppressive drugs, prevents the kidney from being rejected after transplantation. It is assumed that the level of administered Tacrolimus should directly influence the level of creatinine which serves as an indicator of the kidney function. The standard measurement for monitoring kidney function (Global Filtration Rage – GFR) is estimated based on plasma creatinine concentration, gender, and age of patients (eGFR – estimated GFR) and is expected to be strongly correlated with creatinine.
The medical data analyzed in this study were collected at the Department of Nephrology of University Hospital Charité in Berlin. They contain creatinine and eGFR parameters, as well as Tacrolimus levels of 761 patients in the form of time series. The data were
recorded at the scheduled visits in the outpatient department and during stays at the inpatient ward. Because the number of measurements and the duration of the gaps between successive recordings varies from patient to patient, the resulting time series are not equidistant and are not of the same length. Taking into account these characteristics of the data, two strategies for time-series extraction were implemented: the time series were used in their original form, and by applying linear interpolation. An example of these strategies is given in Fig. 5 (taken from [37]).
The main goal of this research was to enable the detection of those patients for which the creatinine/eGFR and Tacrolimus values are not related in the assumed manner. The presumption was that such patients are more sensitive to high Tacrolimus levels and should be treated carefully in order not to overdose them with Tacrolimus. To achieve this objective, the distances between Tacrolimus and creatinine/eGFR time series were computed and investigated. The following distance measures were examined: L½, L1, L2, L∞, DTW, ERP, Pearson, and
Spearman. Among them, the Spearman and Pearson measures have provided the most promising results in case of the non-interpolated approach, and the constrained DTW measure (using small values of the warping window) in case of the strategy with interpolated time-series.
The application in another real-world domain introduced the problem of non-equidistant time series, which is very common in real data. This influenced the integration of linear interpolation into the FAP system. Spline interpolation could also be used here, but it was assumed that it will give similar results with much greater calculation time. On the other hand, linear interpolation is the most fair approach for “filling the gaps” when nothing is known about the process which generated the time series.
(a) (b)
Figure 5 Tacrolimus, Creatinine, and eGFR time series generated without (a) and with (b) interpolation
Application 7. Emotion recognition. During the bilateral project “Emotional Intelligence and Applications Based on Multi-Agent Systems”, together with colleagues from Fudan University, Shanghai, we have used the Framework for Analysis and Prediction to examine the possibility of applying time-series
data-mining techniques in the field of emotion recognition [25, 33, 34]. Within these experiments, participants of two nationalities (four Chinese and two Serbian) listened to short vocal sentences pronounced by native Mandarin speakers in different emotional states (angry, fear, happy, neutral, sad, surprised), and
Information Technology and Control 2018/3/47 498
but it was assumed that it will give similar results with much greater calculation time. On the other hand, linear interpolation is the most fair approach for “filling the gaps” when nothing is known about the process which generated the time series.
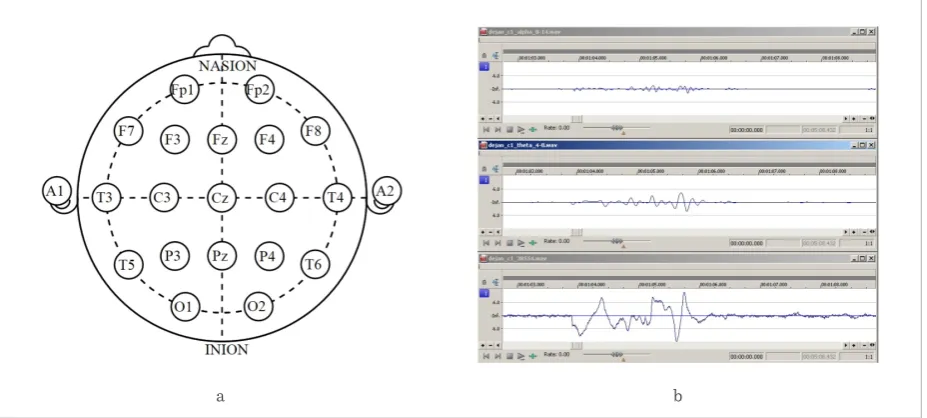
Application 7. Emotion recognition. During the bilateral project “Emotional Intelligence and Appli-cations Based on Multi-Agent Systems”, together with colleagues from Fudan University, Shanghai, we have used the Framework for Analysis and Predic-tion to examine the possibility of applying time-se-ries data-mining techniques in the field of emotion recognition [25, 33, 34]. Within these experiments, participants of two nationalities (four Chinese and two Serbian) listened to short vocal sentences pro-nounced by native Mandarin speakers in different emotional states (angry, fear, happy, neutral, sad, sur-prised), and to various types of music clips (jazz, rock and roll, a Chinese classic song and a song with Chi-nese traditional instruments), and their EEG signals were measured.
During the data acquisition process, the participants’ brain activity was recorded in form of electroenceph-alogram (EEG) signals. Scalp electrodes were applied in accordance with the 10-20 standard (Fig. 6a) and
using the bipolar model. In this manner, 8 channels were constructed. The obtained EEG signals were decomposed into four frequency bands (alpha, beta, gamma, and theta) using the two-pole Butterwoth fil-ter (Fig. 6b), taken from [34]). Finally, a dataset with a total of 1920 time series was obtained for the 6 partic-ipants and 10 types of audio clips.
With these time series, two sets of experiments were performed. The aim of the first phase was to deter-mine whether there are similarities between the time series of different participants for the same emotion, regardless of their nationalities. In the second phase, we investigated whether there are significant differ-ences in the brain signals of the participants of dif-ferent nationalities. Both experimental setups were based on classification error rates using 10 runs of 10-fold stratified cross-validation with the simple 1NN classifier and the DTW distance measure. However, neither of these two approaches was able to identify a combination of channel and frequency band that would help in distinguishing between the record-ed brain signals. Afterwards, we performrecord-ed detailrecord-ed analysis and better pre-processing of data, which can be done in easy and straightforward way in FAP. This work is still in progress, but the preliminary results are promising.
Figure 6
Obtaining and decomposing EEG signals: (a) electrodes of the 10-20 standard; (b) decomposing a raw EEG signal (bottom) into theta (middle) and alpha (top) frequency bands. (a) obtained from http://commons.wikimedia.org/wiki/ File:21_electrodes_of_International_10-20_system_for_EEG.svg on February 10, 2015. Public domain
to various types of music clips (jazz, rock and roll, a Chinese classic song and a song with Chinese traditional instruments), and their EEG signals were measured.
During the data acquisition process, the participants' brain activity was recorded in form of electroencephalogram (EEG) signals. Scalp electrodes were applied in accordance with the 10-20 standard (Fig. 6a) and using the bipolar model. In this manner, 8 channels were constructed. The obtained EEG signals were decomposed into four frequency bands (alpha, beta, gamma, and theta) using the two-pole Butterwoth filter (Fig. 6b), taken from [34]). Finally, a dataset with a total of 1920 time series was obtained for the 6 participants and 10 types of audio clips. With these time series, two sets of experiments were performed. The aim of the first phase was to determine whether there are similarities between the time series of different participants for the same emotion, regardless of their nationalities. In the second
phase, we investigated whether there are significant differences in the brain signals of the participants of different nationalities. Both experimental setups were based on classification error rates using 10 runs of 10-fold stratified cross-validation with the simple 1NN classifier and the DTW distance measure. However, neither of these two approaches was able to identify a combination of channel and frequency band that would help in distinguishing between the recorded brain signals. Afterwards, we performed detailed analysis and better pre-processing of data, which can be done in easy and straightforward way in FAP. This work is still in progress, but the preliminary results are promising.
This application involved the processing of real-world time series of high dimensionality (several thousand). Therefore, much effort is devoted to the optimization and improvement of computation efficiency. Furthermore, some of the preprocessing tasks are refined and the algorithm for resuming is improved.
(a) (b)
Figure 6 Obtaining and decomposing EEG signals: (a) electrodes of the 10-20 standard; (b) decomposing a raw EEG signal (bottom) into theta (middle) and alpha (top) frequency bands. (a) obtained from http://commons.wikimedia.org/wiki/
File:21_electrodes_of_International_10-20_system_for_EEG.svg on February 10, 2015. Public domain.
Application 8. An agent-based distributed
computing system. Performing time-series
experiments can often be accelerated by pre-calculating the distances between the time series of the datasets and storing the obtained values in the form of distance matrices (especially in case of long time series and/or complex distance measures). The distance matrix for a dataset is a matrix where element (i,j) contains the distance between the i-th and the j-th time series from the set.
The process of calculating distance matrices itself can be a very resource-demanding operation, too (in terms of CPU time and the required amount of memory). Our Department has several networked computer classrooms which can be used to distribute distance matrix calculations. However, they are actively used for teaching in a number of computer science courses.
In addition, the students are free to use these, often low performance, personal computers during the working hours. In order to utilize them for calculating distance matrices relying on the FAP library, we have implemented an agent-based distributed system [42] taking into account that any of these computers may become unavailable for the calculations at any time (i.e. when occupied by a student), and may become available again later.
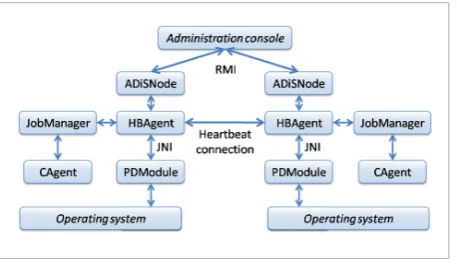
ADiS (Agent-based Distributed computing System) [41] is a generalization of this system that represents a general-purpose, extensible architecture (through plugins) for arbitrary computing in a distributed environment specifically designed for dynamic networks. It is well-suited for networks of heterogeneous, often low-end personal computers. The
to various types of music clips (jazz, rock and roll, a Chinese classic song and a song with Chinese traditional instruments), and their EEG signals were measured.
During the data acquisition process, the participants' brain activity was recorded in form of electroencephalogram (EEG) signals. Scalp electrodes were applied in accordance with the 10-20 standard
(Fig. 6a) and using the bipolar model. In this manner, 8 channels were constructed. The obtained EEG signals were decomposed into four frequency bands (alpha, beta, gamma, and theta) using the two-pole Butterwoth filter (Fig. 6b), taken from [34]). Finally, a dataset with a total of 1920 time series was obtained for the 6 participants and 10 types of audio clips. With these time series, two sets of experiments were performed. The aim of the first phase was to determine whether there are similarities between the time series of different participants for the same emotion, regardless of their nationalities. In the second
phase, we investigated whether there are significant differences in the brain signals of the participants of different nationalities. Both experimental setups were based on classification error rates using 10 runs of 10-fold stratified cross-validation with the simple 1NN classifier and the DTW distance measure. However, neither of these two approaches was able to identify a combination of channel and frequency band that would help in distinguishing between the recorded brain signals. Afterwards, we performed detailed analysis and better pre-processing of data, which can be done in easy and straightforward way in FAP. This work is still in progress, but the preliminary results are promising.
This application involved the processing of real-world time series of high dimensionality (several thousand). Therefore, much effort is devoted to the optimization and improvement of computation efficiency. Furthermore, some of the preprocessing tasks are refined and the algorithm for resuming is improved.
(a) (b)
Figure 6 Obtaining and decomposing EEG signals: (a) electrodes of the 10-20 standard; (b) decomposing a raw EEG signal (bottom) into theta (middle) and alpha (top) frequency bands. (a) obtained from http://commons.wikimedia.org/wiki/
File:21_electrodes_of_International_10-20_system_for_EEG.svg on February 10, 2015. Public domain.
Application 8. An agent-based distributed
computing system. Performing time-series
experiments can often be accelerated by pre-calculating the distances between the time series of the datasets and storing the obtained values in the form of
distance matrices (especially in case of long time series and/or complex distance measures). The distance matrix for a dataset is a matrix where element (i,j) contains the distance between the i-th and the j-th time series from the set.
The process of calculating distance matrices itself can be a very resource-demanding operation, too (in terms of CPU time and the required amount of memory). Our Department has several networked computer classrooms which can be used to distribute distance matrix calculations. However, they are actively used for teaching in a number of computer science courses.
In addition, the students are free to use these, often low performance, personal computers during the working hours. In order to utilize them for calculating distance matrices relying on the FAP library, we have implemented an agent-based distributed system [42] taking into account that any of these computers may become unavailable for the calculations at any time (i.e. when occupied by a student), and may become available again later.
ADiS (Agent-based Distributed computing System) [41] is a generalization of this system that represents a general-purpose, extensible architecture (through plugins) for arbitrary computing in a distributed environment specifically designed for dynamic networks. It is well-suited for networks of heterogeneous, often low-end personal computers. The