Volume 4, Issue 1 (2015) pp. 43-47
43 | Page Original Article
Power-aware Computation and Programming with GPU
Accelerators
Mahboobeh Eshaghi Gorji
Department of Engineering and Research Branch, Mazandaran Branch, Islamic Azad University, Mazandaran, Iran
*Corresponding Author E-mail: [email protected]
Received: 11 December 2014, Revised: 20 January 2015, Accepted: 29 February 2015
ABSTRACT
Present concerns about the amount and intensity of power in modern processors have been led to significant computer architecture research efforts in power-aware and temperature-aware calculations. Since power dissipation becomes an irritating growing problem, the graphic processor unit (GPU) analysis of power and its components is very difficult to design software and hardware systems. At present, GPU has become to an integral part of computing systems mainstream with multi-core multidisciplinary processors, with high symmetry and balance and high computational power and memory very high-band width. To find the rules and principles of power-aware programming with GPU accelerators, we exploit a set of the basics from programming languages. These power consumption amounts are efficient to estimate and evaluate the power during high-level programs development.
Keywords: GPU, Power-aware Programming Principals.
Introduction
Despite the present issue about power consumption and heat dissipation, which limit the multi-core GPUs, the importance of a graphic processor unit (GPU) is not sufficiently admissible. GPUs that accelerate the computation systems had focused the importance and attention of researchers and scientists to itself, because they have tremendous and huge computing power and high-memory bandwidth and inherently are fit to the huge parallel computations of data. In the ranking on 2011 November, about 39 of 500 high-level computers use and utilizes GPUs and 17 of this were on the ranking of 2011 June [1] .
The results of growing power consumptions are solutions and approaches of more complicated cooling and high-noise fans. Cooling the video card (graphic card) is very difficult especially when users demand silent and quiet cooling approaches.
44 | Page and key observation to run and implement
the AMG development.
The Objective in Research
In this research, we just review and survey representative and sample indicators and apply these reviewed criteria for induction and deduction of desired criteria. After we obtain all desired and appropriate criteria about event of components, we use a power model in each event that is obtained from a circuit model, for those components to compute the power of each component. We also indicate the power against temperature in several central cores.
Research Background
In the context of parallel computations, high performance is usually considered as the most important indicator, but when the performance is improved, the power consumption is also increased. Our research team works on parallel bulk computations with GPUs. We have had several achievements in improving and modifying the performance in recent years. For instance, we create a FFT code (called PKUFT) which reaches to the speed 24.3 fold as for FFTW and 7 fold with respect to InTelMKL for single-precision FFT HO963D in PKUMcClus [2].
The consumption of power is measureable. The present researchers are mainly at the educational level of architecture level or even orbital in the field of power consumption. The educational level approaches analysis the power from the view point of instruction and training with exploring in traditional and also gate-level power. These cases are very appropriate to optimization and applying computers with limited power and embedded computational applications [3]. The power estimation is indicated in architecture-level and orbital-level that seems to be a valid power model for designing Godson-1 micro-processor [4].
Mapping the Power
Although the measuring method of power for a simple instruction about processors provide adequate results, but mapping a phrases in very high-level language like C/CUDA is very hard for programmers. In fact, a programmer is more concerned about the changes in system’s power consumption due to operation and performance of the program. It is clear that all the phrases in a high-level language do not lead to changes in power consumption. Therefore we need to find out which operation leads to status change and significant differences of power consumption. Hence from the view point of power changes, we take the power consumption mapping from phrases into the running system.
In this experiment, the new mode and the dead mode have no additional consumption, so their power is equal to the idle mode. The work gap and distance, before and after this gap of working mode is the most complicated mode and requires paying rapid and more attention and importance. There are two major modes of working. The instant and continuous modes. For example, memory allocation is an immediate mode because this memory allocation operation will be finished in a short time and could be understood by programmer. The data transfer mode is a continuous mode because it might require a relative longer time even about some seconds.
Power mapping
For a programmer who applies high-level language, being aware of how much power is consumed in each phrase is very hard, although some researchers have explored some methods to search power consumption in each instruction.
45 | Page changes in phrases. So being aware of power
consumption with mapping these phrases to some initial operations is simple.
Predictions of Power
To predict the power that uses our model, we apply a simple matrix-matrix multiplication which does not uses shared memory and in the last part, we show the average power prediction for main core and main MAGMA. To multiplication of matrices which do not use shared memory, the number that is read for total memory is N2and the number that
the central core writes it down is N AVA because we consider 2 N8N matrices.
The average consumed power by this kernel about 14K, 13W. We choose matrix with 14K size. Since GPU C2075 has 14SM and each SM has 1024 threads, so that for a matrix with the size of 14K all of these threads in each SM are working, the average power in consumed power by this kernel that uses shared memory is equal to 120W. Because the number of readings and writings in total and global memory is reduced by a big factor. The prediction by applying AMG is a important step, because the previous generations of GPU such as Nvidia Co2050, does not support NVML completely. To predict and determine the power, we require run time and one of these components.
Measuring and Evaluating Power
Experimental Platform
Different system architectures have some differences in their own power consumption and we extended our experiment in one of the Clus nodes, called PKUM. The significant characteristic is that this node is equipped with two GPU cards of same type and two Infini Band adaptor cards. The most important configurations are listed in Table 1.
Table 1. Preliminary principles
rule Tools
Im
m
ed
iate
MEM ALLOC() Memory
allocation
MEM FREE() Free memory
FLOW CONT() Flow control
LIB-LOAD() Library load
LIB-FREE() Unload library
START-THREAD() thread start
STOP-THREAD() Thread stop
START-PROC() Process start
STOP-PROC() Process stop
Co
nti
nu
ou
s
DATA=TRANS() Data transfer
CALC() Calculation
WORK-GAP() Work stop
MSG-PAS() Message passing
Framework for Measuring and Evaluating the Power
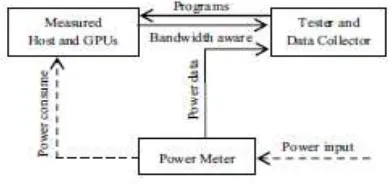
Comparing methods extend the complicated process. With the above mentioned simple program, we could see our power measuring method uses a simple criteria and power meter with set of test programs and also necessary data analysis. Figure 1 is a schematic of our process-level measuring framework.
Figure 1. Measuring Framework
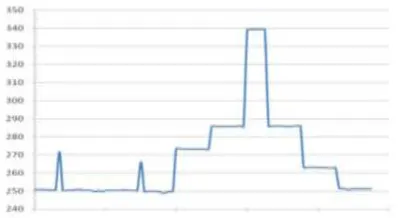
46 | Page changes in power consumption. Critical
data points have been labeled.
Figure 2. Curves for power consumption in
accordance with test algorithm
By looking at this curve, we find out that memory allocation in line 3 leads to an immediate increase of power in 21W. Similarly the allocated memory in MPI, leads to an immediate increase in 16W. When the initial operations MSG.PAS are invoked, this process starts to wait for a MSG-PAS (SEND) according to corresponding process. This waiting mode consumes power up to 23/3 W. In the work gap the power consumption maintains same amount. In a cycle 50, CUDA memory allocation is invoked and the power consumption is increased up to 285/7 W. In cycle 60 data transfer starts and the power consumption is increased to 339/4 W. After this data transfer is completed, the power consumption is decreased to 285/88 W.
Single band in data transfer
Granularity of data transfer has close relation with power and bandwidth. We have tested how bandwidth and power change and this granularity is in a domain of 64B to 64MB. The results are listed in figures 3 and 4.
Figure 3. Bandwidth curves in accordance
with granularity various size
Figure 4. Power consumption curves in
accordance with granularity various size Figures 3 and 4 indicate both bandwidth and power are increasing when this granularity increases. The sufficient granularity size will lead to a better performance in bandwidth. When this amount reaches to 64MB, both power and bandwidth are equal.
Two Narrow Flows in Simultaneous Transmission
The experimental results for two simultaneous flows in two cards are listed in Table 2. Granularity is 64MB in which, will lead to complete data bandwidth transfer in these experiments. These 2 GPU cards are both NVIDIA C10600 type. Also with simple and individual tests, we could see that their power consumption and their bandwidth are somewhat different with these simultaneous modes.
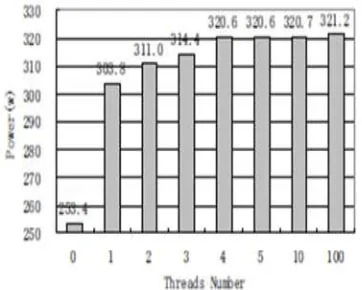
47 | Page Figure 5 indicates the power consumption
when multiple strip streams implement simultaneously. Each flow operates on some computational tasks. In figure 5, the implementation of the first flow, shows a jump from 253/4W to 303/8W. In the second, third and fourth one, this is done successfully and power increases as linear up to 320/6W. But after that, new flows with ID, do not indicate any new power increment in a domain between 4 to 100. This phenomenon is mostly explained suchthat nodes apply a quad-core CPU.
Figure 5. Power consumption in multiple
strips in simultaneous mode
Productivity and Efficiency Analysis of Power
Our programming experiment shows that knowledge about data transfer rate in both power units is useful and helpful for a programmer. B is the data transfer bandwidth and P is the power consumption and is this transfer rate, P1 is
idle mode power. E implies the efficiency:
)
/(
P
P
1B
E
Conclusion
To help high-level programmers being informed about the performance and power consumption in GPU accelerators, a mapping from hardware to initial mode is being studied. In this model, we have described a set of initial principals briefly which changes the mode of one flow. A mode changing and its understanding are simple for programmer and this corresponded power changing is measureable in a high-level language. We have evaluated the amount of this ordinary initial principal power consumption and provided a data transfer performance diagram to help high-level programmers to be informed about performance-power consumption which is under development.
References
Hans Meuer J.D., (2012). Erich Strohmaier, “TOP500 Supercomputer Site,” http://www.top500.org, 2012
Chen Y., Cui X., Mei, H. (2010). “Large-Scale FFT on GPU Clusters”, Proceedings of the 24th ACM International Conference on Supercomputing (ICS ’10), June 2-4, 2010, Tsukuba, Ibaraki, Japan, pp. 315-324.
Tiwari V., Malik S., Wolfe, A. (1996). “Instruction Level Power Analysis and Optimization of Software”, Journal of VLSI Signal Processing Systems 13(1996), pp. 223-238.
Feng Z., Xiao J. and Hu, W. (2007). “Validation of Architecture Level Power Estimation for Godson-1 Microprocessor Design”, Journal of Computer-aided Design & Computer Graphics, Vol 19, No.9. pp. 1190-1195.
How to cite this article:Mahboobeh Eshaghi Gorji, Power-aware Computation and Programming with GPU Accelerators. International Journal of Advanced Studies in
Humanities and Social Science, 2015, 4(1), 43-47.