Published by Central Fisheries Research Institute (SUMAE) Trabzon, Turkey in cooperation with Japan International Cooperation Agency (JICA), Japan
R E S E A R C H P A P E R
Changes in Hematological Parameters, and Copper and Iron
Concentrations in Tissues of Prussian Carp during Depuration
Period after the Previous Exposure to Copper in Water
Łuszczek
-Trojnar Ewa
1,* , Grosiki Dawid
1, Drąg
-Kozak Ewa
1, Guja Iwona
1, Popek
Włodzimierz
11University of Agriculture in Krakow, Department of Ichthyobiology and Fisheries, Spiczakowa 6, 30-199
Kraków-Mydlniki, Poland.
Article History Received 07 May 2018 Accepted 20 September 2018 Early View 28 September 2018
Corresponding Author Tel.: +48126375176
E-mail: [email protected]
Keywords
Carassius gibelio
Heavy metals Blood parameters Recovery
Abstract
The purpose of the present paper was to investigate the process of copper elimination and iron concentration variations in the body of Prussian carp after short-term exposure (2.5 or 5 hours) to a sublethal concentration of this metal in water, and to identify the hematological changes occurring in peripheral blood during exposure and depuration. Prussian carps (Carassius gibelio Bloch, 1782) were exposed to 2 mg Cu L-1 for 2.5 or 5 hours. During the 336 hours of depuration period, a concentration of red blood cells RBC, white blood cells WBC and hematocrit, as well as Cu and Fe concentration in gills, liver, muscle and kidney were determined. Significant decrease in WBC and RBC after the exposure cessation was observed and the increase in hematocrit value. Cu concentration in studied tissues of Prussian carp was the highest after the exposure cessation, and then was decreasing during the recovery period, reaching control values, except the kidney where the Cu level remained significantly increased till the end of the observation. Even a relatively short exposure to Cu is reflected in a change in normal morphological parameters and microelement metabolism in the tissue, and its effects can be observed for as long as 2 weeks following the end of exposure. Potentially, this means that any shortening of acute exposure may contribute to quicker restoration of homeostasis during depuration with regard to the blood parameters and microelement levels studied.
Introduction
The toxic metals are the most frequently detected pollutants in the aquatic environment, and their effects identification are essential to protect the ecosystems integrity as well as human health (Gheorghe, Stoica, Vasile, Nita-Lazar, Stanescu, & Lucaciu, 2017). Copper (Cu) is considered as the one of the most toxic metals to aquatic organisms. This element may affect fish negatively, even if present in small amounts in the environment (Yuvanatemiya & Boyd, 2006). Studies carried out with various fish species showed that excess copper causes structural deformations in gill tissue, changes in biochemical and haematological parameters (Ciftci, Cicik, Erdem, & Ay, 2008),
coordination disturbances in swimming activities or rejection of food uptake (Karayakal et al., 2010). In unpolluted rivers the concentration of Cu is lower than 0.05 mg/L (Journal of Laws, 2016). For fish the recommended Cu concentration in water is below 0.04 mg/L at water hardness 100 mg CaCO3/L (Journal of
Laws, 2002). In a polluted environment, Cu is present at as high a concentration as 1.37 mg/L in the Pulumur river in Turkey (Şeker & Kutlu, 2014). The lethal Cu concentration for fish is in the range from 2.8 - 6.4 mg/L (Jezierska & Witeska, 2001).
and phenylalanine hydroxylase (Linder & Hazegh-Azam, 1996). Ceruloplasmin is the most abundant Cu-dependent ferroxidase enzyme with a Cu-Cu-dependent oxidation activity (Bost et al., 2016). Copper deficiency may lead to osteoporosis or reduced iron absorption and red blood cell production, which leads to anemia, growth reduction and infertility.
Fish can obtain copper from either water or their diet. Copper is well known for inducing hematotoxicity in fish, often resulting in anemia and immunosuppression (e.g., Svobodova, Vykusova, & Machova, 1994; Witeska, Kondera, Lipionoga, & Jastrzębska, 2010). Toxicants accumulate in the blood by forming complexes with blood cells and plasma proteins, and subsequently penetrating into target organs (Rauf, Javed, & Ubaidullah, 2009). Short-term exposure of juvenile carp to Cu-NPs causes oxidative stress and impart serious deleterious effects in the tissues which may affect fish growth and development (Gupta et al., 2016).
The largest accumulation of copper occurs in soft tissue, e.g. in the liver, kidneys, spleen, gut, gills, and gonads, where the metal binds with metallothionein (Bozhkov, Padalko, Dlubovskaya, & Menzianova, 2010). In addition to causing a range of physiological disorders, sublethal concentrations of Cu also affect energy metabolism in fish. The consequences of this include behavioral disorders, development retardation, fertility impairment, and increased susceptibility to disease. Biliary copper is discharged to the intestine, where, after minimal reabsorption, it is eliminated in the faeces. In humans, less than 3% of the daily copper intake is excreted in urine. Excretion of copper in bile may be even more important than absorption in regulating the total body level of copper (Turnlund, Keyes, Peiffer, & Scott, 1998).
The cited above reports indicate that Cu plays an important role in the normal functioning of aquatic organisms, particularly with regard to the circulatory system. Copper influence iron absorption and red blood cell production. Therefore, the purpose of the present paper was to investigate the process of copper elimination and iron concentration variations in the body of Prussian carp after short-term exposure (2.5 or 5 hours) to a sublethal concentration of this metal in water, and to identify the hematological changes occurring in peripheral blood during exposure and depuration.
Materials
and MethodsThe research was conducted in the Fishery Experimental Station of the Department of Ichthyobiology and Fisheries of the University of Agriculture in Krakow, Poland. Two hundred Prussian carp (Carassius gibelio Bloch, 1782) aged 2 years, purchased from the Experimental Fishery Department of the Inland Fisheries Institute in Zator, Poland, were
used in the study. They were placed in nine 300 L aquariums (23 fish per aquarium, or about 1.5 kg of fish per 100 L) with constantly aerated and filtrated water for 14 days in order to acclimatize them to the experimental conditions. The same aquariums were used to fish depuration after the exposure. The physicochemical characteristics of the water from the Municipal Waterworks in Krakow were as follows: pH = 7.6, dissolved oxygen concentration 9.5 mg·L-1, water
hardness 185 mg CaCO3 L-1, temperature 17 ± 1°C, Cu
concentration below 0.005 mg·L-1. The fish were fed
once a day with natural live food larvae of Chironomidae. At the start of the experiment the fish were divided into 3 groups: the control, and two experimental groups of fish treated with copper (Group 1 and Group 2). Experimental fish were placed in 200 L aquariums with contaminated water with a Cu concentration 2 mg·L-1. The final concentration (2 mg
Cu L-1) was achieved by using CuSO
4 × 5H2O. The fish
were exposed to the contaminated water for 2.5 hours (Group 1) or for 5 hours (Group 2). After the cessation of the exposure, fish were placed again in aquariums with clear municipal water and started their recovery period. The control fish were also transferred to another aquarium with clean water for a period of 5 hours to simulate the stress of the catch and transfer that accompanied the fish exposed to copper. The density of the fish was about 7 individuals (or about 1.5 kg) per 100 L.
Fish were collected for hematology and the analysis of heavy metal accumulation (randomly sampled 8 fish per treatment group) before exposure (basal sampling), immediately after the cessation of exposure (0 hours), 2.5 hours later, and 5, 24, 48, 72, 168 and 336 hours later. Before blood samples were collected, the fish were anesthetized with Propiscin TM IRŚ (2 ml·L-1). Blood samples (about 1 ml) were
RBC was calculated according to the following formula:
RBC = a × b × 4000
a – average amount of erythrocytes in one square b – dilution (200 - fold)
4000 – the transformation of the dilution to 1 mm3 (μl)
WBC was calculated according to the following formula:
WBC = a × b × 250
a – average amount of leucocytes in one square b – dilution (20 - fold)
250 – the transformation of the dilution to 1 mm3
Concentration of Cu and Fe in fish tissues.
All samples were stored at –20°C before the analysis was conducted. The samples underwent mineralization using a mixture of nitric (HNO3— 65%)
and perchloric acid (HClO4—70%) at a 3:1 ratio. After
approximately 20 hours, the samples underwent thermal mineralization using a VELP DK 20/26 unit at a variable temperature ranging between 100 and 180°C for approx. 6 hours. Prior to the analysis, the samples were stored at a temperature of ~4°C. The Cu and Fe concentrations in the tissue samples were measured using an ATI UNICAM 929 atomic absorption spectrometer (AAS). Standard solutions were prepared on the basis of atomic absorption standards from the Office of Weights and Measures in Warsaw. The results were presented as milligrams per kilogram of wet tissue weight (mg·kg-1 w.w.).
Statistical analysis
Hematological parameters and heavy metal concentration data were analyzed using Statistica 10 by one-way analysis of variance (ANOVA). The differences between means were determined using the Student test, in which the significance level was defined as P<0.05. To identify relationships between the duration of the exposure period (2.5 or 5 hours) and hematological parameters and Cu or Fe concentration in the tissues being studied, Pearson’s correlation coefficients were calculated.
Results
WBC, RBC, and HCT Analysis
In the control group, the WBC values ranged between 35.67 (±4.7) × 103 mm-3 and 63.00 (±2.6)×103
mm-3.Therefore, the comparison of the parameters of
the experimental groups to the control was carried out for the respective periods of sampling. In the groups of fish exposed to Cu for 2.5 and 5 hours, the WBC values measured immediately after the exposure were significantly lower than in the controls (48.83±2.6 and 38.83±1.6, respectively). After 24 and 48 hours of
depuration, the values increased again to a level equal to the baseline. No more significant differences between the treatment and control groups were found until the end of the depuration period (Table 1). The decreased WBC in the hours directly following exposure was accompanied by a significant negative correlation coefficient, which confirmed the observable association between the WBC decrease and the duration of exposure to Cu (Table 1).
The RBC in the controls ranged between 1.21 and 1.96×106 mm-3 during the whole depuration period.
The fish exposed to Cu in water had significantly lower RBC values until the end of depuration (336 hours). RBC values in fish of Group 1 and Group 2 were lowering in the range 1.53–0.94×106 mm-3 and 1.39–0.80×106 mm-3
respectively, during the whole recovery period. Negative correlation coefficients confirmed the association between decreased RBC and exposure duration (Table 1).
HCT in the controls ranged between 19.2% (±2.0) and 36.6% (±4.2) during the recovery period. In the groups exposed to Cu, there was a significant increase in HCT, which persisted up to 168 hours of depuration. Positive correlation coefficients confirmed the association between HCT and the duration of exposure to Cu (Table 1).
Analysis of Cu and Fe levels in the Gills
In the controls, the mean Cu concentration in the gills ranged between 0.72 mg·kg-1 and 1.01 mg·kg-1. In
the groups exposed to Cu, a significantly higher Cu concentration was found in the gills immediately after the end of exposure: 9.16 mg·kg-1 (±1.54) and 5.69
mg·kg-1 (±1.14), respectively, in the Group 1and Group
2. In subsequent hours following the end of exposure, there was a gradual decrease in Cu levels, which returned to the control values after 48 hours in the Group 1, and after 168 hours in the Group 2. In the fish exposed to Cu for 2.5 hours, Cu levels decreased to a value significantly lower than that found in the controls after 168 hours of depuration. Pearson’s correlation coefficients did not confirm any association between Cu accumulation in the gills and exposure duration (Table 2).
The mean Fe concentration in the gills fluctuated between 9.89 mg·kg-1 and 12.49 mg·kg-1 in the controls
during the whole recovery period. In the Group 1, Fe levels changed from 19.23 mg·kg-1 (±1.44) immediately
after exposure, to 6.57 mg·kg-1 (±0.21) after 72 hours of
depuration. In the Group 2, the gill Fe concentration was 18.06 mg·kg-1 (±0.39) immediately after exposure,
and then decreased, reaching the minimum of 4.76 mg kg-1 (±0.37) after 72 hours of depuration. After 168
groups and the control group (Table 3). Statistically significant positive correlation coefficients for Fe and Cu concentrations in the same tissue were found at 0, 48, and 168 hours of depuration for the fish of Group 1, and at 5 hours of depuration in the fish of Group 2.
Analysis of Cu and Fe levels in the Liver
In the controls, the mean Cu concentration in the liver ranged between 1.09 mg·kg-1 and 1.53 mg·kg-1
during the whole recovery period. In the groups exposed to Cu, the hepatic levels of this metal clearly fluctuated. In the Group 1, the highest concentration 3.27 mg·kg-1 (±0.58) was found 2.5 hours after the end
of exposure, while the lowest concentration 1.19 mg·kg-1 (±0.16) occurred immediately after the end of
exposure. In the Group 2, the Cu concentration varied between 1.23 mg·kg-1 (±0.12) after the 2.5 hours
following the end of exposure and 3.8 mg·kg-1 (±1.32)
after 24 hours of depuration. Pearson’s correlation coefficients did not confirm a fixed dependence of Cu
accumulation on exposure duration (Table 2).
The mean Fe concentration in the liver was 149.94 mg·kg-1 in the controls, at the start of the recovery
period. In both groups of fish exposed to Cu, a significant decrease in Fe levels was observed from the end of exposure until 72 hours of depuration; the hepatic Fe levels reached the control level again after 1 week. Pearson’s correlation analysis confirmed a positive association between Fe and Cu concentrations in the liver tissue (Table 3).
Analysis of Cu and Fe levels in Muscle
In the controls, during the whole recovery period the mean Cu concentration in muscle was in the range from 0.30 mg·kg-1 to 0.53 mg·kg-1. In the Group 1, the
concentration increased significantly after the end of exposure: 0.65±0.10 mg·kg-1, and 2.5 hours later: 0.78
mg·kg-1 (±0.09), and subsequently decreased to the
control level. In the Group 2, muscle Cu levels fluctuated during the first 24 hours of depuration,
Table 1. Changes in hematological parameters in Prussian carp Carassius gibelio during 336 hours of depuration period after the exposure to Cu. Pearson’s correlation coefficients indicate relationship of studied blood parameters to the exposure’s duration (2.5 or 5 hours)
Hours of depuration Control Group 1 Group 2 Pearson’s correlation
WBC (103 mm-3) r
basal 64.13±1.16 a 63.21±1.41 a 65.14±1.85 a -
0 63.00±2.61 a 48.83±2.65 b 38.83±1.60 b -0.87***
2.5 54.00±1.37 a 39.00±1.86 b 35.00±1.61 b -0.83***
5 55.67±1.41 a 37.00±1.03 b 43.83±4.96 ab 0.48*
24 47.83±4.21 a 60.33±5.29 a 48.33±4.56 a -0.06
48 35.67±4.67 a 48.17±2.17 b 46.33±2.01 ab -0.40
72 38.50±3.37 a 40.83±0.87 a 39.83±1.56 a -0.03
168 37.50±2.17 a 50.83±5.67 a 42.00±2.77 a -0.25
336 41.78±1.80 a 36.60±1.57 a 37.00±1.62 a 0.32
RBC (106 mm-3)
basal 1.99 ±0.09 a 1.98±0.05 a 1.99±0.11 a -
0 1.85 ±0.17 a 1.53±0.17 a 1.39±0.05 a -0.49*
2.5 1.96±0.11 a 1.39±0.07 ab 1.17±0.06 b -0.72***
5 1.60±0.10 a 1.24±0.04 b 1.33±0.10 ab 0.50*
24 1.41±0.09 a 1.15±0.11 b 1.19±0.11 b 0.23
48 1.21±0.13 a 1.09±0.09 b 1.06±0.08 b -0.24
72 1.31±0.11 ab 1.01±0.03 b 0.83±0.02 b -0.40
168 1.56 ±0.12 a 1.17±0.10 b 0.93±0.07 b -0.30
336 1.63 ±0.06 a 0.94±0.08 b 0.80±0.02 b -0.43*
Hematocrit (%)
basal 34.1 ±1.1 a 33.2±1.2 a 34.9±2.15 a -
0 36.6±4.2 a 45.0±2.3 a 46.6±2.1 a 0.49*
2.5 31.6±3.1 a 45.2±2.2 b 33.3±2.2 a -0.16
5 33.3±3.2 a 40.5±3.5 a 35.8±2.0 a -0.18
24 20.8±2.0 a 34.2±3.3 b 33.3±3.1 b -0.26
48 22.5±1.1 a 27.5±3.1 a 35.1±4.8 a 0.52*
72 30.0±3.9 a 45.8±1.3 b 37.5±1.7 a -0.25
168 19.2±2.0 a 41.7±3.8 b 33.3±2.1 b -0.58*
336 24.4±2.4 a 30.2±3.2a 32.8±3.1 a 0.44*
Letters indicate statistically significant differences (P< 0.05) between groups.
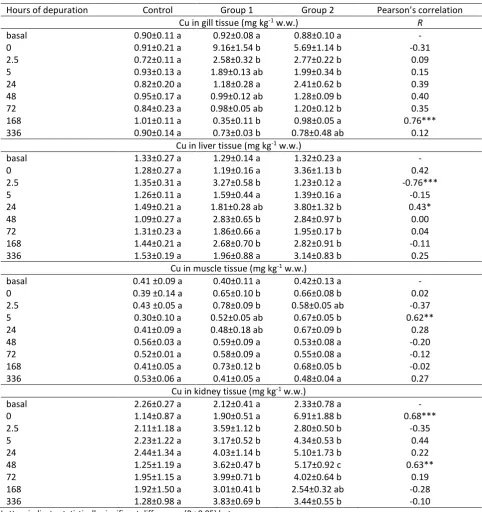
Table 2. Changes in Cu concentration in gills, liver, muscle and kidney during 336 hours of depuration period after the previous exposure to Cu. Pearson’s correlation coefficients indicate relationship of Cu level to the exposure’s duration (2.5 or 5 hours)
Hours of depuration Control Group 1 Group 2 Pearson’s correlation Cu in gill tissue (mg kg-1 w.w.) R
basal 0.90±0.11 a 0.92±0.08 a 0.88±0.10 a -
0 0.91±0.21 a 9.16±1.54 b 5.69±1.14 b -0.31
2.5 0.72±0.11 a 2.58±0.32 b 2.77±0.22 b 0.09
5 0.93±0.13 a 1.89±0.13 ab 1.99±0.34 b 0.15
24 0.82±0.20 a 1.18±0.28 a 2.41±0.62 b 0.39
48 0.95±0.17 a 0.99±0.12 ab 1.28±0.09 b 0.40
72 0.84±0.23 a 0.98±0.05 ab 1.20±0.12 b 0.35
168 1.01±0.11 a 0.35±0.11 b 0.98±0.05 a 0.76***
336 0.90±0.14 a 0.73±0.03 b 0.78±0.48 ab 0.12
Cu in liver tissue (mg kg-1 w.w.)
basal 1.33±0.27 a 1.29±0.14 a 1.32±0.23 a -
0 1.28±0.27 a 1.19±0.16 a 3.36±1.13 b 0.42
2.5 1.35±0.31 a 3.27±0.58 b 1.23±0.12 a -0.76***
5 1.26±0.11 a 1.59±0.44 a 1.39±0.16 a -0.15
24 1.49±0.21 a 1.81±0.28 ab 3.80±1.32 b 0.43*
48 1.09±0.27 a 2.83±0.65 b 2.84±0.97 b 0.00
72 1.31±0.23 a 1.86±0.66 a 1.95±0.17 b 0.04
168 1.44±0.21 a 2.68±0.70 b 2.82±0.91 b -0.11
336 1.53±0.19 a 1.96±0.88 a 3.14±0.83 b 0.25
Cu in muscle tissue (mg kg-1 w.w.)
basal 0.41 ±0.09 a 0.40±0.11 a 0.42±0.13 a -
0 0.39 ±0.14 a 0.65±0.10 b 0.66±0.08 b 0.02
2.5 0.43 ±0.05 a 0.78±0.09 b 0.58±0.05 ab -0.37
5 0.30±0.10 a 0.52±0.05 ab 0.67±0.05 b 0.62**
24 0.41±0.09 a 0.48±0.18 ab 0.67±0.09 b 0.28
48 0.56±0.03 a 0.59±0.09 a 0.53±0.08 a -0.20
72 0.52±0.01 a 0.58±0.09 a 0.55±0.08 a -0.12
168 0.41±0.05 a 0.73±0.12 b 0.68±0.05 b -0.02
336 0.53±0.06 a 0.41±0.05 a 0.48±0.04 a 0.27
Cu in kidney tissue (mg kg-1 w.w.)
basal 2.26±0.27 a 2.12±0.41 a 2.33±0.78 a -
0 1.14±0.87 a 1.90±0.51 a 6.91±1.88 b 0.68***
2.5 2.11±1.18 a 3.59±1.12 b 2.80±0.50 b -0.35
5 2.23±1.22 a 3.17±0.52 b 4.34±0.53 b 0.44
24 2.44±1.34 a 4.03±1.14 b 5.10±1.73 b 0.22
48 1.25±1.19 a 3.62±0.47 b 5.17±0.92 c 0.63**
72 1.95±1.15 a 3.99±0.71 b 4.02±0.64 b 0.19
168 1.92±1.50 a 3.01±0.41 b 2.54±0.32 ab -0.28
336 1.28±0.98 a 3.83±0.69 b 3.44±0.55 b -0.10
Letters indicate statistically significant differences (P< 0.05) between groups.
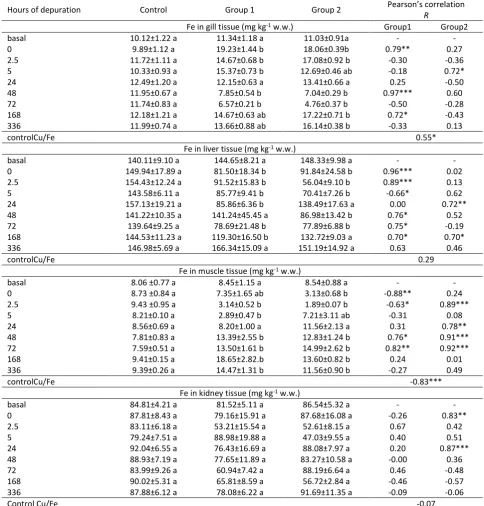
Table 3. Changes in Fe concentration in gills, liver, muscle and kidney during 336 hours of depuration period after the previous exposure to Cu. Pearson’s correlation coefficients indicate relationship of Fe to Cu level in studied tissue of respective exposure group (2.5 or 5 hours)
Hours of depuration Control Group 1 Group 2 Pearson’s correlation
R
Fe in gill tissue (mg kg-1 w.w.) Group1 Group2
basal 10.12±1.22 a 11.34±1.18 a 11.03±0.91a - -
0 9.89±1.12 a 19.23±1.44 b 18.06±0.39b 0.79** 0.27
2.5 11.72±1.11 a 14.67±0.68 b 17.08±0.92 b -0.30 -0.36
5 10.33±0.93 a 15.37±0.73 b 12.69±0.46 ab -0.18 0.72*
24 12.49±1.20 a 12.15±0.63 a 13.41±0.66 a 0.25 -0.50
48 11.95±0.67 a 7.85±0.54 b 7.04±0.29 b 0.97*** 0.60
72 11.74±0.83 a 6.57±0.21 b 4.76±0.37 b -0.50 -0.28
168 12.18±1.21 a 14.67±0.63 ab 17.22±0.71 b 0.72* -0.43
336 11.99±0.74 a 13.66±0.88 ab 16.14±0.38 b -0.33 0.13
controlCu/Fe 0.55*
Fe in liver tissue (mg kg-1 w.w.)
basal 140.11±9.10 a 144.65±8.21 a 148.33±9.98 a - -
0 149.94±17.89 a 81.50±18.34 b 91.84±24.58 b 0.96*** 0.02
2.5 154.43±12.24 a 91.52±15.83 b 56.04±9.10 b 0.89*** 0.13
5 143.58±6.11 a 85.77±9.41 b 70.41±7.26 b -0.66* 0.62
24 157.13±19.21 a 85.86±6.36 b 138.49±17.63 a 0.00 0.72**
48 141.22±10.35 a 141.24±45.45 a 86.98±13.42 b 0.76* 0.52
72 139.64±9.25 a 78.69±21.48 b 77.89±6.88 b 0.75* -0.19
168 144.53±11.23 a 119.30±16.50 b 132.72±9.03 a 0.70* 0.70*
336 146.98±5.69 a 166.34±15.09 a 151.19±14.92 a 0.63 0.46
controlCu/Fe 0.29
Fe in muscle tissue (mg kg-1 w.w.)
basal 8.06 ±0.77 a 8.45±1.15 a 8.54±0.88 a - -
0 8.73 ±0.84 a 7.35±1.65 ab 3.13±0.68 b -0.88** 0.24
2.5 9.43 ±0.95 a 3.14±0.52 b 1.89±0.07 b -0.63* 0.89***
5 8.21±0.10 a 2.89±0.47 b 7.21±3.11 ab -0.31 0.08
24 8.56±0.69 a 8.20±1.00 a 11.56±2.13 a 0.31 0.78**
48 7.81±0.83 a 13.39±2.55 b 12.83±1.24 b 0.76* 0.91***
72 7.59±0.51 a 13.50±1.61 b 14.99±2.62 b 0.82** 0.92***
168 9.41±0.15 a 18.65±2.82.b 13.60±0.82 b 0.24 0.01
336 9.39±0.26 a 14.47±1.31 b 11.56±0.90 b -0.27 0.49
controlCu/Fe -0.83***
Fe in kidney tissue (mg kg-1 w.w.)
basal 84.81±4.21 a 81.52±5.11 a 86.54±5.32 a - -
0 87.81±8.43 a 79.16±15.91 a 87.68±16.08 a -0.26 0.83**
2.5 83.11±6.18 a 53.21±15.54 a 52.61±8.15 a 0.67 0.42
5 79.24±7.51 a 88.98±19.88 a 47.03±9.55 a 0.40 0.51
24 92.04±6.55 a 76.43±16.69 a 88.08±7.97 a 0.20 0.87***
48 88.93±7.19 a 77.65±11.89 a 83.27±10.58 a -0.00 0.36
72 83.99±9.26 a 60.94±7.42 a 88.19±6.64 a 0.46 -0.48
168 90.02±5.31 a 65.81±8.59 a 56.72±2.84 a -0.46 -0.57
336 87.88±6.12 a 78.08±6.22 a 91.69±11.35 a -0.09 -0.06
Control Cu/Fe -0.07
Letters indicate statistically significant differences (P< 0.05) between groups.
significantly exceeding the control level, and decreased at the end of depuration. Interestingly, after 168 hours of depuration (1 week after the end of exposure), there was a sharp, transient spike in muscle Cu levels, in both the Group 1 and Group 2 fish. The Cu levels in the muscle tissue of fish exposed to Cu were not dependent on exposure duration (Table 3).
The mean Fe concentration in muscle ranged between 7.59 mg·kg-1 and 9.43 mg·kg-1 in the controls.
In the groups exposed to Cu, a significant decrease in Fe levels in muscle was found (down to 2.89 mg·kg-1
(±0.47) in the Group 1, and 1.89 mg·kg-1 (±0.07) in the
Group 2), which persisted through the first 24 hours of depuration. Subsequently, the Fe levels in these groups rose to the control values, and then a significant increase was found that lasted until the end of follow-up at 336 hours. Highly significant correlation coefficients confirmed the positive association between Fe and Cu concentrations in the muscle tissue of the fish. The correlation between Cu and Fe levels was also significant in the controls (r = –0.83) (Table 3).
Analysis of Cu and Fe levels in the kidney:
In the controls, the mean Cu concentration in the kidney fluctuated between 1.14 mg·kg-1 and 2.44
mg·kg-1. In the experimental groups, both Group 1 and
Group 2, the kidney concentration of Cu was significantly higher than in the controls, and this persisted until the end of the follow-up. Pearson’s correlation coefficients did not indicate a fixed dependence of Cu levels on exposure duration — statistically significant coefficients were only found at 0 and 48 hours after the end of exposure (Table 2).
The mean Fe concentration in the kidney was in the range from 79.24 mg·kg-1 to 92.04 mg kg-1 in
controls. In the experimental groups, the kidney levels of Fe did not differ significantly from the control values, with one exception: in the group exposed to Cu for 5 hours, the Fe levels in the kidney were significantly lower than in the controls after 5 hours of depuration. Correlation coefficients did not confirm a fixed association between Fe and Cu levels in the kidney during depuration (Table 3).
Discussion
Sometimes the values of hematological parameters of intoxicated fish fluctuate, and their changes are not always directly related to metal concentrations and time of exposure or time post-exposure (Witeska, Lugowska, & Kondera, 2016). These fluctuations may result from the translocation of toxic elements within the organism, and their toxic action on various functions at different times. In our case, it is likely that copper affects not only circulating blood cells, but also newly developing ones in hematopoietic tissue (Kondera & Witeska, 2013). The significant change in WBC, found directly following exposure to Cu, clearly indicates that exposure to Cu has a clear
impact on fish. This only lasts through the first 24 hours of depuration, which is also when significant correlation coefficients are found that confirm the association between the observed WBC decrease and exposure duration (Table 1). As reported by Svobodova et al. (1994), excessive Cu levels can cause leukopenia. This is corroborated by Som, Kundu, Bhattacharyya, and Homechaudhuri (2009), who studied lethal concentrations of Cu (100% 72h LC50 – 50 mg·dm-3 Cu)
in roho labeo Labeo rohita, and observed an initial drop in leukocyte count, followed by an increase. In an experiment by Ajani and Akpoilih (2010), a dietary intake of 1000 mg Cu kg-1 in common carp Cyprinus
carpio produced an increase in leukocyte count from 1.38 to 1.63·103 mm-3 and a decrease in lymphocyte
count (from 69% to 64%). Azarin, Imanpour, and Rajabpour (2012) exposed kutum Rutilus frisiikutum to various Cu doses in water, demonstrating that WBC increased at lower doses (0.004 and 0.04 mg Cu L-1),
but not at the highest dose – 0.4 mg Cu L-1. This
variation is likely due to differences between fish species in terms of the immune system’s sensitivity to heavy metals (Dunier, 1996).
In the present study, a consistent decrease in erythrocyte count was also found following 2.5-hours and 5-hours exposure of female Prussian carp to Cu in water. A significantly lower RBC was first observed 2.5 hours after exposure, and the value continued to decrease throughout the depuration period, until 336 hours, when it reached 0.94 and 0.80 103 mm-3,
respectively, in the two experimental groups (Table 1). This could have been the result of hemolysis, preceded by multiple structural deformations in the erythrocytes, such as amitosis, nuclear anomalies, swelling, and cytoplasmic vacuolation, which has also been found in a number of other studies (Karuppasamy, Subathra, & Puvaneswari, 2005; Witeska, et al. 2010; Witeska, Kondera, & Szczygielska, 2011). Cu toxicity on a cellular level also involves a dysfunction in the sodium– potassium pump (Blanchard & Grosell, 2006), which considerably accelerates hemolysis. Hemolysis triggered by Cu has also been observed by Vosyliene, (1996). RBC also depends on a number of other internal and external factors, including activity, age, sex, water temperature, and O2 content (Witeska et al., 2016).
Kondera and Witeska, (2013), studying fish after short-term exposure to Cu, did not find a decreased number of RBC, but instead reported an increased count of immature erythrocytes, which indicates the accelerated release of red blood cells from hematopoietic tissue, compensating for the losses caused by the toxicant (Witeska et al., 2010). Ajani and Akpoilih (2010) fed Cyprinus carpio with a feed comprising 1000 mg Cu kg-1, finding both an increased
study, a decrease persisted for 2 weeks after short-term exposure to a dose of 2 mg Cu L-1. Negative
correlation coefficients confirmed the stronger impact of Cu with 5-hour exposure. Anemia is an early manifestation of acute and chronic heavy metal toxicity. The significance of these changes may be understood in terms of reduced oxygen consumption in fish, resulting in death due to heavy metal pollution (Azarin et al., 2012).
An analysis of HCT showed an increase during depuration in the experimental groups compared to the controls. In their study, Ajani and Akpoilih (2010) also found an initial increase in HCT, attributed to the stress reaction triggered by the toxicant. Adrenalin causes the spleen to contract, releasing erythrocytes into the bloodstream, and thus increasing HCT (Vosyliene, 1999). According to Svobodova et al., (1994), high concentrations of heavy metals or long-term exposure causes HCT decrease, which contributes to worse health and anemia in fish. HCT decreases mainly occur with blood loss (Witeska, 2015), which may indicate the occurrence of internal and external bleeding during exposure and depuration, or a lower blood cell production rate. Increased HCT may also result from increased erythrocyte volume, which might explain the lack of association between RBC and HCT observed in the present study. Copper caused hematological alterations in the Prussian carp studied, which depended on exposure duration. Therefore, any extension of acute exposure may aggravate the body’s response. Depending on the degree of intoxication, the organism may respond with an increase (erythropoiesis, leukocytosis) or a decrease (anemia, leukopenia) in the basic hematological parameters. The exposure in the present study caused a decrease in RBC and WBC number and an increase in HCT values.
The gills are the primary route for Cu uptake in fish due to their direct exposure to toxicants in water (Jayakumar & Paul, 2006). In Prussian carp, Cu accumulated in gills in concentration-dependent manner, reaching almost a 10-fold increase after 2.5 hours and a 6-fold increase after 5 hours' exposure. This finding seems reasonable, as the gills are the route by which the element penetrates into the body, and therefore were the most exposed. Interestingly, the Group 1 exposed to Cu for a shorter time, 2.5 hours, accumulated 9.16 ±0.54 mg Cu kg-1, while the Group 2
exposed for 5 hours only accumulated 5.69±1.14. It is well established that the body responds in a defensive manner to the presence of toxicants, and with a low concentration of metal, the amount removed from the body may exceed the amount that is being absorbed, which indicates that in this case, copper elimination from the gills may have begun even before the end of exposure. Turnlund et al., (1998) indicated that excretion of copper in bile may be even more important than absorption in regulating total body level of copper. From the end of exposure, effective
elimination of copper was observed, whereby tissue was gradually cleansed of the accumulated metal. After three days of exposure to 50 μg Cu L-1, Eyckmans,
Lardon, Wood, and De Boeck, (2013) observed increases in Cu levels in the gills compared to the controls: 1.5-fold in rainbow trout Oncorhynchus mykiss, 1.9-fold in Cyprinus carpio, and 1.4-fold in Carassius gibelio. De Boeck, Meeus, De Coen, and Blust, (2004) experimented with 10 days of exposure to a dose of 63 μg Cu L-1, and found 9-fold increase the Cu
level in the gills. Ay, Kalay, Tamer, and Canli, (1999), exposing redbelly tilapia Tilapia zillii for two weeks to doses of 1, 2 and 4 mg Cu L-1, found a 10-fold increase
in Cu levels compared to the controls, which is similar to the present findings, though the exposure duration was much longer. The cited reports confirm the association between Cu accumulation and exposure duration. This, however, most likely concerns chronic exposure only, as in the present study, the correlation was negative immediately after the end of acute intoxication.
Cu levels in the muscles of the Prussian carp studied were the lowest out of all the tissues analyzed, and ranged between 0.40 mg·kg-1 and 0.78 mg·kg-1
(Table 2). Similar Cu levels were also reported by: Drąg-Kozak, Łuszczek-Trojnar, and Popek, (2011) in Oncorhynchus mykiss or Łuszczek – Trojnar, Drąg-Kozak, and Popek, (2011) in Cyprinus carpio. Despite the low concentrations, statistically significant differences from controls were found, especially at the initial stage of depuration. Increased Cu levels were also found to persist in the muscles until the end of depuration (Table 2).
Cu metabolism is controlled mainly by the liver. The liver not only tends to accumulate Cu from the environment, but also plays an important role in Cu homeostasis (Grosell, Hogstrand, & Wood, 1997). The mean liver Cu levels in both groups of fish exposed to the metal were twice as high as in controls, ranging between 1.2 and 3.8 mg·kg-1, and varying throughout
the 336-hour depuration period (Table 2). Das and Gupta, (2013), studying flying barb Esomus danrica after 28 days of exposure to a dose of 0.005 µg·L-1,
observed Cu concentrations that were 10 times higher than in the controls. Ay et al., (1999), after exposing Tilapia zillii to 1, 2, and 4 mg Cu L-1 for two weeks,
found a 7-fold increase in the hepatic levels of this metal. Łuszczek-Trojnar, Sionkowski, Drąg-Kozak, & Popek, (2016) showed a Cu accumulation in the liver of common carp at a level of 205 mg·kg-1, or 62 times
higher than in the controls, during 30-month exposure to feed containing 153 mg Cu kg-1. It is well known that
the present study, Cu accumulated in the gills was gradually eliminated in the depuration period, while Cu accumulated in the liver remained at a high concentration until the end of the 336-hour follow-up period (Table 2). Despite the cessation of exposure, the copper absorbed in the body remained in the liver for 2 weeks, confirming the utility of this tissue as a bioindicator for Cu contamination. Cu in the blood, circulating through the body, could undergo secondary accumulation in various tissues, such as muscle or liver tissue. Kidney Cu levels also remained high until the end of depuration. As an excretory organ, the kidneys were involved in the ongoing elimination of the metal. Maiti and Banerjee (2012) demonstrated that Cu remained in the liver at an increased level even after 6 months, whereas all other tissues had been purified by that time. According to Kondera and Witeska, (2013), Cu has a high affinity to the pronephros of Cyprinus carpio. Kim, Jang, Lee, & Kim, (2011) studied Cu accumulation and elimination in various tissues of the olive flounder Paralichthys olivaceus during a 30-day exposure period and a 20-day depuration period, finding that effective Cu elimination only occurred in the gut, while Cu levels in the gills, kidney and muscles did not decrease. In the liver, Cu elimination was dose-dependent. The observations made in the present study during depuration following acute intoxication are different, as Cu elimination from the gills was very quick, and out of all the tissues studied, only the kidney maintained a high Cu level throughout the 336 hours of observation (Table 2). Metal accumulation during short-term contamination has an entirely different mechanism to chronic exposure, and its effects are reversed much faster.
The analysis of Fe levels in the gills of Prussian carp showed a wide variation during the depuration period. After the end of exposure, the Fe levels in the gills of exposed fish (19.23±1.44 and 18.06±0.39 mg·kg -1) were significantly higher than in controls (9.89±1.12
mg kg-1), then after 48 hours, the levels decreased
significantly (7.85±0.54 and 7.04±0.29 mg·kg-1), and
they returned to values significantly exceeding control levels after 168 hours of depuration (Table 3). Interestingly, the observed fluctuations in gill Fe levels were consistent with the findings in other tissues as well. In the liver, after the end of exposure, Fe levels were significantly lower than in the controls. It was interesting to observe a sharp increase in Fe concentration in the liver after 48 hours in the first group and after 24 hours in the second group, and then a decrease. Perhaps after anemia, the liver gave up its iron supply for the production of new blood cells. Only after a full week of depuration did they return to the control levels. In the muscles, Fe levels at the end of exposure were also significantly lower, then returned to the control levels after 24 hours, and significantly increased after 48 hours, remaining at this level until the end of observation (Table 3). The likely source of Fe
in the muscles was the blood transporting oxygen into muscle cells. Stress due to exposure may have affected hematopoiesis in a way causing an immediate drop in blood Fe, as reflected in the low levels of Fe in the muscles after exposure. This is confirmed by RBC analysis results, showing a lower count after exposure (Table 1). During depuration, large amounts of Cu were used for erythrocyte replenishment, which may have contributed to the restoration of Fe levels in the muscles, as well as to the observed change in HCT (Table 1). Javed and Saeed (2010) analyzed gill and kidney concentrations of Fe in catla Catla catla, Labeo rohita, and mrigal carp Cirrhina mrigala, reporting Fe concentrations that were 6- and 1.5 times higher than those found in the present paper.
In the present study, heavy metal concentration profiles differed between the tissues. For Cu, it was as follows: gills > kidneys > liver > muscle, while for Fe, the descending sequence was: liver > kidneys > gills > muscle. Heavy metal accumulation mainly occurs in soft tissue, including the kidneys, gills, spleen and liver. The different dynamics of Cu and Fe levels in the tissues studied result from differences in the mode of transport, accumulation and depuration of the two elements, which was also reported by Kondera and Witeska, (2013). It should be noted that the bioaccumulation of heavy metals in fish tissues mainly depends on exposure duration and the dose of the toxicant applied. However, to summarize the present study, it can be concluded that even a relatively short exposure to Cu is reflected in a change in normal morphological parameters and microelement metabolism in the tissue, and its effects can be observed for as long as 2 weeks following the end of exposure. The significant correlation coefficients found in the analysis confirm that copper accumulation and elimination depend on exposure time. Potentially, this means that any shortening of acute exposure may contribute to quicker restoration of homeostasis during depuration with regard to the blood parameters and microelement levels studied.
Acknowledgments
This work was supported by the Ministry of Science and Higher Education of the Republic of Poland project no. DS 3202/KIiR. The research project was approved by the Local Ethics Commission.
References
Ajani, E.K., & Akpoilih, B.U. (2010). Effect of chronic dietary copper exposure on haematology and histology of common carp (Cyprinus carpio L.). Journal of Applied Sciences and Environmental Management, 14, 39–45. http://dx.doi.org/10.4314/jasem_v14i4_63254
activity. Bulletin of Environmental Contamination and Toxicology, 62, 160-168.
Azarin, H., Imanpour, M.R., & Rajabpour, M. (2012). Effect of sublethal levels of copper sulfate on some hematological parameters of Rutilus frisii kutum
fingerlings. Global Veterinaria, 9(4), 479-485.
Blaxhall, P.C. (1981). A comparison of methods used for the separation of fish lymphocytes. Journal of Fish Biology, 18(2), 177-181. http://dx.doi.org/10.1111/j.1095-8649_1981_tb02812_x
Blaxhall, P.C., & Daisley K.W. (1973). Routine haematological methods for use with fish blood. Journal of Fish Biology, 5, 771-781. http://dx.doi.org/10.1111/j.1095-8649_1973_tb04510_x
Blanchard, J., & Grosell M. (2006). Copper toxicity across salinities from freshwater to seawater in the euryhaline fish Fundulus heteroclitus: Is copper an ionoregulatory toxicant in high salinities? Aquatic Toxicology, 80, 131– 139. http://dx.doi.org/10.1016/j.aquatox_2006_08_001 Bost, M., Houdart, S., Oberli, M, Kalonji, E., Huneau, J.F., & Margaritis, I. (2016). Dietary copper and human health: Current evidence and unresolved issues. Journal of Trace Elements in Medical Biology, 35, 107-115. http://dx.doi.org/10.1016/j.jtemb_2016_02_006. Bozhkov, A., Padalko, V., Dlubovskaya, V., & Menzianova, N.
(2010). Resistance to heavy metal toxicity in organisms under chronic exposure. Indian Journal of Experimental Biology, 48(7), 679-696.
http://nopr.niscair.res.in/handle/123456789/9736 Ciftci, N., Cicik, B., Erdem, C., & Ay, O. (2008). Effects of lead
concentrations on sera parameters and hematocrit levels in Anguilla anguilla (Linnaeus, 1758). Journal of Fisheries Science, 2, 616–622. http://dx.doi.org/10.3153/jfscom_2008_02_5
Das, S., & Gupta, A. (2013). Accumulation of copper in different tissues and changes in oxygen consumption rate in Indian flying barb, Esomus danricus (Hamilton-Buchanan) exposed to sub-lethal concentrations of copper. Jordan Journal of Biological Sciences, 6, 21–24. http://dx.doi.org/10.12816/0000254
De Boeck, G., Meeus, W., De Coen, W., & Blust, R. (2004). Tissue-specific Cu bioaccumulation patterns and differences in sensitivity to waterborne Cu in three freshwater fish: rainbow trout (Oncorhynchus mykiss), common carp (Cyprinus carpio), and gibel carp (Carassius auratus gibelio). Aquatic Toxicology, 70, 179-188.
http://dx.doi.org/ 10.1016/j.aquatox_2004_07_001. Drąg-Kozak, E., Łuszczek-Trojnar, E., & Popek, W. (2011).
Heavy metals in some tissues and organs of rainbow trout (Oncorhynchus mykiss) fish species in relation to age and season. Ochrona Środowiska i Zasobów
Naturalnych, 48, 161-169. [In Polish]
Dunier M. (1996). Water pollution and immunosuppresion of freshwater fish. Italian Journal of Zoology, 63(4), 303-309. https://doi.org/10.1080/11250009609356150 Eyckmans, M., Lardon, I., Wood, C.M., & De Boeck, G. (2013).
Physiological effects of waterborne lead exposure in spiny dogfish (Squalus acanthias). Aquatic Toxicology, 126, 373–381.
http://dx.doi.org/10.1016/j.aquatox_2012_09_004 Gheorghe, S., Stoica, C., Vasile, G.G., Nita-Lazar, M., Stanescu,
E., & Lucaciu, I.E. (2017). Metals toxic effects in aquatic ecosystems: Modulators of water quality. In:Hlanganani Tutu (Ed.), Water quality (pp. 60-89)
http://dx.doi.org/10.5772/65744
Grosell, M.H., Hogstrand, C., & Wood, C.M. (1997). Cu uptake and turnover in both Cu-acclimated and non-acclimated rainbow trout (Oncorhynchus mykiss). Aquatic Toxicology, 38, 257–276.
http://dx.doi.org/10.1016/S0166-445X(96)00843_0 Gupta, Y.R., Sellegounder, D., Kannan, M., Deepa, S.,
Senthilkumaran, B., & Basavaraju, Y. (2016). Effect of copper nanoparticles exposure in the physiology of the common carp (Cyprinus carpio): biochemical, histological and proteomic approaches Aquaculture and Fisheries, 1, 15-23.
http://dx.doi.org/10.1016/j.aaf_2016_09_003
Hauser-Davis, R.A., Gonçalves, R.A., Ziolli, R.L., & de Campos, R.C. (2012). A novel report of metallothioneins in fish bile: SDS-PAGE analysis, spectrophotometry quantification and metal speciation characterization by liquid chromatography coupled to ICP-MS. Aquatic Toxicology, 116-117, 54–60.
http://dx.doi.org/10.1016/j.aquatox_2012_03_003 Heath, A.G. (1995). Water pollution and fish physiology: A
Novel Study. Boca Ration, Florida, USA. CRC Press., 384 pp.
Javed, M., & Saeed, M.A. (2010). Growth and bioaccumulation of iron in the body organs of Catla catla, Labeo rohita and Cirrhina mrigala during chronic exposures. International Journal of Agriculture and Biology, 12(6), 881-886.
Jayakumar, P., & Paul, V.I. (2006). Patterns of cadmium accumulation in selected tissues of the catfish Clarias batrachus (Linn.) exposed to sublethal concentration of cadmium chloride. Veterinarski Arhiv, 76, 167-177. Jezierska, B., & Witeska, M. (2001). Metal toxicity to fish: A
Novel Study. Siedlce. Poland. Wydawnictwo Akademii Podlaskiej, 318 pp.
Journal of Laws. (2002). The requirements of inland waters that are the habitat of fish in natural conditions. Regulation of the Minister of the Environment No 176, item 1455. Accessed 4 October 2002 [In Polish] Journal of Laws. (2016). Classification of homogeneous
surface water bodies and of environmental quality standards for priority substances. Regulation of the Minister of the Environment item 1187. Accessed 5 August 2016 [in Polish]
Karayakal, F., Cicik, B., Ciftci, N., Karaytug, S., Erdem, C., & Ozcan A.Y. (2010). Accumulation of copper in liver, gill and muscle tissues of Anguilla anguilla (Linnaeus, 1758). Journal of Animal and Veterinary Advances, 9, 2271–2274.
Karuppasamy, R., Subathra, S., & Puvaneswari, S. (2005). Haematological responses to exposure to sublethal of cadmium in air-breathing fish Channa punctatus
(Bloch). Journal of Environmental Biology, 26(1), 123– 128.
Kim, S.G., Jang, S.W., Lee, Y.J., & Kim, S.S. (2011). Cu accumulation and elimination in the tissues of the olive flounder Paralichthys olivaceus. Fisheries and Aquatic Sciences, 14, 210–217. http://dx.doi.org/10.5657/FAS_2011_02_10
Kondera, E., & Witeska, M. (2013). Cadmium and copper reduce hematopoietic potential in common carp (Cyprinus carpio L.) head kidney. Fish Physiology and Biochemistry, 39(4), 755-764.
http://dx.doi.org/10.1007/s10695-012-9738-6
biochemistry and molecular biology. American Journal of Clinical Nutrition, 63, 797S–811S.
Łuszczek – Trojnar, E., Drąg-Kozak, E., & Popek, W. (2011). Bioaccumulation of heavy metals in common carp (Cyprinus carpio L.) from breeding ponds supplied with the Rudawa river. Ochrona Środowiska i Zasobów
Naturalnych, 47, 112-120. [In Polish]
Łuszczek-Trojnar, E., Sionkowski, J., Drąg-Kozak, E., & Popek, W. (2016). Copper and lead accumulation in common carp females during long-term dietary exposure to these metals in pond conditions. Aquaculture Research,
47(7), 2334–2348.
http://dx.doi.org/10.1111/are_12689
Maiti, P., & Banerjee, S. (2012). Fate of metals in fish under variable sewage input in fish ponds. International Journal of Scientific and Research Publications, 2(6), 1– 13.
Rauf, A., Javed, M., & Ubaidullah, M. (2009). Heavy metal levels in three major carps (Catla catla, Labeo rohita
and Cirrhina mrigala) from the river Ravi, Pakistan.
Pakistan Veterinary Journal, 29, 24–26.
Şeker, S., & Kutlu, B. (2014). Determination of copper (Cu) levels for rivers in Tunceli, Turkey. World Environment,
4 (4), 168-171.
http://dx.doi.org/10.5923/j.env.2014.04.04.02. Som, M., Kundu, N., Bhattacharyya, S., & Homechaudhuri, S.
(2009). Evaluation of hemopoietic responses in Labeo rohita Hamilton following acute copper toxicity.
Toxicological and Environmental Chemistry, 91(1), 87-98, http://dx.doi.org/10.1080/02772240801990700. Svobodova, Z.B., Vykusova, B., & Machova, J. (1994). The
effects of pollutants on selected haematological and biochemical parameters in fish. In: R. Muller & R. Lloyd (Eds.), Sublethal and chronic effects of pollutants on
freshwater fish (pp 39–52). New York, USA, FAO Blackwell Science, 371 pp.
Turnlund, J.R., Keyes, W.R., Peiffer, G.L., & Scott, K.C. (1998). Copper absorption, excretion and retention by young men consuming low dietary copper determined by using the stable isotope 65Cu. American Journal of Clinical Nutrition, 67, 1219–1225. http://dx.doi.org /10.1093/ajcn/67_6_1219
Yuvanatemiya, V., & Boyd, C.E. 2006. Physical and chemical changes in aquaculture pond bottom soil resulting from sediment removal. Aquaculture Engineering, 35(2), 199-205.
http://dx.doi.org/10.1016/j.aquaeng_2006_02_001 Vosyliene, M.N. (1996). The effect of long-term exposure to
copper on physiological parameters of rainbow trout (Oncorhynchus mykiss). 2. Studies of hematological parameters. Ekologija, 1, 3-6.
Witeska, M. (2015). Anemia in teleost fishes. Bulletin of the European Association of Fish Patologists, 35(4), 148-160.
Witeska, M., Kondera, E., Lipionoga, J., & Jastrzębska, A. (2010). Changes in oxygen consumption rate and red blood parameters in common carp Cyprinus carpio L after acute copper and cadmium exposures. Fresenius Environmental Bulletin, 19, 115–122.
Witeska, M., Kondera, E., & Szczygielska, K. (2011). The effects of cadmium on common carp erythrocyte morphology. Polish Journal of Enviromental Studies, 20(3), 783-788.
Witeska, M., Lugowska, K., & Kondera, E. (2016). Reference values of hematological parameters for juvenile