ISSN: 2333-6064 (Print), 2333-6072 (Online) Copyright © The Author(s). 2014. All Rights Reserved. Published by American Research Institute for Policy Development DOI: 10.15640/jfbm.v2n3-4a3 URL: http://dx.doi.org/10.15640/jfbm.v2n3-4a3
Empirical Investigation of the Interactions between Firm Size and Firm’s Financial Performance: A Study Based on Brewery Sector of Nigeria
Oliver Ike Inyiama1 & Chukwuani Victoria. N2
Abstract
The aim of the study was to evaluate the extent to which Earnings Per Share is influenced by the level of fixed assets maintained by brewery firms in the Nigeria brewery industry. It sought to determine the significance and nature of the interactions between firm size and financial performance in Nigeria brewery industry from 2000 to 2013. The Engle and Granger 2-step cointegration approach, in a simple regression framework, was adopted in the data analysis with a model to estimate the error correction period. The time series data were tested for stationarity to avoid spurious regression, applying the Augmented Dickey Fuller (ADF) procedure. The test revealed that the study variables were integrated of the same order I(2), indicating a possible cointegration. Firm Size has both short and long term positive effect on EPS; with a significant long run influence. There is no causality running from either EPS to Total Assets or otherwise at both periods. The implication is that firm size does not granger cause EPS and vice versa in Nigeria brewery industry. The study further reveals that the distortions affecting EPS, resulting from firm size, in the long run, could be corrected in approximately six (6) months. Consequently, to improve on financial performance, the firms within the industry should strive to fully automate their production lines, thereby increasing their asset base, in order to enhance product quality and packaging, meet the demands of customers at short notice, remain relevant amidst stern competition in the industry and avoid stock out costs.
Keywords: Total Assets, Earnings, Brewery, Cointegration, Correlations, Causality
1
Department of Accountancy, Enugu State University of Science and Technology, Enugu State, Nigeria. Email: inyiamaik@yahoo.com
2
1.0 Introduction
The nature of production processes in the brewery industry demands a heavy fixed asset base. This is because they have a complex production process that requires the installation of machineries, plants, equipment and sometimes complete automation of the production line. Process cost accounting in the brewery industry reveals the peculiar nature of its accounting system that facilitates the determination of its financial performance. The financial performance of firms within the industry is influenced by a number of factors. Chandrapala and Knapkova (2013) stated that even though all firms operate in the same industry and interact with same external variables, their financial performances are not the same as a number of internal factors could be responsible for firm performance such as firm size, age, debt ratio, quick ratio, inventory level, sales growth physical capital intensity and capital turnover as suggested by Pavelkova and Knápková (2009).
Yegon, Mouni and Wanjau (2014) citing Kamar, Rajan and Zingales (2001) suggested that what determines a firm size is the ownership of physical assets which are critical resources. The neoclassical theory of firm size supported by Lucas (1978) also looked at the firm size in terms of per capita capital in form of investment return and research and development. Pervan and Višić (2012) emphasized on the conceptual framework that advocates a negative relationship between firm size and profitability which is noted in the alternative theories of the firm. The theory, as stated, suggests that large firms come under the control of managers pursuing self-interested goals and therefore profit maximization as the firm’s objective function which may be replaced by managerial utility maximization function. Akbas and Karaduman (2012) citing Athanasoglou, Brissimis and Delis (2008) claimed that size could impact the profitability negatively, for firms that become extremely large due to bureaucratic and other reasons.
This study, therefore, aims at examining the interactions between firm size and financial performance of selected firms in the Nigeria brewery sector; considering the contribution of the sector to national economy. The remaining part of the paper is arranged into four sections. Section 2, x-rays the existing related literature, section 3 documents the methodology for data analysis, section 4 discusses the empirical results while section 5 summarizes and concludes.
2.0 Review of Related Literature
Pavelkova and Knápková (2009) posits that when a firm becomes larger, it enjoys economics of scale and its average cost of production is lower and operational activities are more efficient. Yang and Chen (2009) opines that large firms face less difficulty in getting access to credit facilities from financial institutions for investment, have broader pools of qualified human capital, and may achieve greater strategic diversification. Akbas and Karaduman (2012) while citing Hardwick (1997), stated that larger firms have some advantages such as greater possibility of taking advantage of scale of economies which can enable more efficient production, a greater bargaining power over both suppliers and distributors or clients, exploiting experience curve effects and setting prices above the competitive level. While citing Weiner and Mahoney (1981), Ravenscraft and Scherer (1987), Akbas and Karaduman (2012) also argued that larger firms are more stable and mature and they can generate greater sales because of the greater production capacity and finally, those firms have the chance of capital cost savings with the economies of scale.
The understanding of the relationship between firm size and performance was advanced by Symeou (2012) when he examined whether firms enjoying higher growth potential are better performers, arguing that small economy size could contain firm growth potential and by extension firm performance. Controlling for the effects of competition, firm governance structure, and institutional risk, inter alia, the findings suggest that firm growth potential is not necessarily a limiting factor as both firms in small and large economies can operate efficiently.
The effect of firm size on profitability of virtually all the branches of Bank of Ceylon (BOC) and Commercial Bank of Ceylon Ltd (CBC) with 10 years accounting period was studied by Velnampy and Nimalathasan (2010). The correlation analysis conducted on the secondary data indicates that there is a positive relationship between Firm size and Profitability in Commercial Bank of Ceylon Ltd, while there is no relationship between firm size and profitability in Bank of Ceylon.
The relationship between the capital structure and financial performance as evidenced from 21 industries in Karachi Stock Exchange in Pakistan was investigated by Javed and Akhtar (2012) using correlation and regression test on the financial data. The findings of the study show a positive relationship between the leverage, financial performance, growth and size of the companies. Bashir, Abbas, Manzoor and Akram (2013) identifies the factors significantly affecting the firm’s performance in food sector of Pakistan using one-way fixed effect model due to the presence of cross-sectional fixed effect. In the sector, long term leverage, size, risk, tangibility and non-debt tax shield were found to be the factors significantly affecting the firm’s financial performance.
An examination of the impact of firm specific factors on company financial performance of 974 firms in the Czech Republic over the period 2005 to 2008, using data in the Albertina database was conducted by Chandrapala and Knápková (2013). Their research found that the firm size, sales growth and capital turnover are having significant positive impact on financial performance of firms, while debt ratio and inventory reflect significant negative impact on financial performance of firms.
Taani and Banykhaled (2011) examined the effect of accounting information such as profitability, liquidity, debit to equity, market ratio, size which is derived from firm’s total assets, and cash flow from operation activities on earning per share (EPS) by using a sample of 40 companies listed in the Amman Stock Market. The findings reveal that profitability ratio (ROE), market ratio (PBV), cash flow from operation/sales, and leverage ratio (DER) has significant impact on earnings per share. A related study by Martani, Mulyono and Khairurizka (2009) reveals that profitability, turnover and market ratio has significant impact on the stock return.
A sample of twenty quoted companies was selected using the simple random sampling technique. The findings among others show that an insignificant negative correlation exists between CSR disclosure and firm size, while profitability is significantly and positively related to CSR disclosure of the companies.
An investigation into the impact of capital structure on the financial performance of companies listed in the Tehran Stock Exchange was carried out by Pouraghajan, Malekian, Lotfollahpour and Bagheri (2012).They tested a sample of 400 firms among the companies listed in the Tehran Stock Exchange. Results suggest that there is a significant negative relationship between debt ratio and financial performance of companies, and a significant positive relationship between asset turnover, firm size, asset tangibility ratio, and growth opportunities with financial performance measures. However, the relationship between ROA and ROE measures with the firm age is not significant. Hendricks and Singhal (2000) examined firm characteristics such as firm size, the degree of capital intensity, the degree of diversification, the timing of TQM implementation, and the maturity of the program and found that smaller firms do significantly better than larger firms.
Memon, Bhutto and Abbas (2012) investigated the impact of capital structure on firm financial performance in textile sector of Pakistan with 141 textile firms from 2004-2009. The results indicate that all the determinants of capital structure such as size, tangibility, debt to equity ratio, amount of annual tax, growth of firm and risk associated with business entity were significant and that Pakistan textile sector is performing below the optimum capital structure level and textile firms of large size have failed to achieve the economies of scale. The impact of firm level characteristics (size, leverage, tangibility, Loss ratio (risk), growth in writing premium, liquidity and age) on performance of insurance companies in Ethiopia was examined by Mehari and Aemiro (2013). The results of regression analysis reveal that insurers’ size, tangibility and leverage are statistically significant and positively related with return on total asset; however, loss ratio (risk) is statistically significant and negatively related with ROA.
Most of the existing studies on the subject centres on financial and allied institutions and not one of such studies considered the brewery sector of the Nigeria economy. Hence, this study aims at examining the causality, magnitude and nature of the interactions, with emphasis on relationship and effect, between firm size and financial performance in Nigeria brewery industry.
3.0 Methodology
The order of interaction and integration was studied using the two-step error correction procedure of Engle and Granger (1985). This was adopted in consonance with the work done in Abraham (2013). The formation of the relevant models to facilitate analysis of data is as stated below:
EPSt a0 a1LogTAt a2Ut-1 εt
……….(1)
EPSt a0 a1LogTAt a2 RESt-1 εt
……….(2)
Where:
a1 denotes the coefficient indicating the short run equilibrium relationship
linking the two variables;
a2 denotes the coefficient indicating the long run relationship linking the
variables with a priori expectation of -1;
Ut-1 or RESt-1 is the residual obtained from the linear regression of variables.
The residual is lagged by one to fulfill the requirement of the granger representation theorem.
εt is the disturbance term for the model.
Table 1: Description of Variables
Acronym EPS
Details
Earnings Per Share
Mathematical Expression
Net earnings available for common stock
Average number of outstanding shares
LogTA Log of Total Assets Fixed Assets + Current Assets
Unit Root Test
The Unit root test was conducted on the time series data obtained from annual report and accounts of Nigerian Breweries Plc and Guinness Nigeria Plc, which represent the Nigerian brewery industry. Data series with unit root issues produces spurious regression when used for analysis. A graphical representation was made to initially ascertain the existence of unit root in the time series data. The trend of the line graphs reveals that the data series were not stationary and needs to be disinfected to avoid spurious regression. This is evident from the fact that the line graph did not cross the zero line even at an instance as shown below:
Figure 1: Graphical Representation of the Variables with Unit Root Issues
0 1 2 3 4 5 6
2000 2002 2004 2006 2008 2010 2012
EPS
7. 4 7. 6 7. 8 8. 0 8. 2 8. 4 8. 6
2000 2002 2004 2006 2008 2010 2012
LOGTA
Source: Author’s EView 8.0 Computation
Figure 1 reveals that the time series data for total assets and earnings per share were non-stationary as the line graphs have wide disparity from zero and did not cross the zero line severally.
Table 2: Augmented Dickey Fuller (ADF) Unit Root Test Results
Variables Test Critical Values Test Statistics Status
1 % 5 % 10 % ADF (Stationarity) EPS -3.808546 -3.020686 -2.650413 -5.287424 I(2)
LogTA -2.816740 -1.982344 -1.601144 -3.683826 1(2)
Source: Researcher’s EView 8.0 Computation
Table 2 reveals that both Earnings Per Share and Total Assets data series have unit root but were found to be stationary at second difference. There integration of the same order I(2) is an indication that the variables could cointegrate in line with the opinion of Engle and Granger (1985). They opined that when time series data are integrated of the same order, the data series tend to cointegrate. This means that their short term characteristics are sustainable at the long term. They listed the consequences of such cointegration to include that;
Time series data that are integrated of the same order I(2), share a stochastic component and a long run equilibrium relationship.
Wide disparities from the zero line of equilibrium as a result of volatilities will be corrected over a period of time.
ΔYt is believed to be responding to shocks to X under a state of cointegration over the short and long term.
Figure 2: Graphical Representation of the Variables without Unit Root Issues
-1.5 -1.0 -0.5 0.0 0.5 1.0 1.5
2000 2002 2004 2006 2008 2010 2012
D E P S
-. 08 -. 04 . 00 . 04 . 08 . 12 . 16 . 20 . 24
2000 2002 2004 2006 2008 2010 2012
D LOGTA
Source: Author’s EView 8.0 Computation
Table 3 explains the characteristics of the research variables. It reveals the mean, median, standard deviation and other frequency distribution indices for the study, as well as the maximum and minimum values of the time series data under study.
Table 3: Descriptive Statistics
DETAILS EPS LOGTA
Mean 2.865000 7.989534 Median 2.450000 7.943398 Maximum 5.700000 8.404207 Minimum 0.770000 7.557553 Std. Dev. 1.630676 0.244133 Skewness 0.393132 0.316478 Kurtosis 1.837475 2.580741 Jarque-Bera 1.148978 0.336239 Probability 0.562993 0.845253 Sum 40.11000 111.8535 Sum Sq. Dev. 34.56835 0.774812 Observations 14 14
The coefficient of skewness for EPS and Total Assets have values below one (1) signifying a normal frequency distribution. Kurtosis coefficient is 1.837475 and 2.580741 for EPS and Total Assets respectively. Jarque-Bera statistic shows that EPS and Total Assets have insignificant p-values of 0.562993 and 0.845253 respectively. Both Kurtosis and Jarque-Bera statistic confirm that the time series data were normally distributed. The standard deviation of EPS is more volatile than that of Total Assets.
Granger-Causality test is conducted in the context of linear regression models and specified in bivariate linear autoregressive model of two variables X1 and X2 based
on lagged values of EPS and Total Assets as applied by Pasquale (2006) and cited in Inyiama (2013):
P p
X1(t) =∑ A11,jX1(t−j) + ∑ A12,jX2(t−j) + E1 (t) ……….(5)
j =1 j =1
P p
X2(t) =∑ A21,jX1(t−j) + ∑ A22,jX2(t−j) + E2 (t)………(6)
j =1 j =1
Where;
p is the maximum number of lagged observations included in the equation, the matrix A contains the coefficients of the equation (i.e., the contributions of each lagged observation to the predicted values of X1(t) and X2(t) ,
X1 is the Earnings Per Share which is constant while X2 takes the form of Total
Assets index and value and,
E1 and E2 are residuals (prediction errors) for each time series data.
Table 4: Pairwise Granger Causality Tests
Date: 10/16/14 Time: 20:08 Sample: 2000 2013
Lags: 2
Null Hypothesis: Obs F-Statistic Prob.
DLOGTA does not Granger Cause DEPS 11 2.92233 0.1300
DEPS does not Granger Cause DLOGTA 0.26709 0.7742
Table 5: Pairwise Granger Causality Tests
Date: 10/16/14 Time: 20:11 Sample: 2000 2013
Lags: 1
Null Hypothesis: Obs F-Statistic Prob.
DLOGTA does not Granger Cause DEPS 12 1.89060 0.2024 DEPS does not Granger Cause DLOGTA 1.67404 0.2279
Source: EView 8.0 Computation
Tables 4 and 5 indicate that there is no causality running from either earnings per share to total assets or from total assets to earnings per share, both at lagged periods 1 and 2. This implies that earnings per share does not granger cause total assets and vice versa.
-1.00 -0.75 -0.50 -0.25 0.00 0.25 0.50
-1.5 -1.0 -0.5 0.0 0.5 1.0 1.5
2004 2005 2006 2007 2008 2009 2010 2011 2012 2013
Res idual Ac tual Fitted
Table 6: Residual Test for Stationarity
Null Hypothesis: RES has a unit root Exogenous: Constant
Lag Length: 0 (Automatic - based on SIC, maxlag=1)
t-Statistic Prob.* Augmented Dickey-Fuller test statistic -3.299552 0.0473
Test critical values: 1% level -4.420595
5% level -3.259808
10% level -2.771129
*MacKinnon (1996) one-sided p-values.
Warning: Probabilities and critical values calculated for 20 observations and may not be accurate for a sample size of 9
Augmented Dickey-Fuller Test Equation Dependent Variable: D(RES)
Method: Least Squares Date: 10/22/14 Time: 12:30 Sample (adjusted): 2005 2013
Included observations: 9 after adjustments
Variable Coefficient Std. Error t-Statistic Prob.
RES(-1) -1.136048 0.344304 -3.299552 0.0131
C 0.007662 0.027982 0.273811 0.7921
R-squared 0.608655 Mean dependent var 0.013442
Adjusted R-squared 0.552749 S.D. dependent var 0.125277 S.E. of regression 0.083781 Akaike info criterion -1.928084 Sum squared resid 0.049135 Schwarz criterion -1.884256 Log likelihood 10.67638 Hannan-Quinn criter. -2.022664
F-statistic 10.88704 Durbin-Watson stat 2.227577
Prob(F-statistic) 0.013129
Source: Author’s EView 8.0 Computation
He emphasized that the multivariate EG two-step procedure for estimating ECM however, requires that there are only two variables in the system. Therefore, the output of the regression analysis, after the estimation, is then presented in Table 7.
Table 7: Regression Analysis Result
Dependent Variable: DEPS Method: Least Squares Date: 10/22/14 Time: 09:55 Sample (adjusted): 2005 2013
Included observations: 9 after adjustments
Variable Coefficient Std. Error t-Statistic Prob.
C 0.418502 0.108770 3.847585 0.0085
DLOGTA 1.868122 1.148158 1.627061 0.1548 DRES 2.106872 0.760097 2.771847 0.0323
R-squared 0.652150 Mean dependent var 0.547778 Adjusted
R-squared 0.536199 S.D. dependent var 0.393820 S.E. of regression 0.268203 Akaike info criterion 0.467057 Sum squared resid 0.431597 Schwarz criterion 0.532798
Log likelihood 0.898244
Hannan-Quinn
criter. 0.325187
F-statistic 5.624396 Durbin-Watson stat 1.620818 Prob(F-statistic) 0.042090
Source: Author’s EView 8.0 Computation
Table 7 reveals that Total Assets has a positive but insignificant short run effect on financial performance as proxied by EPS. It further reveals that the long term effect of total assets on financial performance is positive and significant. The error correction mechanism suggests that deviations from equilibrium are corrected at approximately 187% per annum. This implies that the distortions affecting EPS in the long run could be corrected in approximately six months while adjusted R2 stood at
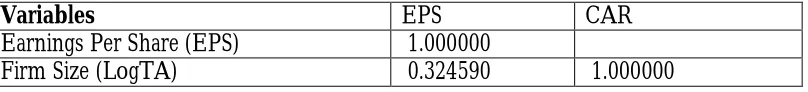
Table 8: Correlation Results
Variables EPS CAR
Earnings Per Share (EPS) 1.000000
Firm Size (LogTA) 0.324590 1.000000
Source: Author’s EView 8.0 Computation
Table 8 reveals a positive correlation between EPS and Total Assets. The relationship between EPS and Total Assets is not a strong one. This signifies that an increase in Total Assets could result to an increase in EPS, holding other factors constant. The strength of the relationship is estimated at approximately 32.5%. This is in line with the insignificant effects which Total Assets exerts on EPS as revealed by the regression analysis.
5.0 Summary and Conclusion
The study aims at determining the extent to which Earnings Per Share is influenced by the level of Total Assets maintained by firms in the Nigeria brewery industry, as well as the nature and magnitude of their causalities. The researcher applied the 2-step cointegration and error correction model of Engle and Granger (1985) in a simple regression framework. Firm Size has both short and long term positive effect on EPS. However, the long run relationship is significant at 5%. On causalities, there is no causality running from either EPS to Total Assets or otherwise, both at 1 year and 2 years lagged periods. The implication is that EPS does not granger cause Total Assets and vice versa.
Under this situation, there is no stock out cost. Hence, brewery firms should strive to attain this height of a sound asset base in order to meet, on a timely basis, their responsibilities towards the customers and by extension, improve on their financial performance; especially at the long term.
References
Abraham, W.T.(2013). “Stock Market Reaction to Selected Macroeconomic Variables in the Nigerian Economy”, CBN Journal of Applied Statistics 2(1), 61 – 70.
Akbas, H. E. and Karaduman, H.A. (2012). “The Effect of Firm Size on Profitability: An Empirical Investigation on Turkish Manufacturing Companies”, European Journal of Economics, Finance and Administrative Sciences, Issue 55:21-27.
Almajali, A.Y., Alamro, S.A. and Al-Soub, Y.Z. (2012). “Factors Affecting the Financial Performance of Jordanian Insurance Companies Listed at Amman Stock Exchange”, Journal of Management Research, 4 (2).
Athanasoglou, P.P., Brissimis, S.N. and Delis, M.D (2008). “Bank Specific, Industry-Specific and Macroeconomic Determinants of Bank Profitability”, Journal of International Financial Markets, Institutions and Money, 18 (2), 121-136.
Bashir, Z., Abbas, A., Manzoor, S. and Akram, M.N. (2013). “Empirical Investigation of the Factors Affecting Firm’s Performance: a Study Based on Food Sector of Pakistan”, International SAMANM Journal of Finance and Accounting, 1(2): 11-23
Chandrapala, P. and Knápková, A. (2013). “Firm-specifi c factors and fi nancial performance of fi rms in the Czech Republic”. Acta Universitatis Agriculturae et Silviculturae Mendelianae Brunensis, 7: 2183–2190
Dickey, D. A. and Fuller, W. A. (1979). “Distributions of the Estimators for Autoregressive Time Series with a Unit Root”. Journal of the American Statistical Association, 74, 423–431.
Ebiringa, O.T., Yadirichukwu, E., Chigbu, E.E. and Ogochukwu, O.J. (2013). “Effect of Firm Size and Profitability on Corporate Social Disclosures: The Nigerian Oil and Gas sector in Focus”, British Journal of Economics, Management & Trade 3(4): 563-574,
Engle, R.F., and Granger, C.W.J. (1985). “Cointegration and Error Correction Representation, Estimation and Testing”, Econometrica, 255-276
Granger, C.W.J, (1969), “Investigating Causal Relations by Econometric Models and Cross-spectral Methods”, Econometrica, 37, 428-438.
Hardwick, P. (1997). “Measuring Cost Inefficiency in the UK Life Insurance Industry”, Applied Financial Economics, 7, 37-44.
Hendricks, K.B. and Singhal, V.R. (2000). “Firm characteristics, total quality management and financial performance”, Journal of Operations Management, 238 (2000) 1–17 Inyiama, O.I., (2013). “Does Inflation Weaken Economic Growth? Evidence from Nigeria”,
European Journal of Accounting Auditing and Finance Research, 1(4), 139-150. Javed, B. and Akhtar, S. (2012). “Interrelationships between capital structure and financial
Kumar, K., Rajan, R., Zingales, L.,(2001). “What determines firm size. Unpublished working paper”, National Bureau of Economics Working Paper 7208.
Lucas, R. E. (1978). On the Size Distribution of Business Firms," Bell Journal of Economics, 9: 508-523.
Martani, D., Mulyono, A. and Khairurizka, R. (2009). The effect of financial ratios, firm size, and cash flow from operating activities in the interim report to the stock return, Chinese Business Review, 44-55.
Mehari, D. and Aemiro, T. (2013). Firm Specific Factors that Determine Insurance Companies’ Performance In Ethiopia, European Scientific Journal April 2013 edition vol.9, No.10: 245-255.
Memon, F., Bhutto, N. A. and Abbas, G. (2012). “Capital Structure and Firm Performance: A Case of Textile Sector of Pakistan”, Asian Journal of Business and Management Sciences, 1(9): 9-15
Pasquale, F. (2006). “Testing for granger causality between stock prices and economic growth”. MPRA Paper 2962, University Library of Munich, Germany, revised 2007. Pavelková, D. and Knápková, A. (2009). Vykonnost podniku z pohledu fi nančniho
manažera, Praha: Linde nakladatelství, 302.
Maja Pervan and Josipa Višić (2012). Influence of Firm Size on its Business Success, Croatian Operational Research Review (CRORR), 3: 213 -223.
Pouraghajan, A., Malekian, E., Emamgholipour, M., Lotfollahpour, V. and Bagheri, M.M. (2012). “The Relationship between Capital Structure and Firm Performance Evaluation Measures: Evidence from the Tehran Stock Exchange”, International Journal of Business and Commerce, 1(9): 166-181.
Ravenscraft, D.J. and Scherer, F.M. (1987). “Life After Takeover”, The Journal of Industrial Economics, 36 (2), pp. 147-156.
Symeou, P.C. (2012). The firm size – performance relationship: an empirical examination of the role of the firm’s growth potential, Institute for Communication Economics, Department of Management, University of Munich (LMU); Judge Business School, University of Cambridge,
Taani, K. and Banykhaled, M.H. (2011). The Effect of Financial Ratios, Firm Size and Cash Flows from Operating Activities on Earnings Per Share: (An Applied Study: On Jordanian Industrial Sector), International Journal of Social Sciences and Humanity Studies 3(1), 197-205.
Velnampy, T and Nimalathasan, B (2010). Firm Size on Profitability: A Comparative Study of Bank of Ceylon and Commercial Bank of Ceylon Ltd in Srilanka, Global Journal of management and Business Research, Vol. 10 Issue 2: 96-103.
Weiner, N. and Mahoney, T.A. (1981). “A Model of Corporate Performance as a Function of Environmental, Organizational and Leadership Influences”, Academy of Management Journal,24 (3), 453-470.