International Journal of Research in AYUSH and
Pharmaceutical Sciences
Website: http://ijraps.in 314
Research Article
DEVELOPMENT AND VALIDATION OF HPTLC METHOD FOR THE ANALYSIS OF TOLPERISONE
HYDROCHLORIDE IN PHARMACEUTICAL DOSAGE FORM
A. Lakshmana Rao*, T. Raja
Department of Pharmaceutical Analysis, V.V.Institute of Pharmaceutical Sciences, Gudlavalleru,
Andhra Pradesh, India.
Keywords:
Tolperisone,HPTLC,
Formulation, Estimation.
ABSTRACT
A simple, sensitive, rapid and precise high performance thin layer chromatographic method has been developed and validated for the estimation of Tolperisone hydrochloride in bulk and pharmaceutical dosage form. The stationary phase used was silica gel precoated aluminum plate 60F254 plates. The mobile phase used was a mixture of chloroform:acetone:toluene (6:2:2, v/v/v). The detection of spots was carried out at 265 nm. The method was validated in terms of specificity, linearity, precision and accuracy. The calibration curve was found to be linear between 50-600 ng/band. The developed method was subjected for forced degradation studies like acid, alkali, peroxide and thermal stress conditions were performed as per ICH guidelines. The proposed method was suitable for routine quality control analysis of Tolperisone hydrochloride in bulk and pharmaceutical formulation.
INTRODUCTION
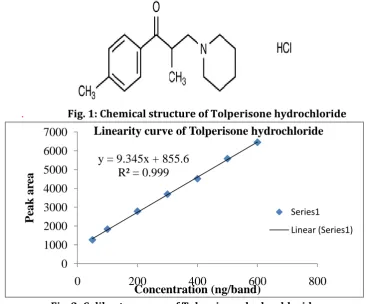
Tolperisone hydrochloride (Fig. 1) is a skeletal muscle relaxant, acts at the level of spinal cord by
blocking sodium channels and calcium channels [1-2].
Chemically it is
2-methyl-1-(4-methylphenyl)-3-(1-piperidinyl)-1-propanone hydrochloride [3].
Tolperisone hydrochloride exerts its spinal reflex inhibitory action predominantly via pre-synaptic inhibition of the transmitter release from the primary afferent endings via combined action on
voltage-gated sodium and calcium channels [4].
Tolperisone hydrochloride increases the blood supply to skeletal muscle and antinociceptive activity against thermal stimulation that is likely to
be attributed to its local anesthetic action [5].
Literature survey revealed that few HPTLC methods
[6-7] were reported for the estimation of Tolperisone
hydrochloride. Hence the objective of this method is to develop and validate a simple, precise and rapid
HPTLC method in accordance with ICH guidelines
[8-9] for the estimation of Tolperisone hydrochloride in
bulk sample and its pharmaceutical formulation.
EXPERIMENTAL Instrumentation
To develop a high performance thin layer
chromatographic method for quantitative
determination of Tolperisone hydrochloride using computerized Camag HPTLC system (Camag, Muttenz, Switzerland) consisting of a Camag 100 microlitre sample syringe (Hamilton, Bonded, Switzerland) on silica gel precoated aluminum plate 60F254 plates, [20 m × 20cm width 200μm thickness; E. Merck, Darmstadt, Germany] using a Camag Linomat V (Switzerland) sample applicator. Densitometric scanning was performed using a Camag TLC scanner III in the reflectance absorbance mode at 265 nm and operated by CATS software (V 3.15, Camag). The source of radiation used was deuterium lamp emitting a continuous UV spectrum between 190 nm and 400 nm. A Camag glass twin-trough development chamber, different size pipettes, volumetric flasks, measuring cylinders, micro syringes and ruler were used.
Chemicals and solvents
The reference samples of Tolperisone
Hydrochloride in Pharmaceutical Dosage Form
Preparation of standard solution
Accurately weighed and transferred 50 mg of Tolperisone hydrochloride into a 100 mL clean dry volumetric flask, about 10 mL of diluent was added and volume was made upto the mark by using diluent. Further 1 mL of above stock solution was pipetted into100 mL volumetric flask and diluted upto the mark by adding diluent. From this 1 mL of the solution was pipettted into a 100 mL volumetric flask and made upto the mark with diluent. From this serial dilutions were prepared to construct the calibration curve.
Preparation of sample solution
Twenty tablets were accurately weighed and crushed into a fine powder in a mortar. An amount of powder equivalent to 150 mg of Tolperisone hydrochloride into 100 mL volumetric flask and about 50 mL of diluent was added. The mixture was sonicated for 20 min to dissolve and made volume upto the mark with diluent; then solution was filtered through 0.45 µm filter paper. Further 1 mL of solution was pipetted and transferred into100 mL volumetric flask, made volume upto the mark by using diluent. From the above stock solution, 2 mL of the solution was pipetted into a 100 mL volumetric flask and made upto volume with mobile phase to yield concentration 300 ng/band of Tolperisone hydrochloride.
Method
TLC plates were prewashed and activation of plates
was done in an oven at 500C for 5-10 min. The
chromatographic conditions maintained were precoated silica gel 60F254 aluminum sheets (10x10 cm) as stationary phase, chloroform:acetone: toluene (6:2:2, v/v/v) as mobile phase. The mobile phase was used as diluent, chamber and plate saturation time of 20 min, migration distance allowed was 72 mm, keeping the slit dimension at 5x0.45 mm. A deuterium lamp provided the source of radiation. Ten microliters of standard solution of Tolperisone hydrochloride was spotted and developed at constant temperature. Wavelength was selected by scanning standard solution over
200-400 nm wavelength. Tolperisone
hydrochloride show maximum absorbance at 265 nm in reflectance mode with Camag TLC Scanner 3 using WinCATS software.
Calibration curve
Aliquot of 50, 100, 200, 300, 400, 500 and 600 ng/band of standard solution of Tolperisone hydrochloride was applied on the TLC plate. TLC plate was dried, developed and analyzed photometrically as described earlier. The standard
calibration curve was plotted using regression analysis with Microsoft excel.
Validation of the method
The developed method was validated in terms of specificity, linearity, system precision, method precision and intermediate precision, accuracy, limit of detection and limit of quantitation.
STABILITYSTUDIES
Forced degradation studies were conducted indicating the stability of proposed method by subjecting the sample for acid degradation, alkali degradation, peroxide degradation and thermal degradation.
Control sample
Twenty tablets were accurately weighed and crushed in to a fine powder in a mortar. An amount of powder equivalent to 150 mg of Tolperisone hydrochloride into 100 mL volumetric flask and 50 mL of diluent was added to it. The mixture was sonicated for 20 min to dissolve and made volume up to the mark with diluent; the solution was filtered through 0.45 µm filter paper. Further 1 mL of solution was transferred to 100 mL volumetric flask, made volume upto the mark by using diluent. From the above stock solution, 2 mL of the solution was pipetted into a 100 mL volumetric flask and made upto the mark with diluent.
Acid degradation studies
Twenty tablets were weighed and finely powdered. An accurately weighed portion of powder sample equivalent to 150 mg of Tolperisone hydrochloride was transferred to a 100 mL volumetric flask containing 50 mL of the diluent. The contents of the flask were sonicated for about 30 min for complete solubility of the drug with intermittent shaking at controlled temperature and the volume was made up to the mark by using diluent. From this 1 mL of the solution was pipetted into 100 mL volumetric flask and made volume upto the mark with diluent. Then 5 mL of 0.1N acid (Hydrochloric acid) was added, refluxed for 8 hours at 60°C, then cooled to room temperature, neutralized with 0.1N base (Sodium hydroxide) and diluted to volume with diluent. Then this mixture was filtered through 0.45 µ membrane filter. 2 mL of the above filtered sample solution was pipetted into a 100 mL volumetric flask and diluted to volume with diluent.
Alkali degradation studies
Website: http://ijraps.in 316 flask were sonicated for about 30 min for complete
solubility of the drug with intermittent shaking at controlled temperature and the volume was made upto the mark by using diluent. From this 1 mL of the solution was pipetted into 100 mL volumetric flask and made volume upto the mark with diluent. Then 5 mL of 0.1N base (Sodium hydroxide) was added, refluxed for 8 hours at 60°C, then cooled to room temperature, neutralized with 0.1N acid (Hydrochloric acid) and diluted to volume with diluent. Then this mixture was filtered through 0.45 µ membrane filter. Pipetted 2.0 mL of the above filtered sample solution into a 100 mL volumetric flask and diluted to volume with diluent.
Peroxide degradation studies
Twenty tablets were weighed and finely powdered. An accurately weighed portion of powder sample equivalent to 150 mg of Tolperisone hydrochloride was transferred to a 100 mL volumetric flask containing 50 mL of the diluent. The contents of the flask were sonicated for about 30 min for complete solubility of the drug with intermittent shaking at controlled temperature volume was made upto the mark by using diluent. From this 1 mL of the solution was transferred into 100 mL volumetric
flask and made volume upto the mark with diluent Then 2 mL of 3 % hydrogen peroxide was added, refluxed for 8 hours at 60°C, then cooled to room temperature and diluted to volume with diluent. Then this mixture was filtered through 0.45 µ membrane filter. 2.0 mL of the above filtered sample solution was pipetted into a 100 mL volumetric flask and diluted to volume with diluent.
Thermal degradation studies
Twenty tablets were weighed and finely powdered. The powder is exposed to heat at 105°C for about 8 hours. An accurately weighed portion of powder sample equivalent to 150 mg of Tolperisone hydrochloride was transferred to a 100 mL volumetric flask containing 50 mL of the diluent. The contents of the flask were sonicated for about 30 min for complete solubility of the drug with intermittent shaking at controlled temperature and then cooled the solution to room temperature and volume made up with further quantity of diluent. Then this mixture was filtered through 0.45 µ membrane filter. 3.3 mL of the above filtered sample solution was pipetted into a 100 mL volumetric flask and diluted to volume with diluent.
. Fig. 1: Chemical structure of Tolperisone hydrochloride
Fig. 2: Calibraton curve of Tolperisone hydrochloride
y = 9.345x + 855.6
R² = 0.999
0
1000
2000
3000
4000
5000
6000
7000
0
200
400
600
800
P
eak
ar
ea
Concentration (ng/band)
Linearity curve of Tolperisone hydrochloride
Series1
Hydrochloride in Pharmaceutical Dosage Form
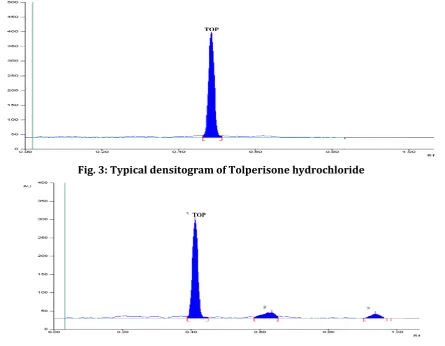
Fig. 3: Typical densitogram of Tolperisone hydrochloride
Fig. 4: Densitogram of acid degradation showing Tolperisone hydrochloride
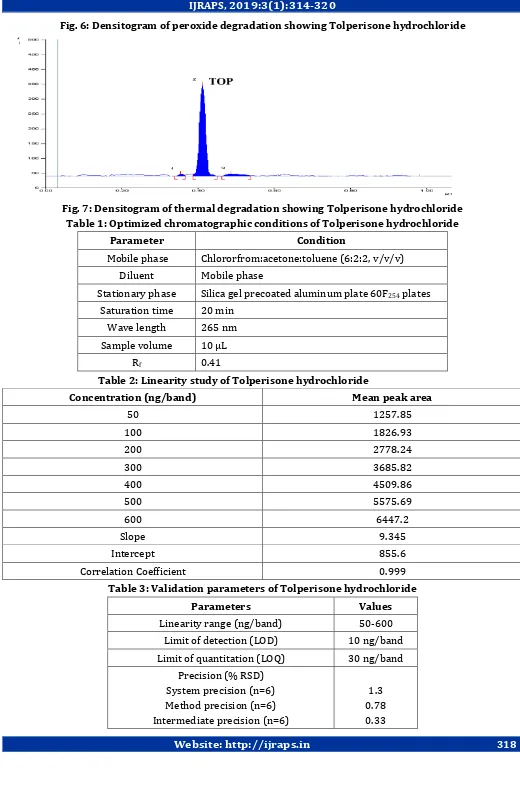
Website: http://ijraps.in 318 Fig. 6: Densitogram of peroxide degradation showing Tolperisone hydrochloride
Fig. 7: Densitogram of thermal degradation showing Tolperisone hydrochloride Table 1: Optimized chromatographic conditions of Tolperisone hydrochloride
Parameter Condition
Mobile phase Chlororfrom:acetone:toluene (6:2:2, v/v/v)
Diluent Mobile phase
Stationary phase Silica gel precoated aluminum plate 60F254 plates
Saturation time 20 min
Wave length 265 nm
Sample volume 10 µL
Rf 0.41
Table 2: Linearity study of Tolperisone hydrochloride
Concentration (ng/band) Mean peak area
50 1257.85
100 1826.93
200 2778.24
300 3685.82
400 4509.86
500 5575.69
600 6447.2
Slope 9.345
Intercept 855.6
Correlation Coefficient 0.999
Table 3: Validation parameters of Tolperisone hydrochloride
Parameters Values
Linearity range (ng/band) 50-600
Limit of detection (LOD) 10 ng/band
Limit of quantitation (LOQ) 30 ng/band
Precision (% RSD) System precision (n=6) Method precision (n=6) Intermediate precision (n=6)
Hydrochloride in Pharmaceutical Dosage Form
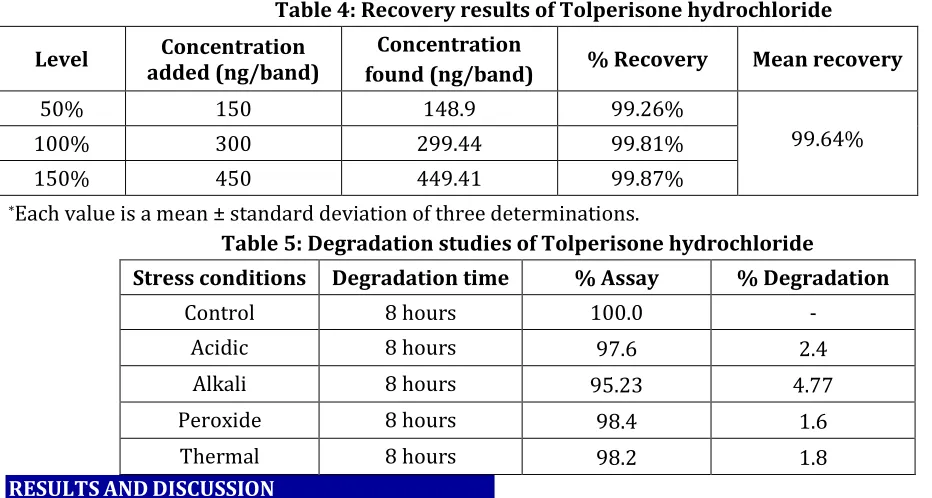
Table 4: Recovery results of Tolperisone hydrochloride
Level added (ng/band) Concentration Concentration
found (ng/band) % Recovery Mean recovery
50% 150 148.9 99.26%
99.64%
100% 300 299.44 99.81%
150% 450 449.41 99.87%
*Each value is a mean ± standard deviation of three determinations.
Table 5: Degradation studies of Tolperisone hydrochloride
Stress conditions Degradation time % Assay % Degradation
Control 8 hours 100.0 -
Acidic 8 hours 97.6 2.4
Alkali 8 hours 95.23 4.77
Peroxide 8 hours 98.4 1.6
Thermal 8 hours 98.2 1.8
RESULTSANDDISCUSSION
For HPTLC, silica gel precoated aluminum plates 60F254 was chosen as the stationary phase for the separation and determination of Tolperisone hydrochloride. Mixture of commonly used solvents like butane:ethyl acetate, chloroform:butanol: toluene combinations were tested as mobile phase. The choice of the optimum composition was based on the chromatographic response factor, a good peak shape with minimum tailing. A mixture of chloroform:acetone:toluene (6:2:2, v/v/v) was proved to be the most suitable of all the combinations since the densitogram peak obtained was well defined peaks are measured at 265 nm, better resolved. The results of optimized
chromatographic conditions of Tolperisone
hydrochloride were shown in Table 1.
The specificity of method was performed by comparing the densitograms of blank, standard and sample. The absence of additional peaks in the densitogram indicates non-interference of the commonly used excipients in the tablets and hence the method was specific. The linearity was found 50-600 ng/band of Tolperisone hydrochloride. The regression equation of the linearity curve between concentrations of Tolperisone hydrochloride over its peak areas were found to be Y=9.345X+855.6 (where Y is the peak area and X is the concentration of Tolperisone hydrochloride in ng/band) and the correlation coefficient was 0.999. The linearity curve of Tolperisone hydrochloride was shown in Fig. 2. The linearity results were furnished in Table 2.
To study the system precision, six replicate standard solutions of Tolperisone hydrochloride was injected. The %RSD was calculated and it was found to be 1.3 of Tolperisone hydrochloride, which are well within the acceptable criteria of not more than 2.0. The method precision study was carried out on six preparations from the same tablet samples of Tolperisone hydrochloride percent amount of both were calculated. The %RSD of the assay result of six preparations in method precision study was found to be 0.78. The intermediate precision study was carried out by different analysts; from the same tablet of Tolperisone hydrochloride in the percent amount of Tolperisone hydrochloride was calculated. The %RSD of the assay result of six preparations in intermediate precision study was 0.33. The lower %RSD values reveals that the method quite precise.
Website: http://ijraps.in 320 the acceptable limits. This indicates that the
method was accurate. The recovery studies results are furnished in Table 4. The Rf value of the Tolperisone hydrochloride was found to be 0.41. The densitogram of Tolperisone hydrochloride was shown in Fig. 3.
HPTLC studies of Tolperisone hydrochloride under different stress conditions indicated the following degradation behavior. In acid degradation, the % degradation was 2.4%. In alkali degradation, the % degradation was 4.77%. In peroxide degradation, the % degradation was 1.6%. In thermal degradation, the % degradation was 1.8%. The results of degradation studies are given in Table 5. The typical chromatograms of degradation behavior of Tolperisone hydrochloride in different stress conditions are shown in Fig. 4 to Fig. 7.
CONCLUSION
The developed HPTLC method for the estimation of Tolperisone hydrochloride is simple, specific, precise, accurate and reproducible. The amounts found in formulations are well agreed with label claim. The proposed method can be applied to routine analysis in quality control laboratories for the estimation of Tolperisone hydrochloride in bulk
and in pharmaceutical formulation.
REFERENCES
1. Vora A. Tolperisone drug review. Journal of
Association Physician of India. 2010; 58: 127-128.
2. Stefan Q, Claudia M, Walter Z, Wolfgang S.
Tolperisone: a typical representative of a class of centrally acting muscle relaxants with less sedative side effects. CNS Neuroscience & Therapeutics. 2008; 14: 107-119.
3. The Merck Index. 14th Edition, Merck & Co., Inc.,
Whitehouse Station, NJ, USA. 2006; 3608.
4. Balzac D, Janos L, Szabolcs S. Identification of
metabolic pathways involved in the
biotransformation of Tolperisone hydrochloride by human microsomal enzymes. Drug Metabolism & Disposition. 2003; 31(5): 631– 636.
5. Pratzel HG, Alken RG, Ramm S. Efficacy and
tolerance of repeated oral doses of Tolperisone hydrochloride in the treatment of painful reflex muscle spasm results of a prospective placebo-controlled double-blind trial. Pain. 1996; 67(2-3): 417–425.
6. Usmangani KC, Kashyap KB, Dimal AS, Dhruti
CN, Gautam RC. Estimation of centrally acting
muscle relaxant drug Tolperisone
hydrochloride using HPTLC method. World Journal of Analytical Chemistry. 2013; 1(1): 1-7.
7. Hubicka U, Krzek J, Zuromska-Witek B.
TLC-densitometric determination of Tolperisone and its impurities 4-methylpropiophenione and piperidine in pharmaceutical preparations. Journal of Liquid Chromatography & Related Technologies. 2012; 35(10): 1325-1335.
8. ICH Harmonised Tripartite Guideline. Validation
of analytical procedures: Text and methodology.
Q2(R1), International Conference on
Harmonization, USA. 2005: 1-13.
9. ICH Harmonised Tripartite Guideline. Stability
Testing of New Drug Substances and Products.
Q1A(R2), International Conference on
Harmonization, USA. 2003: 1-18.
Cite this article as:
A. Lakshmana Rao, T. Raja. Development And Validation of HPTLC Method for the Analysis of Tolperisone Hydrochloride in Pharmaceutical Dosage Form. International Journal of Research in AYUSH and Pharmaceutical Sciences, 2019;3(1):314-320.
Source of support: Nil, Conflict of interest: None Declared
*Address for correspondence Dr. A. Lakshmana Rao
Professor and Principal
V. V. Institute of Pharmaceutical Sciences, Gudlavalleru, Andhra Pradesh, India.