A COMPARISON OF ETHANOL AND METHANOL BLENDING WITH GASOLINE
USING VARIOUS COMPRESSION RATIO IN SI (SPARK IGNITION) ENGINE
Abhishek Koshta*, D. S. Rawat
*Research Scholar Department of Mechanical Engineering Jabalpur Engineering College (JEC),
Jabalpur, India.
Asst. Professor Department of Mechanical Engineering Jabalpur Engineering College (JEC), Jabalpur, India.
KEYWORDS
:
Methanol, Ethanol, Gasoline, SI engine, compression ratio.ABSTRACT
This work investigated the influence of compression ratio and methanol & ethanol-gasoline blending on the performance, emission of four stroke single cylinder SI (spark ignition) engine. In this investigation, water cooled and air cooled engine having compression ratio range 2.5:1 to 10:1 is used. Fuel blends M0 M10 M20 M30 M40 And E0, E10, E20, E30 and E40 is used in the study and engine operated at constant speed of 1500 rpm. Maximum power obtained for E40 fuel at compression ratio 8:1. Minimum fuel consumption rate obtained for E0 fuel at compression ratio 6:1, as compression ratio increases fuel consumption rate decreases slightly. In this study, minimum gas temperature obtained for E40 fuel at compression ratio 8:1, exhaust gas temperature firstly decreases as compression ratio increases and then increased to compression ratio 10:1. Emission of unburned hydrocarbons decreased while increasing compression ratio, minimum obtained at compression ratio 10:1 for E40 fuel. Emission of carbon monoxide also decreased when compression ratio increased.
INTRODUCTION
World population increasing day by day, that increased demand of vehicles and industries, which consume fossil fuel. Fossil fuel reserves are limited in nature and they are going to be depleted in next some decayed, if these limited reserves used to fulfill the demand of industries and transportation. The cost of petroleum products have increased dramatically due to this increased demand of petroleum products. Increased demand and cost of petroleum products increases the attention of researchers in this field of alternative fuels in recent years. Ethanol is good alternative fuel for spark ignition engines and reduces the hazardous emission products from the engine as compared to the conventional fuel, which makes ethanol eco-friendly. Alcohols like ethanol and methanol can be used in blends with gasoline in gasoline based engine. Alcohols have higher octane number; hence addition of ethanol in the gasoline increases the octane number of the blends. Higher octane number reduces the knocking problem in the engine. However, increasing alcohol content in the gasoline it increases fuel consumption due to its lower energy content [1]. Now a day, pollution of environmental have became an important issue in industrialized society. The air pollution due to the automobiles and motorcycles is one of the important issue. By using ethanol fuel it reduces the air pollution problem up to some extent and also prevents fossil fuel reserves from depletion. [2].
Ethanol is knows as most attractive alternative fuel because of its properties like high octane number and flame speed among all the alcohols. It can be produces from renewal energy resources like agriculture feedstock. Pure ethanol can also be used in the SI (spark ignition) engine but it requires some modifications in the engine. Low blended ethanol can be used in engine easily without any modification in the engine [3]. Improvement in engine performance can be obtained by increasing Compression ratio; at higher compression ratio engine have higher air fuel mixture density and turbulence inside the combustion chamber. The compression ratio of engine is limited by knock resistance [5]. Ethanol has higher octane number, flammability limit, oxygen ratio and is considered to be renewable fuel. Ethanol has high heat of vaporization which improves volumetric efficiency and then power output [6].
LITERATURE REVIEW
BMEP (break mean effective pressure) and torque as compared to the compression ratio 10:1. Compression ratio 12:1 produced lowest SFC at whole engine speed and compression ratio 10:1 produced highest SFC for most of the engine speed. For both fuel (E22 and E100) increasing compression ratio increases thermal efficiency [5]. The maximum BTE (break thermal efficiency) obtained 30.22%, 30.47% and 29.73% for ethanol, methanol and unleaded gasoline. Maximum (CGP) cylinder gas pressure obtained about 4502 at compression ratio 9:1 with gasoline, 4747 qt compression ratio 9.5:1 with ethanol, 4994 at compression ratio 9:1 with methanol Unleaded gasoline produces excessive value of CO2 and NOx at compression ratio 9:1. Increasing compression ratio increases CO2 and NOx for all three fuels up to compression ratio 9:1. NOx emission reduces with the use of alcohol fuels [6]. Maximum fuel consumption was obtained for E100 fuel at the engine load 440 watt and minimum specific fuel consumption was obtained for E20 fuel at maximum load 2200 watt condition. Maximum break thermal efficiency was obtained for E60 fuel at engine load 2200 watt, while minimum break thermal efficiency was obtained for the same fuel at engine load 440 watt. Minimum CO emission was obtained for E100 fuel at no load condition and maximum CO emission was obtained for E0 fuel at load 2200 watt [7]. Engine break power decreased when ethanol contents in the blended fuel decreased for all engine The break for gasoline is higher than all blends of ethanol, with the methanol blended fuel methanol contents decreased there was slightly increment in the break power for M30 and M50. The highest break specific fuel consumption is obtained for E50 M50 blended fuel. It is found that CO and HC emission decreases with increases ethanol and methanol contents in the blends. The NOx emission decreases up to 30% (E30, M30) increment in the alcohols and after 30% it increased [9]. The engine torque increased with increasing compression ratio up to compression ratio 11:1, this increment in torque is about 8% as compared to the compression ratio 8:1 with E0 fuel. Break specific fuel consumption (BSFC) obtained minimum at compression ratio 11:1 with fuel E0. By increasing compression ratio generally exhaust gas temperature decreased. The most significant decrement in carbon monoxide (CO) observed at higher blended fuel like E40 and E50. The minimum CO emission was obtained at compression ratio 13:1 while engine was running on 5000 rpm speed. The highest decrement in HC emission was observed 9.9% and 16.45% for E40 and E60 [11].
EXPERIMENTAL SECTION
Experimental setup
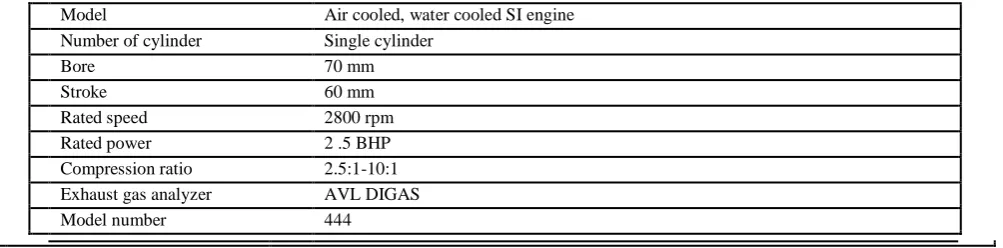
Experimental setup consist of four stroke single cylinder spark ignition (SI) engine connected to the DC machine, details are given below in table 1.
Table 1 specification of test engine
Model Air cooled, water cooled SI engine Number of cylinder Single cylinder
Bore 70 mm
Stroke 60 mm
Rated speed 2800 rpm Rated power 2 .5 BHP Compression ratio 2.5:1-10:1 Exhaust gas analyzer AVL DIGAS
Properties of ethanol/gasoline
The fuel (Methanol, ethanol and gasoline) used in this experimental study having physical and chemical properties given in table 2.
Chemical & Physical properties of fuel
Fuel property Gasoline Methanol Ethanol
Formula C7H14 CH3OH C2H5OH
Molecular weight(kg/mole) 110 32 46
Density(kg/m3) 765 792 789
Octane Number 88-100 107 108
Experimental procedure
The engine connected with DC machine and water rheostat to apply electric load on the engine. A series of experiments carried out with gasoline, various blends of ethanol -gasoline at different compression ratio. The fuel sample M0, M10, M20, M30, M40 E0, E10, E20, E30, E40 prepared for this experimental study and compression ratio were taken 6:1, 7:1, 8:1, 9:1, 10:1. Firstly engine set up at compression ratio 6:1, all fuel samples were tested at compression ratio 6:1 after that investigated at compression ratio 7:1, 8:1, 9:1 and 10:1. In this study performance and emission parameters like break power, fuel consumption, exhaust gas temperature, carbon monoxide (CO), and hydrocarbon (HC) studied. The engine was running at constant speed of 1500 rpm throughout all the tests.
Properties of fuel methanol used Fuel sample Gasoline % Ethanol % Auto ignition
temp (ºc)_
Flash point (ºc)_
Octane number Specific gravity
M0 100 0 246 -67 91 0.7474
M10 90 10 270 -44 94 0.7538
RESULTS AND DISCUSSION
Results obtained from this experimental study have shown in the form of graphs. In this study results discussed obtained for break power, fuel consumption, exhaust gas temperature, emission of hydrocarbon (HC) and carbon monoxide (CO). The effect of compression ratio on these performance parameters like engine break power, total fuel consumption, specific fuel consumption, thermal efficiency, exhaust gas temperature, emission of hydrocarbons (HC) and carbon monoxide (CO) have studied and compared graphically.
Effect of compression ratio on brake power
The effect of compression ratio on break power of engine have studied with various ethanol-gasoline blends (E0, E10, E20, E30 and E40) and compared graphically in Fig.1. In this study, for all fuel blends (excepting E30) as increasing compression ratio (CR) engine break power increased firstly up to compression ratio (CR) 8:1 and then decreased slightly. Maximum break power obtained for E40 fuel at all compression ratios (CR), maximum increment was obtained by 7.14% at CR 8:1 as compared to compression ratio 6:1. Minimum break power obtained for E10 fuel blend at CR 6:1, maximum increment obtained by 11.25 for M10 and 11.5% for E10 at CR 8:1 as comparison to the CR 6:1. Maximum increment was obtained by 14 .7% for E30 fuel at CR 8:1 as comparison to CR 7:1 in all fuel blends.
Variation of brake power with CR for Methanol
Variation in Fuel consumption at different compression ratio
The effect of compression ratio on fuel consumption rate is shown in Fig. 2, where fuel consumption rate compared graphically with respect to the compression ratio (CR). Fuel consumption rate decreased slightly as increasing compression ratio (CR), maximum decrement was obtained for E40 fuel by 5.9% at CR 7:1 as compared to CR 6:1. As ethanol contents in the gasoline increases fuel consumption
BR
A
K
E
P
O
W
ER
(W
A
TT
)
COMPRESSION RATIO
M0
M10
M20
M30
M40
Auto ignition Flash point Octane Specific Fuel sample Gasoline % Ethanol % temperature (0C) number gravity
(0C)
E0 100 0 246 -65 91 0.7474
E10 90 10 263 -42 93 0.7532
E20 80 20 279 -20 94 0.7605
E30 70 30 286 -16 96 0.7643
Variation of FCR at compression ratio (CR) for methanol
Variation of brake power with CR for ethanol
rate increased, minimum fuel consumption rate obtained for gasoline as compared to the all ethanol gasoline blended fuel. Slightly decrement was observed in fuel consumption rate as increasing compression ratio (CR) of the engine. The maximum decrement in fuel consumption was obtained by 15.5% for fuel E40 as compared to the fuel E30 at compression ratio 8:1. Maximum increment was observed by 51% for M40 and 36% for fuel E40 as compared to the fuel E0 at compression ratio (CR) 6:1
Variation of FCR at compression ratio (CR) for methanol
Variations in specific fuel consumption (SFC) with compression ratio (CR)
The effect of compression ratio (CR) on specific fuel consumption shown in Fig. 3, the fuel consumption rate per unit power is known as specific fuel consumption. Specific fuel consumption (SFC) increased as the ethanol proportion increases in ethanol-gasoline blend. The minimum specific fuel consumption obtained for gasoline fuel at compression ratio (CR) 9:1, the maximum decrement was obtained by 12.8% for M0 and E0 fuel at CR 9:1 as
FC
R
(g
/h
r)
Compression ratio (CR)
M0
M10
M20
M30
M40
Br
ake
p
ow
e
r
(w
at
t)
compression ratio (CR)
E0
E10
E20
E30
E40
FC
R
(g
/h
r)
Compression ratio (CR)
E0
E10
E20
E30
Variation of SFC with compression ratio (CR) For methanol and ethanol
The effect of compression ratio exhausts gas temperature
The effect of compression ratio (CR) on exhaust gas temperature shown in Fig.4, exhaust gas temperature was compared graphically with compression ratio (CR). Exhaust gas temperature decreased as the ethanol proportion in the ethanol -gasoline blend increases. Maximum decrement in exhausts gas temperature by 22.5% for M40 and 25% for E40 was obtained for fuel E40 as compared to fuel E0 at compression ratio (CR) 6:1. Maximum decrement in exhausts gas temperature by for M20 and 5.88 % was obtained for E20 fuel at CR 8:1 as compared to CR 7:1.
Variation in exhausts gas temperature with CR
Variation of HC at compression ratio (CR)
Emission variation of hydrocarbons (HC) with respect to compression ratio (CR) as shown in Fig.5, Emission of HC decreased as proportion of the ethanol increased in the blend, maximum decrement in HC emission11.5% for M40 by 13.9% was obtained for E40 fuel as compared to the E0 at compression ratio (CR) 9:1. Maximum decrement in HC emission by 4.95% was obtained for fuel E0 at CR 9:1 as compared to the CR 8:1. Maximum decrement for fuel E30 obtained by 7.37% at compression ratio (CR) 9:1 as compared to the compression ratio (CR) 8:1. Minimum variation in hydrocarbon (HC) emission was obtained for fuel E20 as compared to all other
SFC
(
g/
w
h
r)
Compression ratio (CR)
M0
M10
M20
M30
fuel blends, decrement of 12.3% was obtained for E20 fuel at compression ratio (CR) 10:1 as compared to the compression ratio (CR) 6:1. After doing analysis of fuel E30 it is noted that maximum reduction in hydrocarbon (HC) emission obtained at compression ratio (CR) 9:1 as compared to the compression ratio (CR) 8:1. It is noted that from the observations for fuel E10 minimum reduction by 2.32 % was obtained at compression ratio (CR) 8:1 as compared to the compression ratio (CR) 7:1. In general by increasing ethanol content in the gasoline, it decreases emission of hydrocarbon (HC) but at compression ratio (CR) 9:1 fuel E20 have more value of HC as compared to the fuel E1 monoxide (CO) produced by E40 at compression ratio (CR) 10:1.
Variation of HC with compression ratio (CR) for methanol
Variation of carbon monoxide emission (CO) at different compression ratio (CR)
The emission of carbon monoxide (CO) from engine is varying with compression ratio (CR) as shown in fig.6. As the compression ratio (CR) increases emission of CO decreased for all fuel blends, maximum and minimum decrement in CO emission was obtained for fuel E0 and
Variation of CO with (CR) Methanol
H
C
(
p
p
m
)
Compression ratio (CR)
M0
M10
M20
M30
M40
C
0
e
m
m
isi
on
Compression ratio (CR)
M0
M10
M20
M30
M40
H
C
X
(
p
p
m
)
Compression ratio (CR)
E0
E10
E20
E30
effects of ethanol gasoline fuel blends and compression ratio (CR) discussed in detail, the main conclusion can be summarized as below. The maximum break power was obtained for fuel E40 at CR 8:1 and at CR 6:1 maximum break power obtained for E0 and E30 fuel. Minimum brake power produced by E10 fuel at all the compression ratios. Minimum specific fuel consumption (SFC) obtained for E0 fuel at compression ratio (CR) 9:1. Exhaust gas temperature increased as the ethanol content in the blend increases and it is obtained minimum for E40 fuel in this experimental study. Emission of hydrocarbon (HC) and carbon monoxide (CO) decreased as the methanol, ethanol proportion increased in the blend. Minimum emission of hydrocarbon (HC) obtained at compression ratio 10:1 for M40 and E40 fuel and minimum emission of carbon monoxide (CO) produced by E40 at compression ratio (CR) 10:1. E20 at compression ratio (CR) 10:1 as compared to the CR 6:1. The CO emission for fuel M20, M30, E20 and E30 is almost equal at all compression ratios. Maximum decrement was obtained by 11.49% for gasoline at CR 9:1 as compared to the CR 8:1. It has been noted from the experiments maximum variation was obtained for fuel E0 at CR 10:1 as compared with the CR 6:1.
REFERENCES
1. Ahmetnecatiozesezn, Mustafa cannakci, “performance and combust-ion characteristics of alcohol-gasoline blends at wide open throttle” Energy 36 (2011) 2747-2752.
2. Wei-Dong Hsieh, Rong-Hong Chen, Tsung-Lin Wu, Ta-Hui Lin, “ Engine performance and pollutant emission of an SI engine using Ethanol gasoline blened fuel” Atmospheric environment 36 (2002) 403-410.
3. HakanBayraktar, “Experimental and theoretical investigation of us-ing gasoline-ethanol blends in spark ignition engines” Renewable energy 30 (2015) 1733-1747.
4. Serdar Yucesu, Adnan Sozen, Tolgan Topgul, Erol Acraklioglu, “ Comparative study of experimental analysis of spark ignition engine performance used ethanol-gasoline blend fuel. Applied Thermal En-Engineering 27 (2007) 358-368.
5. Rodrigo C. Costa, Jose R. Sodre, “Compression ratio effect on an ethanol/gasoline fuelled engine performance” Applied Thermal En-Engineering 31 (2011) 278-283.
6. Mustafa Kemal Balki, cenk sayin, “The effect of compression ratio on the performance, emission and combustion of an SI (spark ignit-ion) engine fueled with pure ethanol, methanol and unleaded gasol-gasoline. Energy 71 (2014) 194-201.
7. F. T. Ansari, A.P. Verma, Dr. Alok Choube, “Experimental determ-ination of suitable ethanol-gasoline blend for spark ignition engine” IJERT volume 1 issue 5, july 2012.
8. Mohsen Ghazikhani, Mohammad Hatami, Behrouz Safari, Davood Domiri Ganji, “Experimental investigation of exhaust temperature and delivery ratio effect on emission and performance of gasoline ethanol two-stroke engine. Case studies in thermal engineering 2 (2014) 82-90.
9. Simeon Iliev, “A coparision of ethanol and methanol blending with gasoline using 1-D engine model. Procedia engineering. 100 (2015) 1013-1022.
10. Sergio Manzetti, Otto Andersen, “A review of emission products f-productsfrom bio-ethanol and its blend with gasoline” Background new for emission control. Fuel 140 (2015) 293-301.
11. Huseyin Serdar Yucesu , Tolga Topgul, Can Cinar, Melih Okur, “ Effect of ethanol-gasoline blends on engine performance and exha-ust emission in different compression ratio. Applied thermal engin-26 (2006) 2272-2278.
12. Ali Turkcan, Ahmet Necati Ozsezen, Mustafa Canakci, “Experime-investigation of the effects of the direct injection parameters on a d-direct injection HCCI engine fuel with ethanol-gasoline fuel blend” Fuel processing technology 126 (2014) 487-496.
13. Cheolwoong Park, Changgi Kim, Young Choi, “Power output chara cteristics of hydrogen natural gas blend fuel engine at different co-compression ratio international journal of hydrogen energy 37 (201 8681-8687.
14. Gihun Lim, Sungwon Lee, Cheolwoong Park, Young Choi, Chang-gi Kim, “Effect of compression ratio on performance and emission characteristics of heavy duty SI engine fueled with HCNG” Interna tional ijournal of hydrogen energy 38 (2013) 4831-4838.
16. Fikret Yuksel, Bedri Yuksel, “The use of ethanol-gasoline blemd a-s as a fuel in an SI engine, “Renewable Energy 29 (2004) 1181-11 91.
17. Zlata Muzikova, Milan Pospisil, Gustav sebor, “Volatility and pha-se stability of petrol blends with ethanol” Fuel 88 (2009) 1351–135 6.
18. C.V. Ratnavathi, K. Suresh, B.S. Vijay Kumar, M. Pallavi, V.V. K-omala N. Seetharama, “Study on genotypic variation for ethanol production from sweet sorghum juice” biomass and bioenergy 34 (210)947–952.
19. Massimo Masi, “ Experimental analysis on a spark ignition petrol engine fuelled with LPG (liquefied petroleum gas)” Energy 14 (212) 251-260.
20. Robert K. Niven, “Ethanol in gasoline: environmental impacts and sustainability review article” Renewable and Sustainable Energy R eview 9 (2005) 535–555.
21. M. Al-Hasan, “ Effect of ethanol–unleaded gasoline blend on engi-ne performance and exhaust emission” Energy Conversion and Ma nagemant 44 (2003) 1547–1561.
22. G. Basavaraj P. Parthasarathy Rao, Kaushik Basu, Ch Ravinder Re Ddy, A. Ashok Kumar, P. Srinivasa Rao, B.V.S. Reddy, “ Assessin g Assessing viability of bio-ethanol production from sweet sorghu m in India” Energy Policy 56 (2013) 501–508.
23. Jyoti Parikh, Kirit Parikh, “India’s energy needs and low carbon op tions” Energy 36 (2011) 3650-3658. 24. Simeon iliev, A Compression of ethanol and Methanol gasoline using a 1-d Engine model “proceding