VOLUME 38, ARTICLE 64, PAGES 2027
,
2052
PUBLISHED 20 JUNE 2018
http://www.demographic-research.org/Volumes/Vol38/64/ DOI: 10.4054/DemRes.2018.38.64
Research Article
Contraceptive use and lengthening birth
intervals in rural and urban Eastern Africa
Catriona A. Towriss
Ian M. Timæus
© 2018 Catriona A. Towriss & Ian M. Timæus.
This open-access work is published under the terms of the Creative Commons Attribution 3.0 Germany (CC BY 3.0 DE), which permits use, reproduction, and distribution in any medium, provided the original author(s) and source are given credit.
1 Background 2028
1.1 Birth intervals and fertility change 2029
1.2 Birth spacing in sub-Saharan Africa 2030
1.3 Fertility change and contraceptive use in Eastern Africa 2031
2 Data and methods 2032
3 Results 2037
4 Discussion 2042
5 Acknowledgements 2046
Contraceptive use and lengthening birth intervals in
rural and urban Eastern Africa
Catriona A. Towriss1
Ian M. Timæus2
Abstract
BACKGROUNDThe transition towards low fertility has been slow in sub-Saharan Africa. Although increasing numbers of women are now using contraception, levels of unmet need for contraception remain high. And yet the dynamics of fertility are changing: national estimates have documented significant lengthening of birth intervals across the region.
OBJECTIVE
The aim of this paper is to explore trends in birth interval length by residence in Ethiopia, Kenya, Tanzania, and Zimbabwe, and the role of contraception in these changes.
METHODS
We conducted a birth interval analysis of fertility using up to six Demographic and Health Surveys from each country. We modelled age-order duration-specific period fertility using Poisson regression and calculated median birth interval lengths from the fitted rates using life-table techniques.
RESULTS
Birth intervals have lengthened in all four countries, most notably Zimbabwe. Urban populations now have median intervals that exceed 35 months in all four countries. The lengthening of birth intervals is associated with, although not limited to, the use of contraception. In urban areas the median birth interval among ever-users of contraception ranges between 52 and 86 months.
CONCLUSIONS
The increase in the length of birth intervals in Eastern Africa has been concentrated in urban areas. The trend is most pronounced among contraceptive users, but also results
1 University of Cape Town, South Africa. Email:[email protected].
from unreported forms of birth control. It might become even more pronounced if access to contraception were improved.
CONTRIBUTION
We show that lengthening of birth intervals in Eastern Africa has resulted largely from dramatic increases among urban women and women who have ever used contraception.
1. Background
Fertility dynamics in sub-Saharan Africa have been much discussed. While there is no doubt that the transition to low birth rates has begun, it has not proceeded at the pace seen in South America and Asia (Shapiro and Hinde 2017). Total fertility rates continue to be significantly higher than those observed elsewhere; recent estimates put the average in Eastern Africa at 4.9 children per woman (UN Population Division 2017). Furthermore, evidence from some countries suggests that the transition has slowed, with total fertility remaining near five children per woman (Bongaarts and Casterline 2012). This contrasts with the experience of other regions, where the speed of the fertility transition typically increased throughout its early stages. Fertility has remained high in the sub-Saharan region despite the steep decline in mortality, resulting in rapid population growth. In Eastern Africa, population is estimated to be growing at a rate of 2.8% per year and is projected to grow from 0.35 billion in 2010 to 0.89 billion in 2050 (UN Population Division 2017).
Southern Asia and Northern Africa, 11% in South East Asia, 16% in West Asia, and 10% in Latin America (UN Population Division 2017).
At the macro level, high fertility rates and the resulting rapid population growth impede efforts to reduce poverty, particularly in the face of increasing global environmental and climatic instability (Dasgupta and Dasgupta 2017; Eastwood and Lipton 2011; Turner 2009). With regard to contraception, low levels of prevalence and high levels of unmet need for family planning are often problematic, as they are associated with high levels of maternal and infant mortality and morbidity as well as unwanted pregnancy and unsafe abortion. This study explores trends in the dynamics of childbearing – specifically, birth intervals – in Eastern Africa since the 1970s and examines the role of contraception in these changes.
1.1 Birth intervals and fertility change
1.2 Birth spacing in sub-Saharan Africa
Birth spacing has long been a significant feature of reproductive dynamics in sub-Saharan Africa. Studies from a number of populations across the region have shown that short birth intervals are viewed as undesirable, as it is believed that pregnancy and breastfeeding reduce women’s biological resources. For example, in the Gambia it is believed that women have limited sustenance to pass on to a child. They are expected to space their births in order to maximise their physical strength, thereby ensuring that they can bear as many children as possible over their lifetime (Bledsoe et al. 1994). In northern Nigeria and Tanzania these beliefs have been found to remain pervasive; women who bear their children in quick succession are thought to be unable to take proper care of themselves or their child (Howard and Millard 1997; Wolf et al. 2008).
Traditionally, birth spacing in most African societies was controlled by three mechanisms: prolonged breastfeeding, postpartum abstinence, and polygyny. Intensive breastfeeding has been shown to suppress ovulation, thus acting as a form of contraception (Santow 1987). However, amenorrhoea does not usually last as long as breastfeeding, and in many sub-Saharan societies women were expected to abstain from sexual intercourse in the post-partum period (Lesthaeghe et al. 1981). In a 1954 survey of 51 African communities, 29 were found to subscribe to this social norm (Murdock 1954 cited in Egbuonu et al. 2005), although the preferred period of abstinence varied greatly between societies (Lesthaeghe et al. 1981). Postpartum abstinence was traditionally encouraged by the belief that spermatozoa poison breast milk, and so premature sexual intercourse was thought to be morally wrong. In Nigeria some women were separated from their partners in order to enforce post-partum abstinence (Caldwell and Caldwell 1981).
Increasing urbanisation, cultural change, and the use of contraception has loosened these traditional controls on birth intervals in many parts of sub-Saharan Africa. It is thought that the mid-20th century witnessed declines in birth interval length in many
1.3 Fertility change and contraceptive use in Eastern Africa
The phenomenon of lengthening birth intervals described above strongly suggests that, despite these changes, the spacing of births continues to be an important feature of family-building dynamics in sub-Saharan Africa. This article seeks to examine the phenomenon of birth interval lengthening in four countries in Eastern Africa: Ethiopia, Kenya, Tanzania, and Zimbabwe. It will then explore the relationship between lengthening birth intervals and contraceptive use in these four populations. We differentiate between urban and rural women, since national-level estimates of fertility have been shown to mask differences in the declines between urban and rural areas (Shapiro and Tambashe 2000; Shapiro and Tenikue 2017). Urban populations in this study become a lens through which to examine the nature of fertility dynamics in the region.
This study focuses on Eastern Africa for two reasons. First, fertility transition is well established in the region. Most countries in the region experienced a 10%–50% decline in fertility between 1960–1964 and 2000–2004, compared with West and Central Africa where a number of populations experienced an increase in fertility in the same time frame (Tabutin and Schoumaker 2004). Since longer birth intervals are associated (although not strongly) with lower levels of fertility (Bongaarts and Casterline 2012; Moultrie, Sayi, and Timæus 2012), it was necessary to carry out this study using data from populations that have witnessed a certain degree of fertility change. Second, the existing literature on birth interval lengthening has tended to focus to populations within Southern Africa; this study aims to contribute to this body of evidence through an examination of the phenomenon in Eastern Africa.
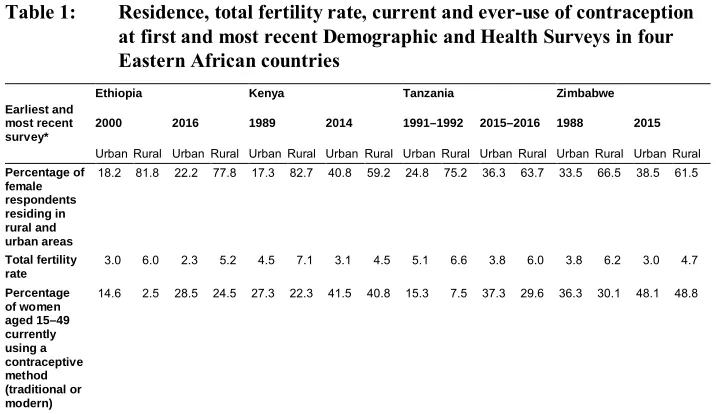
Zimbabwe, ranging from between 22.3% in rural Kenya to 36.2% in urban Zimbabwe. At the most recent survey, in both countries urban and rural areas had similar prevalence of contraceptive use: 41.5% and 40.8% in urban and rural Kenya, and 48.1% and 48.8% in urban and rural Zimbabwe.
Table 1: Residence, total fertility rate, current and ever-use of contraception at first and most recent Demographic and Health Surveys in four Eastern African countries
Ethiopia Kenya Tanzania Zimbabwe Earliest and
most recent survey*
2000 2016 1989 2014 1991–1992 2015–2016 1988 2015 Urban Rural Urban Rural Urban Rural Urban Rural Urban Rural Urban Rural Urban Rural Urban Rural Percentage of
female respondents residing in rural and urban areas
18.2 81.8 22.2 77.8 17.3 82.7 40.8 59.2 24.8 75.2 36.3 63.7 33.5 66.5 38.5 61.5
Total fertility rate
3.0 6.0 2.3 5.2 4.5 7.1 3.1 4.5 5.1 6.6 3.8 6.0 3.8 6.2 3.0 4.7
Percentage of women aged 15–49 currently using a contraceptive method (traditional or modern)
14.6 2.5 28.5 24.5 27.3 22.3 41.5 40.8 15.3 7.5 37.3 29.6 36.3 30.1 48.1 48.8
2. Data and methods
Table 2: Countries and Demographic and Health Surveys analysed
Ethiopia Kenya Tanzania Zimbabwe 2000 1989 1991–1992 1988
2005 1993 1996 1994
2011 1998 1999 1999
2016 2003 2004–2005 2005–2006 2008–2009 2010 2010–2011 2014 2015–2016 2015 Total no. of
maternities 174,466 146,045 120,176 69,375
The analysis of birth intervals using incomplete maternity history data – such as those in the DHS – requires carefully specified techniques because of problems arising from selection bias and the censoring of open-ended intervals (for a full discussion of these issues see Towriss and Timæus 2017). A number of approaches have been proposed to examine trends in birth intervals that are designed to control for the effects of selectivity and censoring. These include the life-table method (Hobcraft and McDonald 1984; Hobcraft and Rodríguez 1992; Rodriguez and Hobcraft 1980), a paired-cohort truncation approach (Brass and Juárez 1983), and the regression method approach (Moultrie, Sayi, and Timæus 2012; Towriss and Timæus 2017). This study adopts the third, regression model approach, since it is more straightforward and flexible than the Brass and Juárez approach and is statistically more powerful than the life-table approach.
closed intervals of non-limiters (Cleland and Rutstein 1986; Timæus and Moultrie 2008).
Thus, in the main, our analysis includes both open and closed intervals. Rather than use the mean as a summary indicator we calculate the unconditional median interval length – the duration at which half of the opened intervals are closed (with the remaining half of the intervals being either closed later or censored by interview of the mother). However, in order to facilitate comparisons between our results and other analyses, we present national-level estimates using conditional medians for closed intervals only as well as unconditional medians for all opened intervals.
In the regression model the outcome variable is the event of giving birth. All birth intervals (both open and closed) are then split into smaller exposure segments at 9, 18, 24, 30...66, 72, 84...144, and 180 months after birth. These segments reflect the distribution of births in the data set. All the intervals that remain open are censored at 240 months. These segments of the birth interval then become the unit of analysis and we model the number of births within each of the segments offset against the time that women spent exposed to the ‘risk’ of giving birth.
In order to adjust for selection on fecundity, variables specifying the order of each maternity and the mother’s age at the start of each exposure segment for all birth intervals must be included in the model (Moultrie, Sayi, and Timæus 2012). In addition, a variable was constructed that identifies the five-year calendar time period in which each segment of the birth interval began. Ethiopia’s period of observation begins later than that of Kenya, Tanzania, and Zimbabwe because its first survey occurred much later (see Table 2).
Table 3 illustrates how the regression models were built up. The first model was used to generate the duration-specific fertility rates which were used to calculate the median birth intervals at the national level. Model 1 includes the following variables and interactions: time since last birth, calendar time, and the key control variables (parity and mother’s age). A variable identifying whether a woman had ever been married was included in the model and was interacted with time, in order to allow the effect of a woman having ever been married to vary over time. In order to allow the distribution of interval lengths to change over time, interactions between calendar time and interval duration (measured continuously), interval duration squared, and the log of interval duration were included in the model (Timæus and Moultrie 2013; Towriss and Timæus 2017). Finally, to allow for the possibility of changes in parity-specific limitation, parity and calendar time were allowed to interact with each other.
of residence at the time of interview is the same as that of her place of residence at the birth of all of her children. As a result, there is a potential misclassification of residence in the analysis. In order to allow the level and shape of duration-specific fertility rates to vary between rural and urban women over time, two- and three-way interactions between this variable and interval duration, interval duration squared, the log of interval duration, and calendar time were added into the model. Last, parity is allowed to vary by a woman’s type of place of residence and by calendar time, in order to allow for differences in parity-specific limitation by women’s type of place of residence over time.
In Models 1 and 2, which present descriptive trends, no variable identifying a woman’s contraceptive use history was added into the model. Contraceptive use was assumed to be on the causal pathway between time and birth interval length; therefore, adding it into the model has the potential to remove a large amount of the change in the outcome of interest. Model 3 examines trends in the length of birth intervals by ever-use of contraception among rural and urban women. The variable identifying ever-ever-use of contraception was also interacted with residence, calendar time, and the three measures of interval duration and parity, to allow the effect that being an ever-user of contraception has on duration-specific fertility to vary over time.
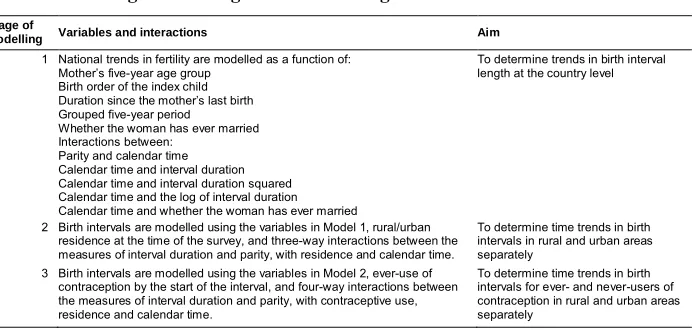
Table 3: Stages in the regression modelling of birth intervals
Stage of
modelling Variables and interactions Aim 1 National trends in fertility are modelled as a function of:
Mother’s five-year age group Birth order of the index child Duration since the mother’s last birth Grouped five-year period
Whether the woman has ever married Interactions between:
Parity and calendar time Calendar time and interval duration Calendar time and interval duration squared Calendar time and the log of interval duration Calendar time and whether the woman has ever married
To determine trends in birth interval length at the country level
2 Birth intervals are modelled using the variables in Model 1, rural/urban residence at the time of the survey, and three-way interactions between the measures of interval duration and parity, with residence and calendar time.
To determine time trends in birth intervals in rural and urban areas separately
3 Birth intervals are modelled using the variables in Model 2, ever-use of contraception by the start of the interval, and four-way interactions between the measures of interval duration and parity, with contraceptive use, residence and calendar time.
To determine time trends in birth intervals for ever- and never-users of contraception in rural and urban areas separately
died) at first use is not always known. Given that deaths of children are concentrated in early infancy, the number of living children that women had after each live birth was estimated by assuming that any child recorded in the birth histories as having died did so before the birth of their next-younger sibling. Thus, in instances where this assumption is unjustified we overestimate the parity at which the woman started using contraception. Take the example of a woman who initiated contraception between the births of her second and third children. Her first child dies, but not until after she has first used contraception. At the time of the survey the woman will report that she had two living children when she first began using contraception. In fact, she did begin using contraception at parity two. However, because we assume that the first child dies before the birth of the second child, if she reports having had two living children when she first used contraception, our procedure would record her first use as occurring at parity three.
In the most recent surveys of Ethiopia (2011 and 2016), Kenya (2014), and Tanzania (2010, 2015–2016), the variable identifying a woman’s number of living children at first use of contraception is unavailable. For these surveys we imputed parity-specific probabilities of being an ever-user for the closed intervals of women who had become ever-users by the time of the survey. We did this using a logistic regression model fitted to the earlier surveys for the same country with the following additional explanatory variables: women’s age and whether they were ever-married at the start of the interval, length of preceding interval, age at first birth, current contraceptive use, births in the last five years and last year, marital status, type of place of residence, and highest level of schooling at the time of interview. For the open-ended intervals, ever-use by current parity equals lifetime ever-use and so imputation is unnecessary.
3. Results
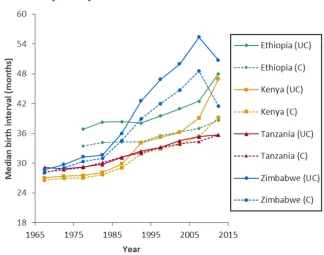
Figure 1 shows the trend in the median length of birth intervals by country between 1965 and 2010. In this figure we present both unconditional and conditional measures of the median birth interval length in order to document how the two measures relate to one another.
Figure 1: Unconditional (UC) and conditional (C) median birth interval length by country
Note: Estimates are presented for an ever-married woman who has three children and is aged 25–29.
Tanzania, the unconditional measure of median interval length has increased more than the conditional measure. However, median closed intervals have also increased significantly over the observation period. In Tanzania the two measures are almost identical over the observation period.
In the late-1960s, birth intervals in all the countries had a median length of between 27 and 29 months. Since then they have lengthened markedly. This trend was most pronounced in Zimbabwe, where the median birth interval increased from 31 months in 1980–1984 to 55 months for all intervals and 49 months for closed intervals in 2005–2009. (There appears to have been a decline in both the unconditional and conditional median birth interval lengths in the most recent time period in Zimbabwe.3)
Birth intervals have also lengthening significantly in Ethiopia and Kenya. In Ethiopia unconditional median birth intervals increased from 38 months in 1980–1984 to 48 months in 2010–2014, while the median closed interval increased from 34 to 39 months in the same time period. In Kenya both unconditional and conditional intervals measured 28 months in 1980–1984 and increased to 47 and 39 months (respectively) in 2010–2014. However, while the increase Tanzania since the 1980s has been less dramatic it is still substantial (6 months for both median interval measures). By the time of the most recent survey, the unconditional median interval in all four countries had increased by 6–19 months since 1980–1984, while the conditional medians had increased by 5–12 months.
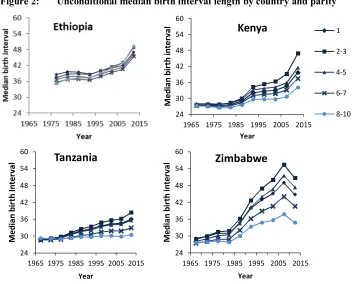
Figure 2 shows our examination of trends in unconditional median birth intervals among women of different parities. We find that after controlling for the effect of the age-related decline in women’s fecundity at the level of the population, rather little variation exists in birth interval length by parity. In particular, median intervals in the 1970s hardly varied at all by parity in any of the four countries. Since then they have lengthened at all parities. The median birth intervals of women with one child have risen by less than those with two to three children. Moreover, except in Ethiopia, the increase in the median interval length has been smaller among high-parity women than it has at the middle birth orders.
Figure 2: Unconditional median birth interval length by country and parity
Note: Estimates are presented for an ever-married woman aged 25–29.
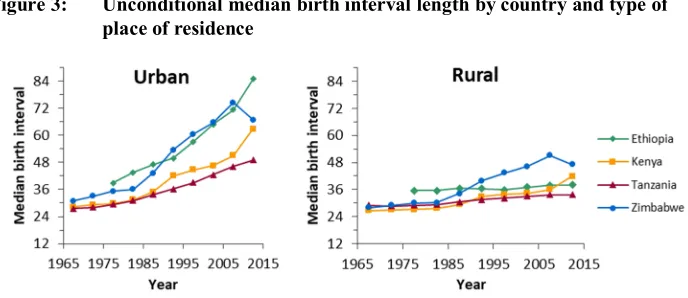
As fertility decline has been most rapid in urban areas and fertility decline and increasing birth interval length are often associated with each other, birth interval length was examined separately by type of place of residence. Figure 3 presents trends in median birth interval length over time by residence. As expected, it shows that birth intervals are significantly longer in urban than rural areas and that the trend toward longer median intervals has been more rapid in urban areas. Our model found statistically significant differentials in duration-specific fertility by place of residence in Ethiopia, Kenya, and Tanzania.
24 30 36 42 48 54 60
1965 1975 1985 1995 2005 2015
M ed ia n bi rt h in te rv al Year
Kenya
1 2-3 4-5 6-7 8-10 24 30 36 42 48 54 601965 1975 1985 1995 2005 2015
M ed ia n bi rt h In te rv al Year
Tanzania
24 30 36 42 48 54 601965 1975 1985 1995 2005 2015
Figure 3: Unconditional median birth interval length by country and type of place of residence
Note: Data is presented for an ever-married woman who has three children and is aged 25–29
By the most recent time period, the median birth interval in urban areas had risen to more than four years in Tanzania, more than five years in Kenya and Zimbabwe, and more than seven years in Ethiopia. With the exception of Zimbabwe, where a decline in birth interval length was observed between 2005–2009 and 2010–2014, the rapid increase in the median length of the birth interval shows little sign of slowing. By comparison, less change has been observed in most rural areas, although the median birth interval now exceeds 33 months in all four countries. The greatest change in rural areas has occurred in Zimbabwe, where the median interval lengthened by 19 months. There was a sharp increase in the median length of intervals in rural Kenya between 2005–2009 and 2010–2014, from 36 to 42 months. Little change has occurred in rural Ethiopia and Tanzania, with increases in interval length measuring 2 to 5 months over the observation period.
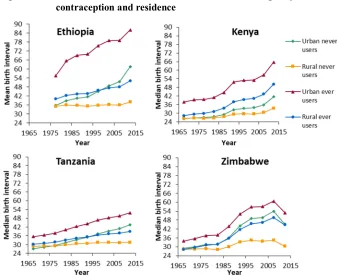
Figure 4 shows differential trends in birth interval length by residence and ever-use of contraception. The regression-based estimates presented are once again standardised on an ever-married women of parity three who is aged 25–29. In all four countries, intervals are longest among ever-users of contraception residing in urban areas. Conversely, intervals are shortest among rural women who have never used contraception. The intervals of urban ever-users are very long in all four countries, between 53 and 80 months. Our model finds these differentials to be statistically significant in Kenya and Zimbabwe.
Ethiopia. Indeed, the intervals of urban never-users of contraception are now longer than those or rural ever-users: 62 months versus 52 months. The intervals of rural never-users of contraception have not lengthened over time.
Figure 4: Trends in unconditional median birth interval length by ever-use of contraception and residence
Note: Data is presented for an ever-married women who has three children and is aged 25–29.
In Kenya, intervals are longest among urban ever-users of contraception (66 months), followed by rural ever-users (50 months) and urban never-users (42 months). The rate of change among these three groups has been comparable since the mid-1990s, with a lengthening of between 9–14 months between 1990–1994 and 2010–2014. The median birth intervals of rural never-users of contraception increased from 29 months in 1990–1994 to 34 months in 2010–2014.
months in the most recent period. The intervals of rural ever-users have also lengthened, although the pace of change has been slower: from 30–39 months over the observation period. The pace of lengthening among urban never-users of contraception has been greater than among rural ever-users. As a result, the intervals of this group of women are longer than those of rural ever-users of contraception by 6 months. There has been almost no change in the median interval length of rural never-users of contraception.
As with Kenya, the median intervals of all four sub-groups of women in Zimbabwe have increased over the observation period. The results also show a decrease in interval length in the most recent period. Intervals among urban ever-users have increased from 38 months in 1980–1984 to 61 months in 2005–2009. As in Tanzania, the pace of lengthening has been greater among urban never-users than among rural ever-users. The median birth interval length among both groups of women measured 32 months in 1980–1984; among urban never-users it measured 54 months in 2005–2009 while the corresponding figure for rural ever-users was 49 months. Like Kenya, the intervals of rural never-users have increased somewhat: from 28 months in 1980–1984 to 34 months in 2005–2009.
4. Discussion
lengthened across all parities in the four countries, confirming the finding of Moultrie, Sayi, and Timæus (2012).
The examination of birth interval length by type of place of residence has shown that birth intervals in urban areas are very long. Furthermore, the pace of change in urban areas has been significantly faster than that observed at the national level and shows few signs of levelling off or reversal (again, with the recent exception of Zimbabwe). Birth intervals were also found to have been lengthening in rural Eastern Africa; however, the speed of change in rural areas has been much slower. Comparing Figures 1 and 3, it is evident that the national-level trends toward longer intervals identified by previous research (Moultrie, Sayi, and Timæus 2012) have been heavily influenced by dramatic changes among a relatively small section of the population. This finding is consistent with the existing literature on this topic, which shows the differences in birth rates between rural and urban areas of sub-Saharan Africa to be large (Shapiro and Tambashe 2000). This is perhaps not unexpected: the original demographic transition theory stated that urbanisation brings about fertility change (Notestein 1945). However, this apparently innovative reproductive behaviour (very long birth intervals), which has so far been largely restricted to the urban areas of the region, may eventually diffuse into rural areas.
These findings must be interpreted within the limitations of the data on residence. During the interview, information is gathered on a woman’s type of childhood place of residence and her current type of place of residence. Therefore, potential exists for misclassification of residence at the time when a woman’s children were born: it cannot be assumed that women currently living in urban areas were living in an urban area at the time of the births of all their children. Indeed, between 14% (Ethiopia) and 25% (Zimbabwe) of respondents’ previous places of residence differed in type from their current place of residence. However, the misclassification of births will have attenuated rather than strengthened the rural–urban differences in birth interval length in our results.
We suspect that the recent reduction in birth interval length in Zimbabwe may result from bias in either the 2010–2011 or the most recent DHS survey estimates, rather than any real change in women’s reproductive behaviour. By contrast, the flattening out in the lengthening of birth intervals among contraceptive users in Kenya around the turn of the century is consistent with the notion that there was a stall in the decline in fertility in Kenya at about that time (Machiyama 2010; Westoff and Cross 2006). Our findings suggest that birth interval lengthening is associated with contraceptive use. And while we are unable to isolate the effect of modern contraceptive methods on birth spacing, factors such as extended breastfeeding or post-partum abstinence cannot explain the further lengthening of birth intervals in populations where most women already take more than two years to conceive. Indeed, opportunities for formal paid work make delayed conception through extended breastfeeding much less likely to impact upon reproduction in urban areas than in rural area. Thus, we believe that it is clear that intervals are lengthening because women are actively taking steps to ensure that they do. Therefore, despite Yeakey et al.’s (2009) ambivalent conclusion about the role of contraception in birth spacing, this study suggests that volitional birth control has had a major impact on the length of birth intervals in sub-Saharan Africa.
Although it is clear that the lengthening of birth intervals is concentrated among those women who have used contraception, our analysis does not enable us to quantify this impact. The DHS individual questionnaire data only allows identifying when in her birth history a woman first used contraception. It cannot be assumed that all women who have used contraception to delay one birth will continue to do so throughout their reproductive lives. Thus, the variable does not necessarily reflect whether women used a method during a particular parity-specific period of exposure. Moreover, the mapping of the woman’s reported number of living children at her first use of a method onto parity is somewhat approximate and overestimates that parity in cases in which one or more of the women’s children died after the birth of their younger sibling or siblings. Therefore, a respondent’s exact parity at first use is not always known. In the most recent surveys in all four countries this key question was not asked and this variable had to be imputed for lifetime ever-users, making the estimates of the effect of ever-use of contraception in the recent past in these countries even more approximate.
another method after contraceptive discontinuation is low in the four East African countries examined in this study (the lowest, 34%, in Tanzania; the highest, 44%, in Ethiopia) (Ali, Cleland, and Shah 2012). With the exception of Zimbabwe, these patterns of use, discontinuation, and switching make the results from the birth interval analysis even more striking. High levels of contraceptive discontinuation and low levels of switching would be expected to result in short birth intervals. It is possible that abortion is being used to terminate pregnancies resulting from inconsistent contraceptive use or failure, and that this may explain the apparent contradiction.
In light of this, further research on the relationship between birth interval lengthening and contraceptive use should make use of the DHS contraceptive use calendars, which record women’s births, pregnancies, foetal losses, and use of contraceptive methods for the five-year period prior to interview. These details are recorded on a month-by-month basis, which would allow researchers to determine the exact dates a woman started and stopped a contraceptive episode and to relate them more precisely to interval-duration-specific fertility.
While reported contraceptive use undoubtedly plays an important role in the observed lengthening of birth intervals, it cannot be the only important factor since intervals have also lengthened among women who report never having used contraception. Although it is not possible to account for the trend with any certainty, five factors are likely to be playing a part. The first is the weaknesses associated with the measure of ever-use of contraception that we have described above. However, the disproportionate increase in the length of the birth intervals among urban never-users relative to their rural counterparts suggests that either, second, some of them are covert users of contraception, or that, third, abortion is playing an important role in these trends. Fourth, it is also possible that there is underreporting of male-controlled methods such as male condoms (as opposed to female condoms) or coitus interruptus. Fifth, changes in women’s exposure to conception through intercourse may be an important factor in specific countries; in particular, the proportion of women in Zimbabwe who are widows has increased rapidly during the past two decades (ZIMSTAT and ICF International 2012). This may explain some of the increase in the duration of birth intervals among never-users of contraception in this population. Notwithstanding this, the evidence from the four countries suggests that is likely that the extent of birth control in urban Eastern Africa is being underreported in DHS surveys, even though it is not yet clear what form of birth control is being underreported.
intervals are concentrated among, but not limited to, women who report having used a modern method of contraception. Taken together with our findings on the relationship between education and interval lengthening (Towriss and Timæus 2017), we see that long birth intervals are undoubtedly a feature of the fertility transition in the region. The results of this study suggest that the trends of lengthening would be even more dramatic if access to contraception were improved. Furthermore, the association between long birth intervals and contraceptive use highlights women’s potential receptiveness to long-acting, reversible contraceptive (LARC) methods. This highlights the importance of family planning clinics providing a wide variety of contraceptive methods for women.
5. Acknowledgements
References
Ali, M.M., Cleland, J.G., and Shah, I.H. (2012). Causes and consequences of contraceptive discontinuation: Evidence from 60 demographic and health surveys. Geneva: World Health Organization.
Bledsoe, C.H., Hill, A.G., D’Alessandro, U., and Langerock, P. (1994). Constructing natural fertility: The use of Western contraceptive technologies in rural Gambia.
Population and Development Review 20(1): 81–113.doi:10.2307/2137631. Bongaarts, J. and Casterline, J.B. (2012). Fertility transition: Is sub-Saharan Africa
different? Population and Development Review 38(Supplement 1): 153–168.
doi:10.1111/j.1728-4457.2013.00557.x.
Brass, W. and Juárez, F. (1983). Censored cohort parity progression ratios from birth histories.Asian and Pacific Census Forum 10(1): 5–12.
Caldwell, J.C. and Caldwell, P. (1981). Function of child-spacing in traditional societies and the direction of change. In: Page, H.J. and Lestaeghe, R.J. (eds). Child spacing in tropical Africa: Traditions and change. London: Academic Press: 73–92.
Caldwell, J.C. and Caldwell, P. (2002). Africa: The new family planning frontier.
Studies in Family Planning 33(1): 76–86. doi:10.1111/j.1728-4465.2002.000 76.x.
Caldwell, J.C., Orubuloye, I.O., and Caldwell, P. (1992). Fertility decline in Africa: A new type of transition? Population and Development Review 18(2): 211–242.
doi:10.2307/1973678.
Casterline, J.B. and Odden, C. (2016). Trends in inter-birth intervals in developing countries 1965–2014. Population and Development Review 42(2): 173–194.
doi:10.1111/j.1728-4457.2016.00134.x.
Cleland, J.G., Onuoha, N., and Timæus, I. (1994). Fertility change in sub-Saharan Africa: A review of the evidence. In: Locoh, T. and Hertrich, V. (eds).The onset of fertility transition in sub-Saharan Africa. Liège: International Union for the Scientific Study of Population: 1–20.
Cleland, J.G. (2001). The effects of improved survival on fertility: A reassessment.
Population and Development Review 27(Supplement: Global Fertility Transition): 60–92.
Cohen, B. (1993). Fertility levels, differentials, and trends. In: Foote, K.A., Hill, K.H., and Martin, L.G. (eds). Demographic change in sub-Saharan Africa. Washington, D.C.: National Academy Press: 8–67.
Dasgupta, A. and Dasgupta, P. (2017). Socially embedded preferences, environmental externalities, and reproductive rights. Population and Development Review
43(3): 405–441.doi:10.1111/padr.12090.
DHS Stat Compiler (2017). DHS Stat Compiler [electronic resource].https://www.stat compiler.com/en/.
Eastwood, R. and Lipton, M. (2011). Demographic transition in sub-Saharan Africa: How big will the economic dividend be? Population Studies 65(1): 9–35.
doi:10.1080/00324728.2010.547946.
Egbuonu, I., Ezechukwu, C.C., Chukwuka, J.O., and Ikechebelu, J.I. (2005). Breast-feeding, return of menses, sexual activity and contraceptive practices among mothers in the first six months of lactation in Onitsha, South Eastern Nigeria.
Journal of Obstetrics and Gynaecology 25(5): 500–503. doi:10.1080/014436 10500171250.
Garenne, M.M. (2008). Fertility changes in sub-Saharan Africa. Calverton: Macro International (DHS Comparative Reports 18).
Garenne, M.M. and Joseph, V. (2002). The timing of the fertility transition in sub-Saharan Africa. World Development 30(10): 1835–1843. doi:10.1016/S0305-750X(02)00069-4.
Hobcraft, J.N. and McDonald, J. (1984). Birth intervals. Voorburg: International Statistical Institute (WFS Comparative Studies 28).
Hobcraft, J.N. and Rodríguez, G. (1992). Methodological issues in the life table analysis of birth histories. In: Hill, A.G. and Brass, W. (eds). The analysis of maternity histories. Liège: IUSSP: 53–95.
Howard, M. and Millard, A.Y. (1997). Hunger and shame: Child malnutrition and poverty on Mount Kilimanjaro. New York: Routledge.
Kirk, D. and Pillet, B. (1998). Fertility levels, trends, and differentials in sub-Saharan Africa in the 1980s and 1990s. Studies in Family Planning 29(1): 1–22.
Lesthaeghe, R.J., Ohadike, P.O., Kocher, J., and Page, H.J. (1981). Child-spacing and fertility in sub-Saharan Africa: An overview of issues. In: Page, H.J. and Lesthaeghe, R.J. (eds).Child-spacing in tropical Africa: Traditions and change. London: Academic Press: 2–23.
Lightbourne, R.E. (1985). Individual preferences and fertility behaviour. In: Cleland, J.G. and Hobcraft, J. (eds). Reproductive change in developing countries. Oxford: Oxford University Press: 165–198.
Machiyama, K. (2010). A re-examination of recent fertility declines in sub-Saharan Africa. Calverton: Measure DHS.
Moultrie, T.A., Sayi, T.S., and Timæus, I.M. (2012). Birth intervals, postponement, and fertility decline in Africa: A new kind of transition? Population Studies 66(3): 241–258.doi:10.1080/00324728.2012.701660.
Murdock, P.G. (1954).Our primitive contemporaries. New York: Macmillan.
Ndugwa, R.P., Cleland, J.G., Madise, N.J., Fotso, J.-C., and Zulu, E.M. (2011). Menstrual pattern, sexual behaviors, and contraceptive use among postpartum women in Nairobi urban slums. Journal of Urban Health: Bulletin of the New York Academy of Medicine 88(Supplement 2): S341–S355.
Notestein, F.W. (1945). Population: The long view. In: Schultz, T.W. (ed).Food for the world. Chicago: University of Chicago Press: 36–57.
Rodriguez, G. and Hobcraft, J.N. (1980). Illustrative analysis: Life table analysis of birth intervals in Colombia. Voorburg: International Statistical Institute (WFS Scientific Reports 16).
Ryder, N.B. (1985). The structure of pregnancy intervals by planning status.Population Studies 39(2): 193–211.doi:10.1080/0032472031000141446.
Santow, G. (1987). Reassessing the contraceptive effect of breastfeeding. Population Studies 41(1): 147–160.doi:10.1080/0032472031000142576.
Schoenmackers, R., Shah, I.H., Lesthaeghe, R.J., and Tambashe, O.B. (1981). The child-spacing tadition and the postpartum taboo in tropical Africa: Anthropological evidence. In: Page, H.J. and Lestaeghe, R.J. (eds). Child-spacing in tropical Africa: Traditions and change. London: Academic Press: 25–71.
Shapiro, D. and Tambashe, B. (2000).Fertility transition in urban and rural areas of sub-Saharan Africa. Paper presented at the Chaire Quetelet Symposium in Demography, Louvain-la-Neuve, Belgium, 2000.
Shapiro, D. and Tenikue, M. (2017). Women’s education, infant and child mortality, and fertility decline in urban and rural sub-Saharan Africa. Demographic Research 37(21): 669–708.doi:10.4054/DemRes.2017.37.21.
Tabutin, D. and Schoumaker, B. (2004). The demography of sub-Saharan Africa from the 1950s to the 2000s: A survey of changes and a statistical assessment.
Population59(3–4): 455–555.doi:10.3917/pope.403.0455.
Timæus, I.M. and Moultrie, T.A. (2008). On postponement and birth intervals.
Population and Development Review 34(3): 483–510.doi:10.1111/j.1728-4457. 2008.00233.x.
Timæus, I.M. and Moultrie, T.A. (2013). Distinguishing the impact of postponement, spacing and stopping on birth intervals: Evidence from a model with heterogeneous fecundity. Journal of Biosocial Science 45(3): 311–330.
doi:10.1017/S0021932012000648.
Towriss, C.A. and Timæus, I.M. (2017). Modelling period fertility: Schooling and intervals following a birth in Eastern Africa. Population Studies 72(1): 75–90.
doi:10.1080/00324728.2017.1370121.
Turner, A. (2009). Population priorities: The challenge of continued rapid population growth. Philosophical Transactions of the Royal Society B: Biological Sciences
364(1532): 2977–2984.doi:10.1098/rstb.2009.0183.
UN Population Division (2017).World population prospects: The 2017 revision. New York: United Nations, Department of Economic and Social Affairs.
Walters, S.L. (2008). Fertility, mortality and marriage in northwest Tanzania, 1920– 1970: A demographic study using parish registers [PhD thesis]. Cambridge: Cambridge University.
Westoff, C.F. and Cross, A.R. (2006). The stall in the fertility transition in Kenya. Calverton: Measure DHS.
Yeakey, M.P., Muntifering, C.J., Ramachandran, D.V., Myint, Y., Creanga, A.A., and Tsui, A.O. (2009). How contraceptive use affects birth intervals: Results of a literature review. Studies in Family Planning 40(3): 205–214. doi:10.1111/j. 1728-4465.2009.00203.x.