*Corresponding author: shafi[email protected] 63
Vol. 13, No. 3 (Summer 2016), IAChE
Optimization of Hydrogen Distribution Network by Imperialist
Competitive Algorithm
M. Omidifar1, S. Shafiei 1*, H. Soltani2
1Faculty of Chemical Engineering, Sahand University of Technology, PO Box 51335/1996, Tabriz, Iran 2Department of Chemical Engineering, Ahar Branch, Islamic Azad University, Ahar, Iran
ARTICLE INFO ABSTRACT
Article history: Received: 2015-02-24
Accepted: 2015-05-04
In modern refineries, hydrogen is widely used for the production of clean fuels. In this paper, a new method is presented in order to use hydrogen more effectively in refineries. This new method is based on combination of linear programming with imperialist competitive algorithm (ICA) in order to optimize the hydrogen distribution network. In this new approach, optimization is performed in two levels. In one level the hydrogen network layout is proposed by ICA and in the other level the total annual cost and utility are optimized by the linear programming. Thus, the minimum cost and the optimal configuration of the hydrogen distribution network are obtained. Finally, to illustrate the application of this method two cases are studied.
Keywords:
Linear Programming Optimization
Hydrogen Distribution Network
Clean Fuel
Imperialist Competitive Algorithm
1. Introduction
As crude oil becomes heavier, impurities (such as sulfur, nitrogen and aromatics) increase, the environmental regulations are intensified and the demand to produce clean fuels increases, and the consumption of hydrogen in refineries is increased [1]. There are two ways to reduce the hydrogen consumption: (1) to improve the design of every hydrogen consuming unit (2) to improve
distribution network. The second is
economically and environmentally effective [2].
The number of published papers on the
design and optimization of hydrogen
64 Iranian Journal of Chemical Engineering, Vol. 13, No. 3 purity. In this method it is assumed that each
stream containing hydrogen regardless of pressure can be sent to all consumers. In practice, this assumption is true only when the pressure is high enough [3,4]. Then, Liu and Hallale in 2001 offered a new mathematical approach to more effective use of hydrogen in refinery. This method is based on a superstructure that contains all possible connections, and the maximum hydrogen content of the plant is considered. It leads to a nonlinear programming (NLP) and
mixed-integer linear programming (MINLP)
problem. The main feature of this method is the use of pressure constraints and its calculation for existing equipment, which makes this method more efficient. Another advantage of this method is that the economic aspects such as payback time, the maximum total investment and total annual costs are calculated, as well as the correct way to consider a new compressor in order to avoid
unnecessary consumption of power
compression [5]. Zhang and Liu in 2004 proposed a systematic methodology to select appropriate purifiers from pressure swing adsorption processes, membranes or hybrid systems for recovering hydrogen from refinery off-gases. Through the understanding of the
trade-offs between hydrogen saving,
compression costs and capital investment, a superstructure is built to include possible purification scenarios [6]. Kumar in 2010 proposed a mathematical model for optimal hydrogen distribution based on pressure constraints, sources and sinks constraints, compressor flow rate recycle and purity constraints, flow combinations, hydrogen consumption, operating cost, capital cost,
payback period, etc. [2]. Sarabia in 2012 suggested an NLP technique to optimize the management of a complex network of hydrogen in refinery operations. The model can systematically reduce utility costs by increasing hydrogen recovery in consumer units and reduce production costs [7].
In the present work, by using a combination of ICA and linear programming (LP), refinery hydrogen management is investigated. In general, the sources and the sinks are identified and then superstructure is proposed by ICA. With known structure mass balance equations can be written and an LP model can be developed and solved. Finally, the least amount of total annual cost and the optimal structure is obtained.
2. Imperialist competitive algorithm
In this paper, imperialist competition
algorithm is used for the production and optimization of the hydrogen network structure. The goal of the optimization is to find the optimal values of the variables of the objective function. These variables can be
arranged as a vector of 1*N, where N is the
number of variables. In the genetic algorithm, this vector of variables is called the chromosome and in the ICA each vector represents a country. From a historical- cultural perspective, social and political characteristics of a country can be inspired from components of culture, language, economic structure and other characteristics. Therefore a country consists of various properties such as:
country = [p1, p2, p3, … , pNvar] (1)
Where each Pi represents one of the
Iranian Journal of Chemical Engineering, Vol. 13, No. 3 65 In this work each country represents a
potential solution to the problem. Therefore properties of the country are mapped to the
various variables of the network
configuration.
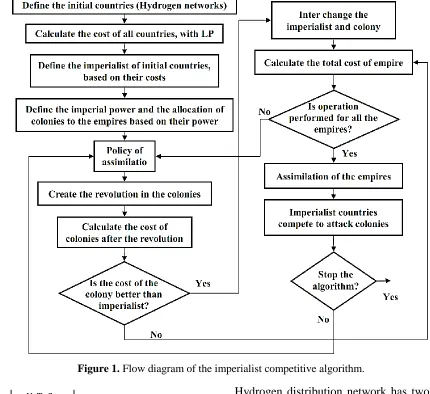
Fig. 1 shows the flowchart of the algorithm in this paper. The steps are as follows:
1. To start the algorithm, the number
Ncountry of initial countries (i.e., a
hydrogen network) is created. The variables are produced randomly [8,9].
2. In the next step, the cost of each of
these countries, to be described in section 3 of this paper, is calculated using the linear programming. Based on estimated costs, countries are sorted from the best to the worst. The best countries are to be assigned as imperialist [8,9].
3. Nimp members of the initial population
are selected as imperialists, Ncol of the
remaining countries are assigned as colonies and are possessed by an empire. Initially, a normalized cost is calculated for each empire [8,9]:
Cn= maxi{ci} − cn (2)
Where cn is nth imperialist cost, 𝑚𝑎𝑥𝑖{𝑐𝑖} is
the highest cost between imperialists and Cn is
normalized cost of the imperialist. An imperialist that has higher cost (weaker imperialist) will have a lower normalized cost. With normalized costs, normalized relative power of each imperialist as equation (3) is calculated, and based on this, the colonies are distributed between imperialists [8,9].
Pn= | Cn
∑ Ci
Nimp
i=1
| (3)
Therefore, the initial number of colonies of the imperialists will be equal to the equation
(4):
N. C.n= round{Pn. (Ncol)} (4)
Where N.C.n is the number of colonies of an
empire, Ncol is the number of colonized
countries in the initial population of countries.
Round is a function which returns the nearest
integer number [8,9].
4. After assigning colonies to the
imperialists, the total cost of each empire is calculated as follows:
T. C.n
= Cost(imperialistn)
+ ξ mean{Cost(colonies of empiren)} (5)
Where 𝑇. 𝐶.𝑛 is the total cost of nth empire
and 𝜉 is a positive number between zero and
one, usually close to zero is chosen. It is a parameter to consider a part of the cost of a colony in the overall cost of the empire [8,9]. In this paper, the value of 0.05 is considered. From this point decades begin.
5. At this point, the policy of assimilation
applies. In this policy, the colonies of the empire move to a new location
relative to the location of the
imperialist. The purpose of moving the colonies is to change the variables characteristics of each colony [8,9]. This change is made by defining a distance vector for each colony of the imperialist.
i n i
V Icountry Ccountry (6)
In this equation Vi is distance vector of ith
colony, Icountaryn, from nth imperialist,
Icountaryn.
Ccountryi and Icountryn are the positions of
66 Iranian Journal of Chemical Engineering, Vol. 13, No. 3 as:
i i i i
NCcountry Ccountry R V (7)
In this equation, 𝑁𝐶𝑐𝑜𝑢𝑛𝑡𝑟𝑦𝑖is the new
position of the ith Colony and Ri is a random
vector whose length is equal to the length of
Vi, and its elements are between zero and one.
Also, β is the absorption coefficient and is
usually greater than 1 and close to 2 [8]. In this paper, its value is considered 2.
6. After producing the new position of
each colony, a revolution may occur in some colonies of an empire [8,9]. The
number of countries where the
possibility of revolution exists can be calculated by the following equation:
. .
i n
NCR round N C (8)
Where 𝜔𝑖 is the revolution rate in ith decade
and 𝑁𝐶𝑅 is the number of colonies in an
empire in which the revolution will occur. The number of colonies in which revolution occurs, decreases over decades. To do this, the revolution rate correction is performed at the beginning of each decade:
1
i i
(9)
Where 𝜔𝑖+1 is the revolution rate in the (i+1)th
decade and λ is the damping ratio which is less than or close to one. In this paper, the value of 0.99 is chosen.
7. The next step is to calculate the cost of
these revolutionary states or countries. If the cost of one colony is better than the cost of the imperialist, the imperialist and the colony are inter changed [8,9]. Because of changes in the empires, overall cost of the empire is re-calculated by the equation (5) after revolution. Steps 5 to7 for all empires are repeated in each decade.
8. Assimilation: if the position of an
imperialist becomes weaker than
others, the empire with all of its colonies is absorbed to other empires. This is done as follows:
ij i j
V norm Icountry Icountry (10)
Where Vij is the norm of distance between ith
imperialist and jth imperialist. If its value is
less than some specified value which is a percentage of search space, the weaker empire is absorbed to the stronger one. The percentage of the search space is defined by VT as in equation (11):
-
V T norm ss ss ub lb
(11)
Where τ is the uniting threshold that is the
percentage of search space size, which enables
the uniting process of two empires i, j. The ss
is the algorithm search space of the problem variables which is obtained by the difference between the upper and lower boundaries of the problem variables.
9. Competition of empires to possess
weakest colony of the weaker empire. This is done by calculating the strength of other empires to possess the weakest colony of the weaker empire [8,9].
𝑁. 𝑇. 𝐶.𝑛= 𝑚𝑎𝑥𝑖{𝑇. 𝐶.𝑖} − 𝑇. 𝐶.𝑛 (12)
Where 𝑇. 𝐶.𝑛 is the total cost of nth empire and
𝑁. 𝑇. 𝐶.𝑛 is the normalized total cost of the empire. Each empire which has the lowest
T.C.n has the highest N.T.C.n. In fact, T.C.n
and N.T.C.n are equivalent to the total cost and
overall strength of an empire respectively. An empire with the lowest cost has the greatest
power. Having normalized total cost,
Iranian Journal of Chemical Engineering, Vol. 13, No. 3 67
Figure 1. Flow diagram of the imperialist competitive algorithm.
𝑃𝑃𝑛= |
𝑁. 𝑇. 𝐶.𝑛
∑ 𝑁. 𝑇. 𝐶.𝑖 𝑁𝑖𝑚𝑝
𝑖=1
| (13)
After determining the empire, the colony is detached from the weakest empire and is joined to the empire. If after detaching the colony no colony is left to the imperialist, the imperialist itself is joined to the empire [7]. Steps 5 to 9 are repeated till the end of selected number of decades. If in the course of decades only one empire remains or the cost of the empire does not change after some decades the algorithm ends [8].
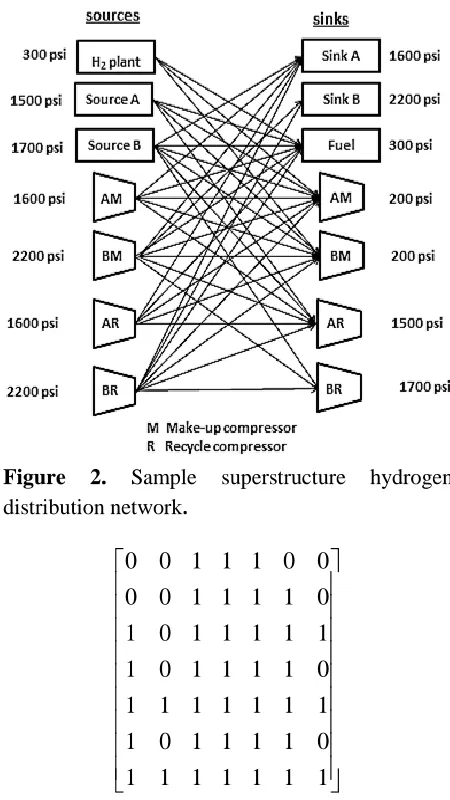
3. The structure of the hydrogen distribution network
Hydrogen distribution network has two types of variables, continuous variables such as flow rate, pressure and concentration and binary variables which determine configuration of the network. In this work linear programming (LP) is used to optimize continuous variables, while configuration variables are treated with Imperialist Competitive algorithm (ICA). ICA
initially produces feasible networks
considering pressure constraints in the network. Fig. 4 of reference [5] shows a
feasible network, Fig. 2 shows a
68 Iranian Journal of Chemical Engineering, Vol. 13, No. 3
Figure 2. Sample superstructure hydrogen
distribution network.
0 0 1 1 1 0 0
0 0 1 1 1 1 0
1 0 1 1 1 1 1
1 0 1 1 1 1 0
1 1 1 1 1 1 1
1 0 1 1 1 1 0
1 1 1 1 1 1 1
Figure 3: Matrix equivalent produced by ICA.
4. Problem constraints
Constraints of the problem are expressed as mass balances around sinks and sources of hydrogen as follows:
a) Mass balance in sinks: Feed entering
each sink has a specified flow rate and concentration, therefore sum of feed
entering and also sum of
concentrations of feed entering each sink is expressed as follows [2,5]:
∑ Fi,j= Fsink,j i
(14)
∑ Fi,jyi= Fsink,jysink,j i
(15)
b) Mass balance in the sources output:
Hydrogen can be sent to the to the sinks or fuel system; this means that the total flow rate out of each source is constant and can be expressed by [2,5]:
∑ Fi,j= Fsource,i j
(16)
c) Mass balance over the compressor:
compressors are considered as sinks or sources, but they differ in that the flow rate and purity of hydrogen is variable. Restrictions on the compressors are expressed as follows [2,5]:
c-1) Mass balance over compressor means that the gas flow rate entering the compressor must be equal to the flow rate exiting the compressor [2,5]:
∑ Fcomp,j= ∑ Fi,comp i
i (17)
c-2) The amount of hydrogen entering the compressor equals hydrogen exiting the compressor [2,5]:
∑ Fcomp,jycomp= ∑ Fi,compyi i
i
(18)
c-3) There is a maximum allowable flow rate for compressors due to design limitation [2,5]:
∑ Fi,comp≤ Fmax,comp i
(19)
It should be noted that equations (15) till (18) are nonlinear, therefore the system is nonlinear. To reduce the complexity of system these equations are expressed as linear equations by conveying multiplication of concentrations and flow rates as hydrogen flow rates.
5. Objective function
Iranian Journal of Chemical Engineering, Vol. 13, No. 3 69 cost) is considered as the objective function
and is expressed as [10,11]:
min 𝑇𝐴𝐶 = 𝐶𝐻2+ 𝐶𝑝𝑜𝑤𝑒𝑟− 𝐶𝐹𝑢𝑒𝑙+ 𝐴𝑓
× ( ∑ 𝐶𝑁𝐶 𝑛∈𝑁𝐶
+ ∑ 𝐶𝑝 𝑝𝑛𝑒𝑤
+ ∑ 𝐶𝑝𝑖𝑝𝑒 𝑝𝑖𝑝𝑒𝑛𝑒𝑤
)
(20)
Af = fi. (1 + fi) ny
(1 + fi)ny− 1 (21)
5.1. Operating cost
The operating cost includes the sum of the utility cost and the power consumption cost of compressors in the network minus the fuel cost [5,10]. It is expressed as follows:
5.1.1. Utility cost
This cost includes the cost of hydrogen produced by the hydrogen plant or the cost of hydrogen imported from other plants, which is directly proportional to the flow rate [5,6,10]:
CH2= ∑ eu× FHUu× tu
u∈NHU (22)
5.1.2. Compressor power cost
This is calculated by using the following
relation in which apower and bpower are known
power coefficients [5,6,10]:
Cpower= ∑ ek k
× powercompk× tk (23)
powercompk = apower((
pcompout k pcompk
in )
bpower
− 1)
× Fcompin k (24)
5.1.3. Fuel calorific value
The cost of the gas sent to the fuel system is calculated by heating value of gas. In this work, the gas is considered as a mixture of methane and hydrogen. The following
equation is used to calculate the fuel value per unit flow rate of gas [5,10]:
CFuel = eHeat× (yH2× ∆Hc,H2
° + (1 − y H2)
× ∆Hc,CH4
° )
(25)
5.2. Capital cost
Capital cost includes the cost of new compressors, new purifiers and piping. The relations of each are as follows [5,10]:
5.2.1. The new compressor cost
The investment cost of a new compressor added to the network is related to its power consumption and can be calculated from the following equation [5,10,12]:
𝐶NC= acap+ bcap× powerNC (26)
5.2.2. The new purifier cost
The cost of a new purifier is calculated from the following equation [5,10,13]:
𝐶p= ap+ bp× Fpin (27)
5.2.3. Piping costs
The cost of installation of a new pipeline is a function of length and square of its diameter:
𝐶𝑝𝑖𝑝𝑒= (𝑎𝑝𝑖𝑝𝑒+ 𝑏𝑝𝑖𝑝𝑒× 𝐷2) × 𝑙 (28)
The diameter squared, D2, of a pipe is
determined from the flow rate through it:
𝐷2=4 × F × ρ°
π × u × ρ (29)
Where u is the gas velocity in the pipe (usually 15-30 m/s), ρ is the density of the gas
at the design conditions and ρ° is the density
at standard conditions [5,10].
6. The first case study
The first case study was optimized for the first time with mathematical methods in 2001 by
Hallale and Liu [5], then in 2010 by Kumar et
al. [2]. As shown in figure twelve of reference
70 Iranian Journal of Chemical Engineering, Vol. 13, No. 3 consumers and two make-up compressors. All
hydrogen consumers except isomerization plant have internal recycle compressors. In this system hydrogen is supplied by hydrogen plant and catalytic reforming unit. Economic data and data of the sinks and the sources are given in Table 1 and Table 2 respectively. For this system, several restrictions are imposed by the refinery, including:
a) The maximum payback period is two
years for this network.
b) Only a new compressor and a new
purification unit can be added to the network.
c) In the case of using purification unit,
its waste must be sent to the fuel system.
The system was optimized in two versions; in the first version, optimization was performed without adding any new device in the network and in the second version, a new compressor was added to the system. Fig. (4) and (5) show the final network for the first and the second version respectively. The colored lines represent the new connections. In Table 3 the results obtained by this method were compared with results obtained by others. All costs are in (million dollars/year) and hydrogen consumed is in million standard cubic feet per day (MMscfd).
Table 1.
Economic data for the first case [2,5].
Operating cost Cost Capital cost Cost
Hydrogen cost 2000 ($/MMscfd) Compressor(k$) 115 + 1.91power(kw) Electricity cost 0.03 ($/kwh) PSA(k$) 503.8 + 347.4 feed flow(MMscfd)
Fuel cost 2.5 ($/MMBtu) Piping($/m) 3.2 + 11.42 D2(in2)
Table 2.
The data of the sources and the sinks for the first case [2,5].
Recycle Purge
Make-up
Process Flow rate
(MMscfd) Pressure (Psia) Purity Flow rate (MMscfd) Pressure (Psia) Purity Flow rate (MMscfd) 1.56 400 0.7 8.61 600 0.7597 11.31 DHT 36.75 350 0.75 3.47 500 0.8653 8.21 CNHT 3.6 350 0.65 4.32 500 0.75 8.65 JHT 3.59 200 0.6 6.55 300 0.7144 12.08 NHT - - - - 300 0.75 0.04 IS4 85.7 1200 0.75 11.29 2000 0.92 38.78 HCU
H2 supply
Pressure (psia) Purity
Max flow (MMscfd) Flow (MMscfd)
300 0.92
50 45
H2plant
300 0.75
23.5 23.5
Iranian Journal of Chemical Engineering, Vol. 13, No. 3 71
Figure 4. The final form of the first case, without
adding a new device.
Figure 5. The final form of the first case, with a
new compressor.
Table 3.
Comparison of the results with others. Hydrogen
consumed Operating cost Capital cost Total annual cost Payback
The system studied 45.62208 22.5 - 22.5 -
The results of Ref.[5] 35.4 19 5 24 1.4
The results of Ref. [2] 45.10778 21.90416 0.38324 22.2874 0.643
The results obtained in
this work (first state) 39.38 17.0595 - 17.0595 -
The results obtained in
this work (second state) 38 17.16321 3.05393 20.21714 0.572
Fig. (6) and (7) represent the best cost and the average cost of structures versus the number of decades for the first and the second versions of the first case. The best structure for the first version was obtained after 24 decades and for the second case after 9 decades. The parameters used in ICA for the first case study are shown in Table 4.
In the present work, for the first version, optimum use of an output from a process in other processes resulted in 24% reduction in the cost compared to the base case. In the second version, the optimization added a new compressor. The compressor output is divided into three branches, two branches are sent
directly to the units NHT and ISO4. The third branch after passing through the second compressor (C2) is used in DHT and JHT. The results obtained in this case show that total annual cost is reduced 9.3% and 15.7% relative to the reference [2] and the reference [5] respectively.
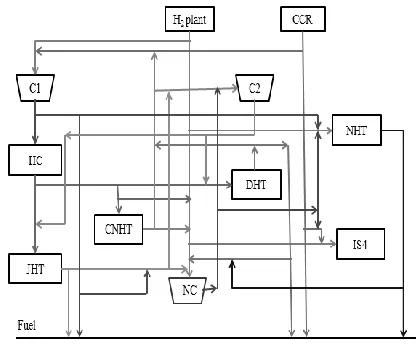
The second study was selected from reference [10], which was designed in 2014 by
Deng et al. as shown in Fig. (8). The system
consists of five hydrogen consuming
72 Iranian Journal of Chemical Engineering, Vol. 13, No. 3
Figure 6. The average cost and the best cost obtained versus the number of
decades (the first state).
Figure 7. The average cost and the best cost obtained versus the number of
decades (the second state).
Table 4.
Parameters used in imperialist competitive algorithm for the first case study. Ndecade Ncol
Nimp Ncountry
𝜔
β λ
ζ
30 25
5 30
0. 5 2 0.99 0.05
respectively. Catalytic reforming unit is considered as an internal source of hydrogen and fresh hydrogen is supplied by the hydrogen plant. Data of the make-up compressors, the sinks and the sources of system are given in Tables 5 and 6
respectively. Economic data are shown in Table 1.
Iranian Journal of Chemical Engineering, Vol. 13, No. 3 73
Figure 8. Hydrogen network for the second case study [10].
Table 5.
Data of the make-up compressors [10].
/h) 3 Maximum capacity(Nm Discharge pressure(MPa) Inlet pressure(MPa) Compressor 35154 13.79 2.069 K1 35154 13.79 2.069 K2 35154 4.138 2.069 K3 Table 6.
Data of the sources and the sinks for the second case study [10].
Pressure(M Pa) Purity ) 2 (V%H Maximum flow /h) 3 rate(Nm Current flow /h) 3 rate(Nm Sinks Sources FUEL NHT DHT RHT GOHT HCU 2.069 95 89280 89280 8597 38965 41718 HP 2.069 80 16182 15978 4818 11160 CRU 8.276 80 9099 9099 3031 6068 HCU 2.414 75 11597 11597 11597 GOHT 2.759 75 10846 10846 6466 4380 RHT 2.414 65 1600 1600 1600 DHT 1.379 60 2495 2495 2495 NHT 30007 4380 6068 19757 38965 41718 flow /h) 3 rate(Nm 75 80 90 93.2 95 Purity ) 2 (V%H 2.069 3.448 4.138 3.448 13.79 Pressure (MPa)
system was added to the network. A purification system improves the quality of
74 Iranian Journal of Chemical Engineering, Vol. 13, No. 3 first and the second version respectively. The
colored lines represent the new connections. In Table 7 the results obtained by this method were compared with results obtained by
others. All costs are in (million dollars/year) and hydrogen consumed is in normal cubic
meters per hour (Nm3/h).
Figure 9. The final form of the second case, without new device (the first version).
Figure 10. The final form of the second case, with a new purifier (the second version).
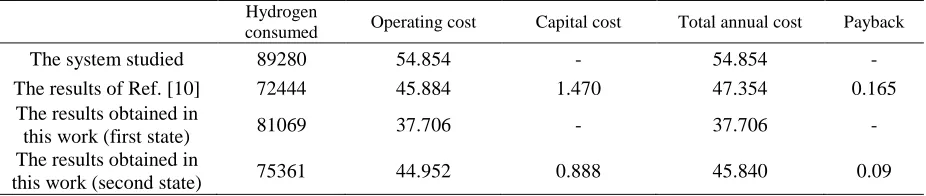
Table 7.
Comparison with literature for the second case study. Hydrogen
consumed Operating cost Capital cost Total annual cost Payback
The system studied 89280 54.854 - 54.854 -
The results of Ref. [10] 72444 45.884 1.470 47.354 0.165
The results obtained in
this work (first state) 81069 37.706 - 37.706 -
The results obtained in
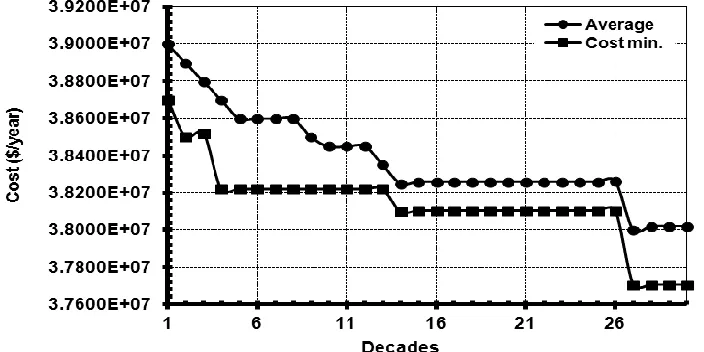
Iranian Journal of Chemical Engineering, Vol. 13, No. 3 75 Fig. (11) and (12) represent the best cost and
the average cost of structures versus the number of decades for the first and the second versions of the second case. The best structure
for both versions was obtained after 27th
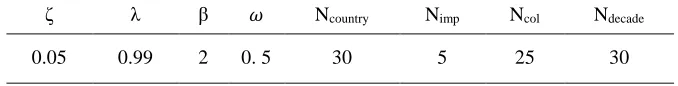
decade. The parameters used in ICA for the second case are shown in Table 8.
Deng et al. added a purification system to
optimize the network. This caused a reduction of 7.5 million dollars. In the present work, at first, optimum use of the output of one process was optimized in other processes without adding a new device system. The result indicates reduction of 31.3% in total
Figure 11. The average and the best cost versus the number of decades (the first version).
Figure 12. The average and the best cost versus the number of decades (the second version).
Table 8.
Parameters used in imperialist competitive algorithm for the second case study.
Ndecade Ncol
Nimp Ncountry
𝜔
β λ
ζ
45 24
4 28
0. 5 2
76 Iranian Journal of Chemical Engineering, Vol. 13, No. 3 annualized cost compared with the base case.
In the second version a purification system is used to purify hydrogen outlet of sources. The purified product stream is divided into two branches, the first branch enters the NHT unit directly and the second branch, after passing through three compressors is used in other processes. The cost obtained from the second version shows 3.2% reduction relative to the
work of Deng et al.
8. Conclusions
In this work Imperialist Competitive
Algorithm was coupled with linear
programming (LP) to optimize hydrogen distribution network. The main advantage of the algorithm used in this work is higher speed to find optimal solution and to produce
feasible structures by considering all
constraints imposed on the network.
Comparing the results with those in the literature, it seems that lower cost for network can be obtained by the suggested method. This reduction in cost is attributed to optimal use of new connections between sources and sinks and also new devices.
Nomenclatures
Af annualizing factor for investment cost for new unit
A capital cost coefficient B capital cost coefficient eheat unit cost of heat energy
eu unit price of the uth hydrogen utility
ek unit cost of power for k th
compressor
fi fractional interest rate per year
F flow rate
ny number of years for depreciation Powerk power for kth compressor
tk
annual operating time for kth
compressor tu
annual operating time for the uth
hydrogen utility
TAC total annualized cost
Y hydrogen purity
∆𝐻𝑐° standard heat of combustion
Abbreviations
CNHT Cracked Naphtha Hydro-Treater
CR or CCR Catalytic Reforming
DHT Diesel Hydro-Treater
GOHT Gas Oil Hydro-Treater
HP Hydrogen Plant
HC Hydro-Cracker unit
IS4 Isomerization
JHT Jet Hydro-Treater
NHT Naphtha Hydro-Treater
PSA Pressure Swing Adsorption
RHT Residue Hydro-Treater
Subscripts
comp compressor
J index for hydrogen sink I index for hydrogen source
Inlet Inlet
K index for compressor
Max maximum
NHU set of hydrogen utilities NC index for new compressor
Out Outlet
P index for purifier
Iranian Journal of Chemical Engineering, Vol. 13, No. 3 77
References
[1] Jiao, Y. Q. Su, H. Y. and Hou, W. F., "Improved optimization methods for refinery hydrogen network and their
applications", Contr. Eng. Prac., 20 (10),
1075 (2012).
[2] Kumar, A. Gautami, G. and Khanam, S., "Hydrogen distribution in the refinery
using mathematical modeling", Energy,
35 (9), 3763 (2010).
[3] Alves, J., "Analysis and design of refinery hydrogen systems", Doctor of Philosophy, UMIST, UK, (1999).
[4] Linnhoff, B., "Pinch analysis—a
state-of-art overview", Chem. Eng. Res. Des., 71
(A5), 503 (1993).
[5] Hallale, N. and Liu, F., "Refinery hydrogen management for clean fuels
production", Adv. Environ. Res., 6 (1), 81
(2001).
[6] Liu, F. and Zhang, N., "Strategy of
purifier selection and integrationin
hydrogen networks", Chem. Eng. Res.
Des., 82 (10), 1315 (2004).
[7] Sarabia, D. de Prada, C. and Gomez, E.,
"Data reconciliation and optimal
management of hydrogen networks in a
petrol refinery", Control. Eng. Pract., 20
(4), 343 (2012).
[8] Atashpaz-Gargari, E., "Social ptimization
algorithm development and performance review", MS Thesis, School of Electrical and Computer Engineering, Tehran University, (2009).
[9] Atashpaz-Gargari, E. and Lucas, C., "Imperialist competitive algorithm: An algorithm for optimization inspired by
imperialistic competitive", in IEEE
Congress on Evolutionary Computation
(CEC), 4661 (2007).
[10] Deng, C. Pan, H. Li, Y. Zhoua, Y. and Fengc, X., "Comparative analysis of different scenarios for the synthesis of
refinery hydrogen network", Appl.
Therm. Eng., 70 (2), 1162 (2014).
[11] Zhou, L. Liao, Z. Wang, J. Jiang, B. and Yang, Y., "Hydrogen sulfide removal
process embedded optimization of
hydrogen network", Int. J. Hydrogen
Energ., 37 (23), 18163 (2012).
[12] Peters, M. S. and Timmerhaus, K. D., "Plant design and economics for chemical
engineers" , 4th ed., McGraw-HillBook
Co., p. 910 (1991).
[13] Towler, G. P. Mann, R. Serriere, A. J. L. and Gabaude C. M. D., "Refinery hydrogen management: cost analysis of
chemically-integrated facilities", Ind.
![Table 2. The data of the sources and the sinks for the first case [2,5]. Make-up](https://thumb-us.123doks.com/thumbv2/123dok_us/8886948.1823022/8.612.71.547.473.707/table-data-sources-sinks-case-make.webp)
![Table 5. Data of the make-up compressors [10].](https://thumb-us.123doks.com/thumbv2/123dok_us/8886948.1823022/11.612.104.511.331.391/table-data-of-the-make-up-compressors.webp)