ISSN 1946-7664. MCFNS 2011 AVAILABLE ONLINE AT HTTP://MCFNS.COM Submitted: May 31, 2010
Vol. 3, Issue 2, pp. 75–86 Accepted: Dec. 01, 2010
Mathematical and Computational Published: Aug. 28, 2011
Forestry & Natural-Resource Sciences Last Correction: May 11, 2011
AN INTEGRATED MCDA SOFTWARE APPLICATION FOR
FOREST PLANNING: A CASE STUDY IN SOUTHWESTERN
SWEDEN
Anu Korosuo, Peder Wikstr¨
om, Karin
Ohman, Ljusk Ola Eriksson
¨
Department of Forest Resource Management, Swedish University of Agricultural Sciences (SLU), 90183 Ume˚a, Sweden
Abstract. Forest planning in Sweden today translates not only into planning of timber production,
but also for the provision of other functions and services. Multi-criteria decision analysis (MCDA) methods provide a way to take also non-monetary values into account in planning. The purpose of this study was to gain experience on how to use a forest decision support system combined with an MCDA tool in practical forestry. We used a new forest planning tool, PlanWise, which includes an integrated MCDA module, PlanEval. Using the software, the decision maker can compare different forest plans and evaluate them against his/her objectives in a structured and analytical manner. The analysis thus provides a ranking of the alternatives based on the individual preferences of the decision maker. PlanEval and the MCDA planning process are described in a case study, where the manager of a forest estate in southwestern Sweden used the program to compare different forest plans made for the estate. In the paper, we analyze possibilities and challenges of this approach and identify problems such as the adherence to formal requirements of MCDA techniques and the difficulty of comparing maps. Possibilities to expedite an MCDA planning process further are also discussed. The findings confirm that integration of an MCDA tool with a forest decision support system is valuable, but requires expert assistance to be successful.
Keywords: AHP, case study, forest decision support system, Heureka, multi-criteria decision anal-ysis
1
Introduction
The planning of Swedish forests has until recently pre-dominantly meant the planning of timber production. However, as interest is increasingly directed also toward non-timber forest values, new approaches for planning are needed. Instead of considering only economic objec-tives, other goals such as conserving pleasant scenery or increasing the possibilities for recreation may be relevant to include in the forest plan. Attention has been paid to multi-resource management by non-industrial private forest owners in Sweden (Ingemarsson et al. 2006). The largest Swedish forest owner, Sveaskog, has also stressed the importance of marketing other values of the forest besides timber (Sveaskog 2010).
Inclusion of several incommensurable interests implies that one needs to strike a delicate balance between dif-ferent objectives in the forest plan. Multi-criteria deci-sion analysis (MCDA) is one method for bringing more than one objective into the planning process and analyz-ing the relative importance of different objectives. An
MCDA process generally starts by structuring the prob-lem into objectives and criteria; continues by generat-ing alternatives and then assessgenerat-ing the importance and weight of the objectives and alternatives involved; and results in an overall ranking of the alternatives according to the preferences of the decision maker (e.g. Belton and Stewart 2001, Kangas and Kangas 2005). In addition to choosing a preferred course of action, a principal benefit of MCDA is that it facilitates the decision maker’s learn-ing about different values and objectives. One common classification of MCDA approaches makes a distinction between Multi Attribute Decision Making (MADM) and Multi Objective Decision Making (MODM) (Mendoza and Martins 2006). The main difference between these two approaches is that, whereas MADM methods are concerned with ranking a finite number of alternatives, MODM approaches are concerned with finding solutions to optimizing problems with several objective functions and a set of constraints. Examples of MADM methods are direct point allocation, the Analytical Hierarchical Process (AHP), and outranking methods. One of the
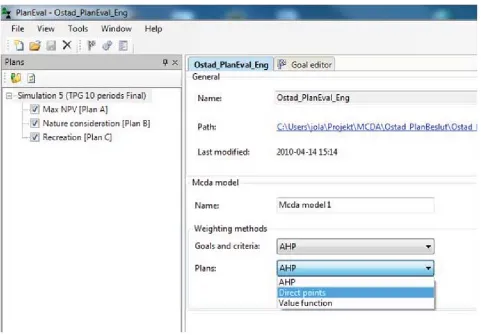
Figure 1: Starting view in PlanEval.
most well-known MODM methods is goal programming. (For an introduction of methods in a forestry setting, see Kangas et al. 2008.)
Forest planners have used computers since the 1960s to assist in planning (Martell et. al. 1998). Comput-ers have been especially useful for solving optimization problems in long-range planning at the forest level where the planning horizon tends to extend over one or more forest rotations. As operations research methodologies have found use in forest decision support systems (DSSs) (Gunn 2007) and there are a number of well-established MCDA methods available in forestry, one would expect that MCDA tools would be a common feature in forest DSSs. However, this does not seem to be the case. Of a total of 56 unique forest DSSs documented by FORSYS (2010) and NCS (2010), there are many systems that present data on a variety of forest products and services, but only five with built-in MCDA techniques (Monsu, MONTE, DSD, EMDS and Heureka). The Finnish sys-tem Monsu, and its Spanish counterpart MONTE, are long-term forest planning systems that may be used to solve MODM problems interactively (Pukkala 2004). Monsu and MONTE are also the only systems with
land-scape visualization capabilities, although these functions are not integrated with the MCDA interface. EMDS provides decision support for landscape-level analyses (Reynolds et al 2008; EMDS 2010; FORSYS 2010). It implements the AHP and Simple Multi-Attribute Rat-ing Technique (SMART) to support the prioritizRat-ing of management activities on the basis of an objective hier-archy defined by the user. EMDS is static and cannot make long-term projections. DSD (Decision Support Dobrova) v1.1 is specifically concerned with the long-term analysis of species mixtures of stands under dif-ferent scenarios and stand treatment schedules (Lexer et al. 2005). The user sets weights for three given top-level objectives –timber production, nature conser-vation, biodiversity– employing the AHP method while the weights for the lower-level objectives of the hierarchy are fixed.
Korosuo (2011)/Math. Comput. For. Nat.-Res. Sci. Vol. 3, Issue 2, pp. 75–86/http://mcfns.com 77
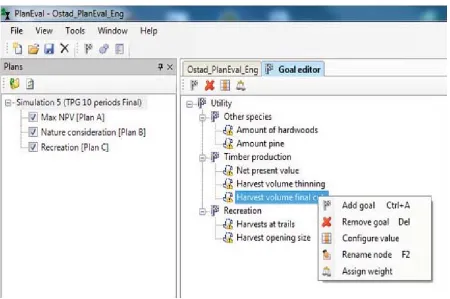
Figure 2: Objective hierarchy of the case study.
and is directly linked to PlanWise. This integration of the MCDA methodology to the forest planning system into PlanWise has features that are not fully replicated in any of the mentioned forest DSSs; it is designed for MADM problems (contrary to Monsu/MONTE), offers greater flexibility than DSD as regards attributes and their representation, and works with an extended plan-ning horizon, which provides an additional dimension compared with the static analysis of EMDS.
An alternative to integrating the tool for MCDA with the forest DSS is to use separate MCDA software such as Mesta (Hiltunen et.al. 2009), HiView, V.I.S.A., Expert Choice, or Web-HIPRE (see French and Xu 2005 for a comparison of different software). However, the user must then prepare separately the data needed for the analysis. This is something that takes time, could induce errors, and limits the possibility of switching attributes during the choice process.
The objective of this study is to gain experience in how to use a forest decision support system combined with an MCDA tool in practical forestry. This was done by applying PlanWise and PlanEval to the planning pro-cess of developing a long-term plan for a forest estate in Southwestern Sweden. In the next chapter, PlanWise and PlanEval are described briefly. Thereafter, the dif-ferent phases of the case study are explained, and a
dis-cussion and conclusions presented on the basis of the case study.
2
MCDA in PlanWise
of the decision maker are first arranged in a hierarchical structure (Figure 2). The alternative plans are then eval-uated with respect to each objective, and the objectives compared to find their relative weights. In direct point allocation, the user distributes a total of 100 points in each comparison of alternatives and objectives. In the AHP, pairwise comparisons of alternatives and objec-tives are made on a preference scale of 1 to 9. According to this scale, a score of 1 means equal preference over the choices and 9 means an extremely strong preference of one choice over another. Finally, a ranking of the plans to their order of preference is acquired. It is possible to use the AHP and direct point allocation in the same analysis, for example by using the AHP to compare the objective weights and direct point allocation to compare the plan alternatives.
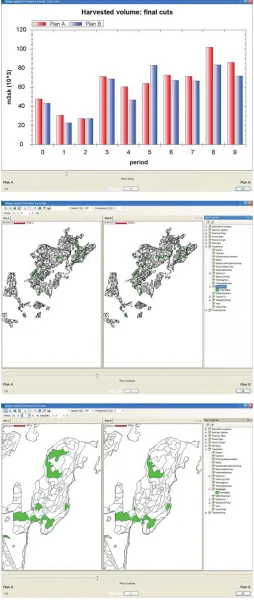
PlanEval is directly connected to PlanWise during the analysis, and the user is thus free to choose the most rep-resentative variable for each objective among the hun-dreds of data items calculated in PlanWise (Figure 2). This is done via the “configure value” function in the program. Here, it is also possible to choose the desired planning periods and to set values for objectives through the keyboard. There are a number of ways to visualize the data; different variables may be assessed as scalars, graphs or maps (Figure 3). Bar graphs show the tempo-ral pattern of the variable over the chosen periods. In the map view, the user may create simple thematic maps of the variables, as well as zoom in on and out of the map as desired. Temporal changes can be assessed by switching between different planning periods. The choice of the variable or its representation method is not fixed; the user may, for instance, first analyze the objective with respective to one representation, then select another rep-resentation, and only thereafter state his/her preference.
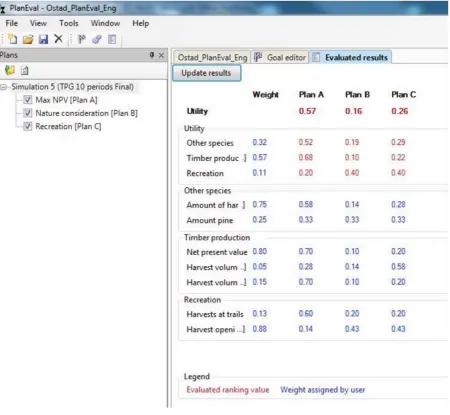
The results of the analysis are presented in a results table (Figure 4). The overall scores for the alternatives are given on the uppermost row, and the subtotals of the evaluated weights in the matrix below. The result table gives the user-given values in blue and method-calculated sums in red. This should help the user un-derstand the effects of single comparisons on the overall analysis. If desired, the user can then return to the com-parison and adjust single weights. There is currently no support for sensitivity analysis or the computation of consistency ratios in PlanEval.
3
Case study
3.1 Planning area and planning process The multi-criteria analysis was performed on a forest estate in southwestern Sweden (Figure 5). The objective of the analysis was to produce alternative multiple-use
Korosuo (2011)/Math. Comput. For. Nat.-Res. Sci. Vol. 3, Issue 2, pp. 75–86/http://mcfns.com 79
Figure 4: Results table.
est management plans and select the one that best ful-fils the estate’s forestry objectives. This plan was to be a strategic forest management plan for a 50-year hori-zon and covering both timber production and other uses of the forest. The total planning area was 2930 ha di-vided into 1634 stands. The majority of the stands are spruce-dominated production forest, but there are also a considerable number of pine, birch, oak, and beech stands. About 15% of the forest, including many of the hardwood stands, is classified into areas of increased nature consideration, where only light or no operation is allowed. In addition to timber production, parts of the forests are used as recreation areas and biodiversity protection sites including some stands reserved for the Natura 2000 conservation program.
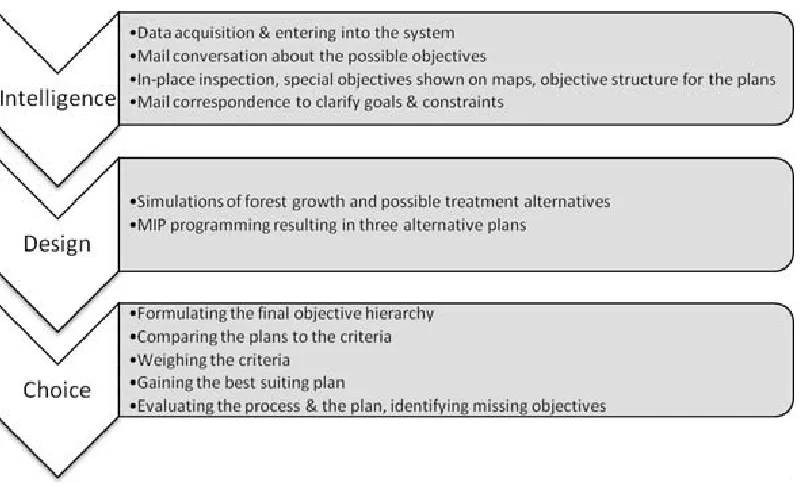
The planning process followed the Intelligence –
De-sign – Choice- model described by Simon (1960). The main phases of the study are presented in Figure 6. The objectives considered in the planning process, as well as the final forest management plan, were chosen by the manager with the support of his forestry consultant. They discussed the alternative actions during the pro-cess, but the manager was the actual decision maker (DM). The process started with data acquisition in May 2009 and ended with a one-day meeting with the DM at the end of August the same year, when the DM used the MCDA module PlanEval to compare the plan alter-natives.
Figure 5: Forest estate of the case study in southwestern Sweden.
the state of the forests and identifying objectives and sub-objectives for the strategic planning. As a first step of the study, the forest data of the estate were entered into the Heureka planning system. We also received a brief description of the current planning situation from the DM by e-mail. The forest data together with the current state description were then used to produce (i) a set of thematic maps showing standing volume, land use, pathways, cultural heritage sites, protected areas and areas with a high proportion of hardwoods; and (ii) a summary table of objectives and other management concerns.
During a one-day visit to the estate, the DM’s objec-tives were discussed using the maps and summary ta-ble as reference material. All place-specific objectives were marked on the maps, and the summary table was updated. In addition, a field trip was carried out to gain a better understanding of the objectives and for-est management traditions involved in the for-estate’s forfor-est planning. After a renewed round of mail contact, a de-scription of objectives and other management concerns was settled (Table 1). A number of other interests were also discussed with the DM during the “intelligence”
phase interviews. Among them were wind power, which would indirectly preclude adaptations to recreation in the vicinity; eco tourism, which would have similar re-quirements already accounted for through recreational aspects in the model; and a rock quarry. However, it was deduced that they would not have an effect on the forestry that could be modeled with a long-range, large-scale forest DSS such as PlanWise.
Korosuo (2011)/Math. Comput. For. Nat.-Res. Sci. Vol. 3, Issue 2, pp. 75–86/http://mcfns.com 81
Figure 6: Phases of the case study.
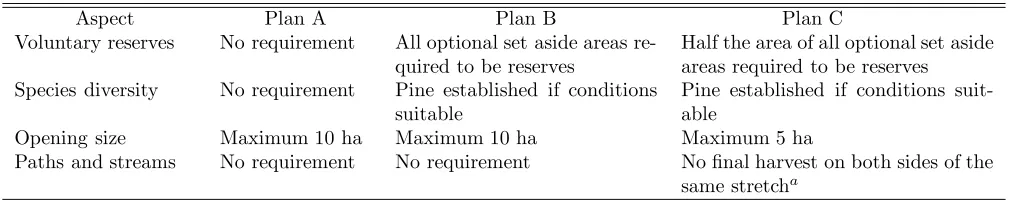
spruce). Second, treatment schedules were simulated for each stand as input to the optimization model. Third, the objective function and constraints of the optimiza-tion model were set by us to create three plans. The net present value was maximized in all problems. The constraints differentiating the plans are presented in Ta-ble 2. We aimed to produce one plan more directed towards timber production (plan A), one towards na-ture conservation (plan B), and one towards recreation (plan C). Note that requirements stated as compulsory in Table 1were observed in all plans.
The current price list (2009) for S¨odra skogs¨agarna with a premium for certification according to FSC and PEFC was used. Extra costs associated with, in partic-ular, continuous-cover forestry were disregarded as they would be compensated by subsidies. A discount rate of 3% was used. The standard setting with respect to growth and yield functions, resource use in harvesting, and costs for regeneration was applied (Heureka 2009). Because of the spatially explicit requirements on opening size and the limitations of harvest on opposing sides of paths and streams, the problem was solved as a mixed integer problem. The model was formulated with the AIMMSR 3.9 optimization modeling system (Bisschop
and Roelofs 1999), and solved from within AIMMSR with ILOGTM CPLEX 11.0. That AIMMSR was used
instead of the built in user interface in PlanWise was only the result of the path and stream requirement and represented only a change of interfaces for formulat-ing the problem; the treatment schedules were retrieved
from the same databases, the same solver was used and the solutions were stored in the same way as would have been the case if the PlanWise interface had been used.
3.4 Choice phase– evaluating plans and the ob-jectives In the choice phase, the DM compared the three plans in an MCDA process using PlanEval, the PlanWise MCDA module. Prior to the case study, a simple cognitive walk-through was performed on a pro-totype of the module to identify possible and proba-ble challenges in practical forest planning. The walk-through also highlighted which parts of the process needed to be conducted by the consultant and which could potentially be left to the DM.
The DM (neither the forest manager nor the for-est consultant) was not previously familiar with MCDA methods. Thus, we first explained the concept of MCDA and the functions of PlanEval. The three plan alter-natives and the processes leading to their design were introduced in an overall manner.
Table 1: Objectives and other management concerns in the case study. Timber production
• Economic value: The greater the net present value the better.
• Harvests over time: The more even the timber volume from harvests over time the better.
Nature conservation
• Key biotopes: Key biotopes, Natura 2000 areas, and other stands requiring additional care are set aside for undisturbed growth or continuous cover forestry.
• Buffers: 10 m around all lakes, streams and fields are set asides.
• Tree retention: 5%-15% of the standing volume is left at final harvest (including what is left in buffers).
• Osprey (Pandion haliaetus): All stands within a radius of 200 m of two nests are set aside.
• Voluntary reserves: Stands that have high nature values but are not already protected could optionally be set aside.
Recreation
• Trekking and illuminated paths: It would be desirable to avoid harvest on both sides of the same stretch of a path within a green-up period of 10 years.
• Boating and fishing: It would be desirable to avoid harvest on both sides of the same stretch of the major stream of the area (Val˚an) within a green-up period of 10 years.
• Opening size: The smaller the better.
Water
• Water source: For each of three catchment areas of about 600 ha, a maximum of 15% of the area can be felled during each five-year period.
Forestry tradition
• Deciduous stands: Stands that are deciduous today should be maintained as mainly deciduous.
• Species diversity: The more pine stands the better.
The DM was then given a computer having the Heureka system and the different plan alternatives. From this point on, the DM used the software, although the re-searchers provided close consultancy.
The plans were then compared with respect to the objectives, and the importance of each objective was weighted. The AHP was used for both evaluations. In the plan comparisons, the DM could choose the most suitable data to represent each objective freely from the PlanWise database. The different data available, as well as the representation methods, were discussed with the researchers during the process, and the DM was guided to navigate through the database. After choosing the
data variables and representation method for each objec-tive, the DM evaluated the plans pairwise against each objective. Thereafter, the different objectives were eval-uated against each other in the same manner.
Korosuo (2011)/Math. Comput. For. Nat.-Res. Sci. Vol. 3, Issue 2, pp. 75–86/http://mcfns.com 83
Table 2: Aspects differentiating plans A, B and C.
Aspect Plan A Plan B Plan C Voluntary reserves No requirement All optional set aside areas
re-quired to be reserves
Half the area of all optional set aside areas required to be reserves Species diversity No requirement Pine established if conditions
suitable
Pine established if conditions suit-able
Opening size Maximum 10 ha Maximum 10 ha Maximum 5 ha
Paths and streams No requirement No requirement No final harvest on both sides of the same stretcha
aConcerns some designated paths and the Val˚an stream and with a green up period of 10 years.
during the session and offered consultancy in the use of the software.
4
Discussion
The case study helped identify both accomplishments and more demanding aspects in an MCDA process aim-ing at a long-term plan for a larger private forest hold-ing. The MCDA process provided an opportunity for the DM to scrutinize the objectives and led to the choice of a most preferred plan. There are a number of issues that one needs to pay attention to in the process, some of which are discussed below.
In the intelligence phase, the problem and its dimen-sions were mapped thoroughly. Several discusdimen-sions, both in person and via email, were conducted between the re-searchers and the DM to identify, describe, and clarify objectives and constraints in the estate’s forest planning. Many aspects of the multiple uses of the forest were al-ready taken into account in this phase, leaving not a lot of room for greatly diverging plans to be developed. In view of this observation, it is reasonable to question whether MCDA was motivated at all or would the same achievements have been reached using more conventional methods. However, despite careful investigation in the intelligence phase, some different valuations were ex-pressed when evaluating the plan alternatives with the MCDA software in the choice phase. When comparing the plan alternatives, the economic objectives were em-phasized more heavily and other objectives were given less importance than expressed initially. Although this creates a problem of mismatching alternatives, it also shows how the DM preferences could be clarified during the process. Further, some objectives such as quiet re-gions, were mentioned in the initial interview, but not explicitly taken into account in the plans as “there is an abundance of quietness here already.” That is, the large forest area could allow a number of interests to co-exist even if the forest management plan does not prioritize it as such. This phenomenon is likely to be a matter of
scale; such objectives may be more difficult or sensitive on smaller estates.
In the design phase, the provided plan alternatives were based on the interpretation made by the researcher, translating the description into well-defined plan alter-natives. Here, the decisions made in the plan alternative simulations were based on knowledge of what objective variables were possible to include in the PlanWise soft-ware. This raised some questions from the DM, as some objectives (e.g., wind power) could not be taken into ac-count in the planning, but could play an important role in future decisions relating to the forest area. On the other hand, many of the non-timber production objec-tives were already included in the optimization model and taken into account in all plans. These were for ex-ample the key biotope areas, buffer zones around the water bodies, and the set-aside areas around the osprey nests.
observa-tion adds to the list of challenges facing the adopobserva-tion of spatial forest planning tools in practice (Bettinger and Sessions 2003). Another problem was the abun-dance of variables available; without prior knowledge of the data produced in PlanWise, navigation between dif-ferent datasets was tedious and the required data were sometimes hard to find.
The AHP method used in the case study is one of the most widely used MCDA methods applied in forestry, and has been described as a relatively easy method to apply in forest planning situations (Ananda and Herath 2009). However, the method is still not self-evident. It has been noted in previous studies that time is needed to introduce and train the concepts before the process can be used in its intended way (e.g. Saaty 1990, Kangas et. al. 2001). This observation was evident also in our case study. The DM faced difficulties, especially in assessing only one objective at a time, and the DM repeatedly referred back to weights given for previous objectives. For example, the net present value, which was considered the most important objective, was mentioned also when comparing the distribution of timber removal over time: “We want to make as much money as possible so we need to prioritize alternative A.” According to the method, the importance of the net present value is already taken into account when weighting it and should not affect the valuation of other variables. The names given to and presented with plans A, B, and C indicated their main focuses, which probably even further directed the attention of the DM from individual objectives. The fact that economic value was already pointed out as the main objective in the initial conversations and that plan A was named “Max NPV” may have tempted the decision maker to prefer plan A, whatever the characteristics of the other plans. This may also explain the observation that plan A was given a higher weight for the amount of hardwoods than plan B despite the latter plan having more of the desired property.
Another problem with the AHP is the large number of pairwise comparisons required even with a relatively small objective hierarchy; there were 31 pairs in this case study. This problem became especially evident in the as-sessment of maps; as the alternatives consisted of combi-nations of hundreds of treatment units, the comparison of each pair took considerable time. The slowness of the analysis led the DM to weighing less important alterna-tives very hastily, with almost no attention paid to the data. This creates a risk of missing clear differences be-tween the alternatives that could affect the weight given to each alternative.
Construction of the objective hierarchy, navigation within the PlanWise database, and understanding the MCDA method required continuous co-operation be-tween the consultant and the DM. As stated by the DM,
the method became clearer only after seeing the results of the evaluation, despite the introduction and examples of the process provided beforehand. A small test analysis prior to the actual MCDA analysis, where the DM would have been able to use the program, could have helped in understanding the process better, although more time would have been needed to carry out the analysis. As such, the program needs to be driven with help from an experienced decision analyst.
5
Conclusions
Research is needed to further demonstrate in what planning situations this MCDA software is particularly suitable. In cases like the one described in this paper, where the planning problem appears fairly well defined and there is limited leeway for different plans, sensitivity analysis around one base alternative might have worked as well, maybe even better. One may also draw the con-clusion that a meticulous intelligence phase could save time by narrowing the search in later phases. It may pay off to engage the DM more actively in the design phase when specifying the plan alternatives, thus get-ting a better understanding of the capabilities of the DSS. In the current case, it turned out that the DM had questions on both what was missing and what was in-cluded in the plans when confronted with them in the choice phase. That the MCDA method presumes that the problem is approached by focusing on one objective at a time is obviously not self-evident. Proper time and good instructions are needed for the DM to fully appre-ciate the method. The possibility to evaluate plans using value functions could lessen the burden on the user to make comparisons of plans. More time would then be available for inspecting the most preferred plan or plans. This may also circumvent some of the conceptual prob-lems in the use of the MCDA techniques by separating plans from objective values.
consid-Korosuo (2011)/Math. Comput. For. Nat.-Res. Sci. Vol. 3, Issue 2, pp. 75–86/http://mcfns.com 85
eration to all phases, needs to be planned carefully.
Acknowledgements
We would like to thank Per Westerlund, Sogeti Sverige AB, for skillfully translating our ideas into functioning computer code and Carola H¨aggstr¨om, Department of Forest Resource Management, for conducting the walk through. We would also like to thank three anonymous reviewers for their helpful comments on the manuscript.
References
Ananda, J., and G. Herath. 2009. A critical review of multi-criteria decision making methods with special reference to forest management and planning. Ecolog-ical Economics. 68: 2535-2548.
Belton, V., and T. J. Stewart. 2001. Multiple Criteria Decision Analysis: An integrated approach. Kluwer Academic Publishers. 372 p.
Bettinger, P., and J. Sessions. 2003. Spatial forest plan-ning: to adopt, or not to adopt? Journal of Forestry. 101(2): 24-29.
Bisschop, J., and M. Roelofs. 1999. AIMMS The user’s guide. Paragon Decision Technology B.V. 216 p.
EMDS. 2010. The Ecosystem Management Decision Support. Available online at http://www.institute.redlands.edu/emds/Default.aspx; last accessed May 12, 2010.
FORSYS 2010. COST Action FP0804 - For-est Management Decision Support Sys-tems (FORSYS). Available online at http://fp0804.emu.ee/wiki/index.php/Main Page; last accessed May 12, 2010.
French, S., and D.-L. Xu. 2005. Comparison study of multi-attribute decision analytic software. J. Multi-Crit. Decis. Anal. 13: 65-80.
Gunn, E.A. 2007. Models for strategic forest manage-ment. P. 317-341 in Handbook of Operations Research in Natural Resources, A. Weintraub, C. Romero, T. Bjørndal, and R. Epstein (Eds.). International Series in Operations Research & Management Science, Vol. 99. Springer.
Heureka. 2009. Heureka MediaWiki. Available online at http://heureka.resgeom.slu.se/wiki/index.php?title= Heureka MediaWiki; last accessed August 15, 2009.
Hiltunen, V., M. Kurttila, P. Leskinen, K. Pasa-nen, and J. Pyk¨al¨ainen. 2009. Mesta: An internet-based decision-support application for participatory
strategic-level natural resources planning. Forest Pol-icy and Economics. 11: 1-9.
Ingemarsson F., A. Lindhagen and L. Eriksson. 2006. A typology of small-scale private forest owners in Sweden. Scandinavian Journal of Forest Research, 21(3):249-259.
Johnson, K. N., and H. L. Scheurman. 1977. Techniques for prescribing optimal timber harvest and investment under different objectives – Discussion and synthesis. Forest Science Monograph 18: a0001-z0001.
Kangas, A., J. Kangas, and M. Kurttila. 2008. Decision support for forest management. Springer. 222 p.
Kangas, J., and A. Kangas. 2005. Multiple criteria de-cision support in forest management – the approach, methods applied, and experiences gained. Forest Ecol-ogy and Management 207: 133-143.
Kangas, J., L. Hyt¨onen, and T. Loikkanen. 2001. Inte-grating the AHP and HERO into the process of par-ticipatory natural resources planning. P. 131-148 in The Analytic Hierarchy Process in natural resources and environmental decision making, Managing forest ecosystems Vol. 3, D. Schmoldt, J. Kangas, G. A. Mendoza, and M. Pesonen (Eds). Kluwer Academic Publishers.
Koch, T. 2009. ZIMPL User Guide. Available online at http://zimpl.zib.de/download/zimpl.pdf; last ac-cessed May 22, 2010.
Lexer, M. J., H. Vacik, D. Palmetzhofer, G. Oitzinger. 2005. A decision support tool to improve forestry ex-tension services for small private landowners in south-ern Austria. Computers and Electronics in Agricul-ture49 (1): 81-102.
Martell, D.L., E. A. Gunn, and A. Weintraub. 1998. Forest management challenges for operational re-searchers. European Journal of Operational Research 104(1): 1-17.
Mendoza, G. A., and H. Martins. 2006. Multi-criteria decision analysis in natural resource management: A critical review of methods and new modeling paradigms. Forest Ecology and Management 230: 1-22.
NCS. 2010. Decision Support Systems Inventory. Available online at http://ncseonline.org/ncssf/dss/ Documents/search/complete.cfm; last accessed May 22, 2010.
Reynolds, K.M., M. Twery, M.J. Lexer, H. Vacik, D. Ray, G. Shao, and J.G. Borges. 2008. Decision Sup-port Systems in Forest Management. P. 499-533 in Handbook on Decision Support Systems 2: Variations, Burstein, F., and C. W. Holsapple (Eds.). Springer.
Saaty, T.L. 1990. The Analytic Hierarchy Process: Plan-ning, priority setting, resource allocation, 2nd ed.
RWS Publications. 287 p.
Simon, H. A. 1960. The new science of management
de-cision. Harper and Row. 50 p.
Sveaskog. 2010. Our operations. Available online at http://www.sveaskog.se/en/About-Sveaskog/Our -operations/; last accessed May 26, 2010.