(UDC: 532.54:612.117)
Plaque progression modeling by using hemodynamic simulation and
histological data
Z.Milosevic1*, M.Radovic1, J.Bird3, Z.Teng3, M.Obradovic2, I.Saveljic1, S.Savic2 and
N.Filipovic1,2
1
Bioengineering Research and Development Center- BioIRC, Prvoslava Stojanovica 6, Kragujevac, Serbia
Email: [email protected] 2
Faculty of Engineering, Sestre Janjic 6, Kragujevac, Serbia Email: [email protected]
3
University of Cambridge, Cambridge, Great Britain *Corresponding author
Abstract
Atherosclerosis is a disease of large arteries that is characterized by the accumulation of lipids in the arterial wall. Mechanical forces such as low shear stress are implicated in plaque formation and development. The objective of this work is to examine influence of wall shear stress (WSS) and histological and blood analysis data on the atherosclerosis development. Histological data and blood analysis (cholesterol, HDL, LDL and triglycerides) are available for 18 rabbits fed by atherogenic diet at Cambridge University. WSS data are calculated by using Computer Fluid Dynamic (CFD). Navier-Stokes equations and Darcy`s law were main governing methods for modeling fluid dynamics in the lumen and wall. Convection diffusion equations were used for modeling LDL and oxygen transport. For coupling fluid dynamics and solute dynamics Kedem-Katchalsky equations were used. Two types of finite element model were used. Wall free models were wall is treated only as boundary condition and single layered model where intima and media of the wall is treated as one entity with homogenous transport characteristics.
Keywords: Finite Element Model (FEM), Computer Fluid Dynamic (CFD), Atherosclerosis,
Wall Shear Stress, LDL, Lipid Accumulation, Plaque
1. Introduction
endothelium dysfunctions and atherogenesis. The main objective of this study is to examine influence of low shear stress and arterial mass transport by modeling the blood flow and solution transport processes in arterial lumen and the wall. Transport processes of the atherogenic species such as low density lipoprotein (LDL) from the bulk blood flow to and across arterial wall contributes to lipid accumulation in the wall.
We modeled relationship between WSS (obtained from computer simulations) and blood analysis data on one hand and plaque size from histology on the other hand. Histological and blood analysis data are available for 18 rabbits fed by atherogenic diet at Cambridge University. Data and geometry are available in two different times (T2 comes three months after T1) for all 18 rabbits. Two different nonlinear models are used for modeling this relationship: third order polynomial regression and quadratic response surface regression [Hill et al. 2006].
2. Mathematical model
Model used here includes fluid dynamics for blood flow and transmural flow and solute dynamics for mass transfer. In order to simulate mass transfer in large arteries and lipid accumulation in the wall following equations were employed.
Hence the fluid is assumed to be steady, incompressible and laminar for modeling fluid dynamics in the lumen Navier-Stokes equations were used (1),(2)
2
0
l l l l
u u u p
(1) 0 l u (2)
where ul is blood velocity, pl is pressure, μ is blood dynamic viscosity and ρ is blood density. Darcy`s law were used to model mass transfer across the wall (transmural flow) of the blood vessel. 0 w w p k u p
(3)
0
w
u
(4)
where uw is transmural velocity, pw pressure in the arterial wall, μp is viscosity of blood plasma, and k is the Darcian permeability coefficient of the arterial wall (3), (4). Convective diffusion equations were occupied for modeling mass transfer in the lumen (5)
D cl l c ul l
0 (5)
where cl represents blood concentration in the lumen and Dl is diffusion coefficient of the lumen.
Convective diffusion reactive equations (6) were used for modeling mass transfer in the wall which are related to transmural flow.
Dw cw Kc uw w
r cw w (6)
The coupling of fluid dynamics and solute dynamics at the endothelium was achieved by the Kedem-Katchalsky equations (7),(8).
v p d
J L p (7)
1
s f v
J P c J c (8)
where Lp is the hydraulic conductivity of the endothelium, Δc is the solute concentration difference across the endothelium, Δp is the pressure drop across the endothelium, Δπ is the oncotic pressure difference across the endothelium, σdis the osmotic reflection coefficient, σfis the solvent reflection coefficient, Pis the solute endothelial permeability, and c is the mean endothelial concentration [Nanfeng et al. 2006].
3. Simulation
As mentioned above, arterial mass transport is influenced by the mechanical forces especially wall shear stress which is present on the arterial wall as effect of blood flow through the blood vessel. As mass transport problem, solute permeability (Fig. 1a) must be considered. Also in this study wall free finite element (FE) model is used (Fig. 1b) without considering transport in the arterial wall.
(a) (b)
Fig. 1. Single layered and wall free model
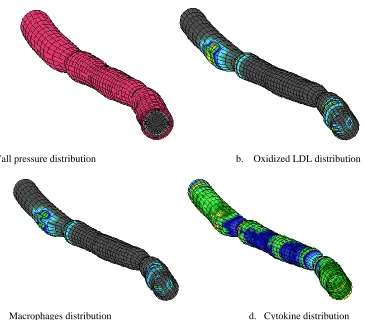
same FE mesh but they are recognized as different entities [Nanfeng et al. 2006], [Filipovic et al. 2011], [Parodi et al. 2011]. Constraining phase uses a few mesh nodes groups. The inlet wall and lumen nodes, representing artery lumen, artery endothelium, wall nodes and shell nodes. All those groups are constrained in the appropriate way in order to simulate behavior in the realistic conditions. In the prescribing loads phase besides the prescribing velocities at the lumen inlet, the prescribing fluxes at specific elements and the prescribing concentrations are necessary in order to simulate plaque propagation processes. Plaque propagation simulation provides, also LDL, Cytokines, Macrophage, and Wall LDL distributions.
4. Simulation results
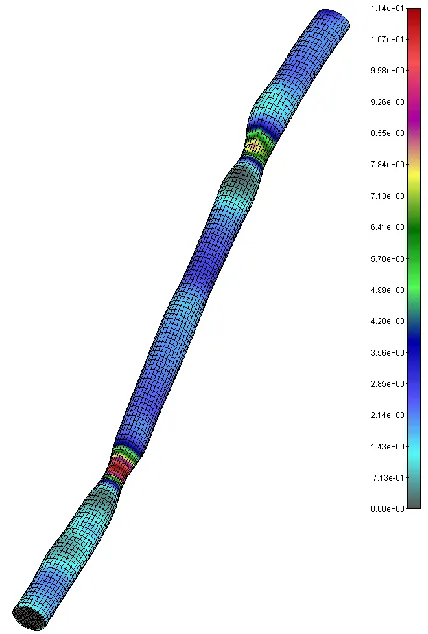
Different result for different simulation types may be presented (Fig. 2). Blood flow simulations provides velocity, pressure and shear stress distribution.
Fig. 2. Blood flow simulation – Shear stress distribution on the wall of the model generated
from reconstructed IVUS medical images of rabbits carotid
Wall pressure distribution b. Oxidized LDL distribution
c. Macrophages distribution d. Cytokine distribution
Fig. 3. Plaque propagation simulation results
5. Fitting data
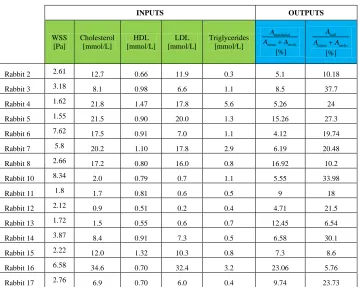
In this section we try to model relationship between histological data (cholesterol, HDL, LDL and triglycerides) and WSS on one side and plaque progression on the other side. Tables 1 and 2 contain INPUT-OUTPUT data for two different times (T2 comes three months after T1).
INPUTS OUTPUTS
WSS [Pa]
Cholester ol [mmol/L]
HDL [mmol/L]
LDL [mmol/L]
Triglycerides [mmol/L]
endothelial
intima media
A A A
[%]
wall intima media
A A A
[%]
Rabbit 2 2.91 12.7 0.66 11.9 0.3 12.7 29.9
Rabbit 3 1.39 8.1 0.98 6.6 1.1 8.77 36.2
Rabbit 4 4.82 21.8 1.47 17.8 5.6 2.73 58.76
Rabbit5 2.74 21.5 0.90 20.0 1.3 8.84 41
Rabbit 6 3.68 17.5 0.91 7.0 1.1 1.62 53.65
Rabbit 7 5.09 20.2 1.10 17.8 2.9 0.85 55.94
Rabbit 9 2.58 14.9 0.78 13.9 0.5 9.1 54.35
Rabbit 10 9.05 2.0 0.79 0.7 1.1 6.81 30.7
Rabbit 11 2.87 1.7 0.81 0.6 0.5 13.35 12.88
Rabbit 12 3.32 0.9 0.51 0.2 0.4 4.44 39.05
Rabbit 13 3.49 1.5 0.55 0.6 0.7 24 20.77
Rabbit 14 2.92 8.4 0.91 7.3 0.5 4.68 21.88
Rabbit 15 4.38 12.0 1.32 10.3 0.8 7.5 44.6
Rabbit 16 5 34.6 0.70 32.4 3.2 5.33 59.24
Rabbit 17 1.42 6.9 0.70 6.0 0.4 6.18 26.8
Rabbit 18 2.04 4.5 1.13 3.1 0.5 7.51 6.67
Rabbit 19 2.47 7.5 0.87 6.4 0.5 7.62 31.1
Table 1. Input-output Data at Time T1
INPUTS OUTPUTS
WSS [Pa]
Cholesterol [mmol/L]
HDL [mmol/L]
LDL [mmol/L]
Triglycerides [mmol/L]
endothelial
intima media
A A A
[%]
wall
intima media
A A A
[%]
Rabbit 2 2.61 12.7 0.66 11.9 0.3 5.1 10.18
Rabbit 3 3.18 8.1 0.98 6.6 1.1 8.5 37.7
Rabbit 4 1.62 21.8 1.47 17.8 5.6 5.26 24
Rabbit 5 1.55 21.5 0.90 20.0 1.3 15.26 27.3
Rabbit 6 7.62 17.5 0.91 7.0 1.1 4.12 19.74
Rabbit 7 5.8 20.2 1.10 17.8 2.9 6.19 20.48
Rabbit 8 2.66 17.2 0.80 16.0 0.8 16.92 10.2
Rabbit 10 8.34 2.0 0.79 0.7 1.1 5.55 33.98
Rabbit 11 1.8 1.7 0.81 0.6 0.5 9 18
Rabbit 12 2.12 0.9 0.51 0.2 0.4 4.71 21.5
Rabbit 13 1.72 1.5 0.55 0.6 0.7 12.45 6.54
Rabbit 14 3.87 8.4 0.91 7.3 0.5 6.58 30.1
Rabbit 15 2.22 12.0 1.32 10.3 0.8 7.3 8.6
Rabbit 16 6.58 34.6 0.70 32.4 3.2 23.06 5.76
Rabbit 17 2.76 6.9 0.70 6.0 0.4 9.74 23.73
In order to model plaque progression we used WSS, cholesterol, HDL, LDL and triglycerides as
input data. As a measure of plaque progression we used endothelial intima media
A
A A on one hand and
wall
intima media
A
A A on the other (Fig. 4).
Fig. 4. Carotid artery cross section for rabbit 10 (left T1, right T2)
The following regression models gave the best results:
Third order polynomial regression:
5
2 3
0 ,1 ,2 ,3
1
i i i i i i
i
OUTPUT a a INPUT a INPUT a INPUT
Quadratic response surface regression:
5 5 2 0 1 1 5 5 , , 1 1; : 0
i i i i
i i
i j i j i j
i j
OUTPUT a a INPUT b INPUT
c INPUT INPUT i j c
where WSS Cholesterol INPUT HDL LDL Triglycerides And OUTPUTis endothelial intima media
A
A A or
wall
intima media
A
A A .
Coefficients a,b and c are determined by using INPUT-OUTPUT data (Tables 1 and 2). We used a simplex optimization method developed by John Nelder and Roger Mead [Nelder et al. 1965] to reach the best fit. This method involves only function evaluations (no derivatives).
2 2 1 1 2 2 1 n n np t p t
RMSE
t t t t
where pi is i-th predicted value of the output, ti is i-th target value of the output and t is average value of the output
1 1 n i i t t n
The RMSE represent the ratio between total squared error of our model and total squared error of default predictor (i.e. a model which always predicts an average output value). The value of RMSE less than 1.0 indicates that the model is useful. The lower the RMSE, the more accurate is the model.
Table 3 shows relative squared error values for both, polynomial regression and response surface regression models for time T1.
OUTPUT Polynomial regression Response surface regression
endothelial
intima media A
A A 0.008652 0.00057
wall
intima media
A
A A 0.09218 0.010291
Table 3. Relative Squared Errors of Polynomial Regression and Response Surface Regression
Models at Time T1
Table 4 shows relative squared error values for both, polynomial regression and response surface regression models for time T2. In this table we can see that both models gave almost perfect fit.
OUTPUT Polynomial regression Response surface regression
endothelial
intima media A
A A 8.58x10
-26
9.07x10⁻²⁸
wall
intima media
A
A A 9.51x10
-25
3.95x10⁻²⁸
Table 4. Relative Squared Errors of Polynomial Regression and Response Surface Regression
Models at Time T2
From Tables 3 and 4 we can conclude that both regression models are useful (RMSE<1). Also, we can conclude that Response Surface Regression model gave slightly better results than Polynomial Regression model.
6. Conclusions
models: third order polynomial regression and quadratic response surface regression gave the best results. Those two models showed that there is a strong connection between plaque size and input data. The achieved results represent progress in the assessment of stroke risk for a given patient‘s geometry and blood analysis data.
Acknowledgements The authors acknowledge support of FP7-ICT-2007 project (grant
Извод
Моделирање
прогресије
плака
коришћењем
хемодинамичке
симулације и хистолошких података
Z.Milosevic1*, M.Radovic1, Z.Teng3, M.Obradovic2, I.Saveljic1, S.Savic2 and N.Filipovic1,2
1
Bioengineering Research and Development Center- BioIRC, Prvoslava Stojanovica 6, Kragujevac, Serbia
Email: [email protected] 2
Faculty of Engineering, Sestre Janjic 6, Kragujevac, Serbia Email: [email protected]
3
University of Cambridge, Cambridge, Great Britain *Corresponding author
Резиме
Атеросклероза је болест великих артерија која је карактеристична по акумулацији липида у зиду артерије. Механичке силе као што су ниски смичући напони су заслужни за формирање и развој плака. Циљ овог рада је да испита утицај смичућег напона зида, хистолошких слика и анализа крви на процес развоја атеросклерозе. Хистолошки подаци заједно са анализама крви (холестерол, HDL, LDL и триглицериди) су урађени на 18 зечева који су били подвргнути атерогеној дијети на Кембриџ Универзитету (Енглеска). Вредности смичућих напона на зида су рачунати коришћењем компјутерске динамике флуида. Навије-Стоксове једначине и Дарсијев закон су коришћене за моделирање динамике флуида у лумену и зиду. Конвективно дифузне једначине су коришћене за моделирања транспорта LDL-а и кисеоника. Примењена су два различита модела. Слободно зидни (wall free) модел где је зид третиран само као гранични услов и једнослојни модел где су инитима и медија крвног суда третирани као један ентитет са карактеристикама хомогеног транспорта.
Кључне речи: Модел Коначних Елемената (МКЕ), Компјутерска Динамика Флуида
(КДФ), атеросклероза, смичући напон зида, LDL, нагомилавање липида, плак
References
Filipovic N, Kojic M, Ivanovic M, Stojanovic B, Otasevic L, Rankovic V (2006), MedCFD, Specialized CFD software for simulation of blood flow through arteries, Kragujevac, Serbia, University of Kragujevac.
Filipovic N, Rosic M, Tanaskovic I, Milosevic Z, Nikolic D, Zdravkovic N, Peulic A, Kojic M, Fotiadis D, Parodi O (2011). ARTreat project: Three-dimensional Numerical Simulation of Plaque Formation and Development in the Arteries, Information Technology in BioMedicine.
Holzapfel, G, Gasser T, Ogden R (2000). A New Constitutive Framework for Arterial Wall Mechanics and a Comparative Study of Material Models, Journal of Elasticity, 61, 1-48. Kojic M, Filipovic N, Stojanovic B, Kojic N (2008). Computer Modeling in Bioengineering:
Thеoretical Background, Examples and Software, John Wiley and Sons, Chichester, England.
Nanfeng S, Nigel W, Alun H, Simon TX, Yun X (2006). Fluid-Wall Modelling of Mass Transfer in an Axisymmetric Stenosis: Effects of Shear-Dependent Transport Properties, 34, 1119-1128.
Nelder J, Mead R (1965). A simplex method for function minimization, Computer Journal, 7 (4), 308-313.