_____________________________________________________________________________________________________
Journal of Geography, Environment and Earth Science
International
19(1): 1-14, 2019; Article no.JGEESI.47493 ISSN: 2454-7352
Estimation and Assessment of Soil Erosion Risk
of Nun Watershed Using Remote Sensing and GIS
V. B. Kale
1*1
Department of Geography, KTHM College, Gangapur Road, Shivaji Nagar, Nashik, Maharashtra, Pin-422002, India.
Author’s contribution
The sole author designed, analysed, interpreted and prepared the manuscript.
Article Information
DOI: 10.9734/JGEESI/2019/v19i130078 Editor(s): (1) Dr. Teresa Lopez-Lara, Autonomous University of Queretaro, Cerro de las Campanas S/N, Col. Niños Héroes. 76010
Querétaro, Qro; Mexico. Reviewers: (1) Gordon Tami, Federal University of Technology, Nigeria.
(2)Osayande Augustine, University of Abuja, Nigeria.
Complete Peer review History:http://www.sdiarticle3.com/review-history/47493
Received 30 October 2018 Accepted 11 February 2019 Published 21 February 2019
ABSTRACT
This study aims to investigate the soil erosion from selected watershed from Dehradun area having hilly terrain and human’s development activities The remote sensing based model was decided to perform the estimations and assessment of soil eroded from watershed. The Nun river watershed was selected for study. From the estimated quantity of soil eroded we can predict the risk due degraded soil in terms of decreasing crop productivity. The present study assists to decide the optimum land use for specific purpose at the Nun watershed in Deharadun, Uttarakhand. The major objective of the study is to assess the soil erosion risk in the study area.
Keywords: Soil erosion; assessment; RS; GIS; crop productivity.
1. INTRODUCTION
Erosion of soil is complex and universal process. Denudative agents and gravitational force continuously erode the surface of the earth. River is prominent agent in this regards. The
assessment of soil erosion helps to land evaluation. Remote Sensing and GIS technique is a precise tool to analyse the data and to run this model. GIS become very important factor in soil erosion studies. Revised Soil Loss Equation (RUSLE) is widely used in soil erosion studies.
2. PHYSICAL SET-UP OF STUDY AREA
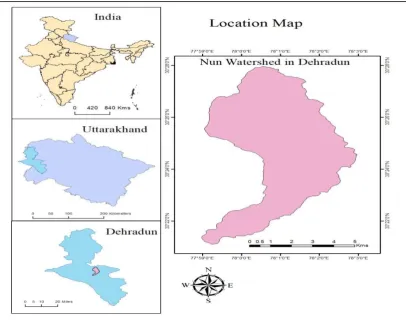
2.1 Location
The study area is located in the Deharadun District of Uttarakhand, India. The district is situated in the foothills of Himalayas, in the north-west corner of Uttarakhand. The Nun watershed occupies an area of 4031 Ha. It is situated at 30021’6’’N to 30027’57’’N latitude and 77059’9’’E to 78025’67’’E longitude was selected for the land evaluation analysis.
2.2 Physiography
The watershed area is bordered by the lasser Himalayan ranges to the north and Siwalik to the
South. The Study area has different
physiographic units like hills of varied slope
ranges, upper and lower piedmont. The northern part of study area consists of hills and southern part is of piedmonts.
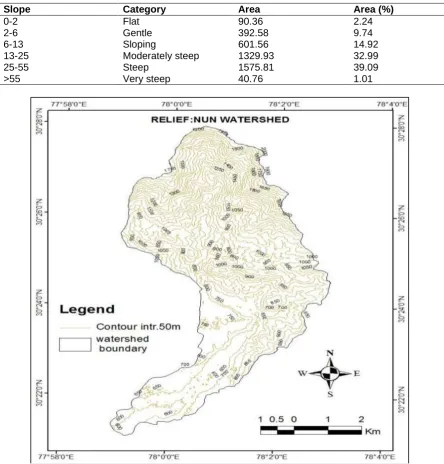
2.3 Relief
The altitude of watershed area ranges from 480 to 2260 m above mean sea level. The important peaks area Hattipawan (2160 m), Bakarna (1081m) and Chhouwala (1093 m). The relief is represented by 50 m. contour intervals.
2.4 Drainage
Dehradun district is drained by Ganga, Yamuna and their tributeries. The two basins are separated by a ridge starting from Mussoorie and passing through Dehradaun. The easterly flowing river join river Ganga and westerly flowing rivers join river Yamuna. The Nun River flows from Hattipawan along the north south directions and drains to Tons river near Bajawala. The Tons river flows westward and confluence with river Yamuna. The length of the watershed extends 13 km North West.
Kale; JGEESI, 19(1): 1-14, 2019; Article no.JGEESI.47493
Fig. 2. Physiography
2.5 Geology
The area of Dehradun is characterized by faults and fractures. The northern boundary of the district is formed by lesser Himalayan range and southern boundary Siwaliks. The Doon valley lies in the Middle and Upper Siwalik. This area is composed of fluviatile sediments consisting of conglomerates and sandstone-mudstone complex. The conglomerates are predominantly composed of pebbles and boulders. The debris eroded from the steep slope hills in the northern part, deposits along a shallow longitudinal valley at the foot of the Himalayan range which are formed in the Siwaliks is called “ Doon” The continuous deposits in the valley caused the floor of the valley rise.
2.6 Soil
The nature and characteristics of soil play an important role in the growth and development of crops, trees and other vegetation. The soil of the watershed shows large variation due to variation in slope, topography and land use. Due to large variation in relief and slope in the selected watershed, the soils subjected to erosion
resulting in wide variation with respect to texture, soil depth, organic matter, stoniness, color, drainage, moisture content and cation exchange capacity. In the northern upper catchment area of watershed, soil depth is less due increased erosion caused by steep slopes and are mostly covered by scrub vegetation. In the upper catchment area, due to very steep slopes, the thickness of the soil is very less and is considered as unproductive. As the slope decreases the soil depth increase and land use change through forest in the lower hills and piedmonts to agriculture in upper and lower piedmonts are seen.
2.7 Climate
2.8 Demography
As per the Census of India reports, the total population of Dehradun is 5, 78, 420 with male and female population of 303,411 and 275,009 respectively. The sex ratio of the city is 906 per 1000 male. The number of literates in Dehradun city is 463,791 of which 251,832 are male and 211,959 are female. Average literacy rate of Dehradun city is 89.32 % whereas male literacy and female rate are 92.65 and 85.66%
respectively. According to topographical map, about 20 numbers of the villages were identified. But out of 20, only 11 villages were reported by census of India. These 11 census villages are : Chhoba, Kedderwala, Chandpur (kala and Kurd), Rudarpur, Godrio, Surno, Barwa, Koti, Dubhal, Kotra (Kalyanpur, santaup), Kolwanpur, Birsani with the total population and of 7268, 24 2 (224,183), 2136,2116, 1273,270, 651, (666,831), 86 and 352 respectively.
Table 1. Slope under different category
Slope Category Area Area (%)
0-2 Flat 90.36 2.24
2-6 Gentle 392.58 9.74
6-13 Sloping 601.56 14.92
13-25 Moderately steep 1329.93 32.99
25-55 Steep 1575.81 39.09
>55 Very steep 40.76 1.01
Kale; JGEESI, 19(1): 1-14, 2019; Article no.JGEESI.47493
Fig. 4. Drainage
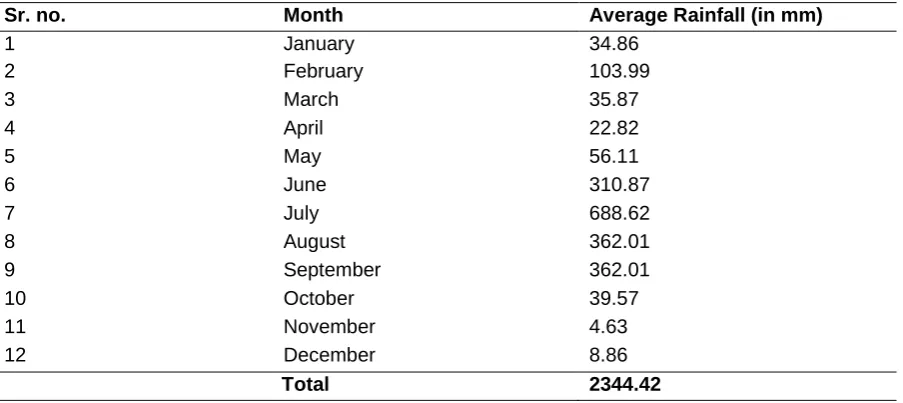
Table 2. Average rainfall distribution (2004-2013)
Sr. no. Month Average Rainfall (in mm)
1 January 34.86
2 February 103.99
3 March 35.87
4 April 22.82
5 May 56.11
6 June 310.87
7 July 688.62
8 August 362.01
9 September 362.01
10 October 39.57
11 November 4.63
12 December 8.86
2.9 Economy
The economy of the study area is confined in the agricultural activities. Due to hilly terrain in the northern part, that tract is beyond any utility. Cultivation in the hill slope area is of two description, regular and intermittent. The hill, however, contain very little level ground and therefore, farmers follow terraced cultivation. Intermittent cultivation consists of small patches of hill sides cleared off shrubs and grass usually by fire.
3. LITERATURE REVIEW
In agriculture, soil erosion is major problem. The deterioration of soil by the physical movement of soil particles from a particular site is known as soil erosion. Wind, water, ice, animals, and the use of tools by man in agriculture are usually the main causes of soil erosion. The soil erosion is a natural process which usually does not cause any major problems, when its quantity is comparatively low. It becomes a problem when human activity causes it to occur faster than under normal conditions [1].
Worldwide, farmers are losing an estimated 24 billion tons of topsoil each year. In developing countries erosion rates per acre are twice as high as the standard, partly because population pressure forces land to be more intensively farmed. Although soil erosion is a physical
process, it also affects productivity and growth. Reductions in yield of up to 50% have been documented on severely eroded soils in Ontario. When soils are depleted and crops receive poor nourishment from the soil, the food provides poor nourishment to people. Losses of soil take place much faster than new soil can be formed. It takes thousands of years to form just a few centimetres of soil. The difference between creation and loss represents an annual loss of 7.5 to 10 tons per acre worldwide. The main causes of soil erosion are still inappropriate agricultural practices, deforestation, overgrazing and construction activities [2].
Hydrologic and other soil physical properties are particularly important factors affecting the potential for surface erosion. Coarse-textured soils are low in organic matter is most susceptible to surface erosion. Most undisturbed forest soils in the region have a high porosity which, coupled with the low intensity of most rainfall event, seldom result in overland flow.
Prescribed fire and extensive humans
developmental activities can increase soil erosion on steep slopes. Accelerated erosion from human's activity usually has a major effect on long-term forest and agricultural productivity and may pose severe threat in future. Therefore it is necessary to assess the risk due to soil erosion by assessing the quantity of soil eroded from the study area.
Kale; JGEESI, 19(1): 1-14, 2019; Article no.JGEESI.47493
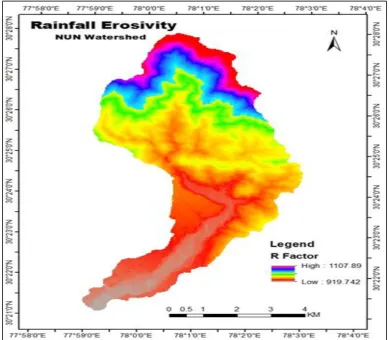
Fig. 6. Rainfall erosivity
Keif and Yoshino [3] has evaluated the economic effects of soil erosion risk on agricultural productivity using remote sensing. They have carried out the investigations in the Tunishi watershed. Their results showed that, the erosion risk increases in particular from mountainous areas to gentle areas and reported the fact that, the erosion risk occurs in areas with steep slope, poor vegetation, high soil erodibility and no erosion control.
The agriculture land is very sensitive for soil erosion as man carries out his most of the mechanization practices in it for the cultivation and growing of crop plants. Overall humans activities carried out in agricultural land are acting as an important cause for increasing soil erosion fro croplands. With this view many researchers are working in these areas. The impact of the land use on the risk of soil erosion from agricultural lands in Canada was reported by Shang Li et.al. (2010) and they concluded that, Overall the risk of soil erosion on Canadian cropland was reduced steadily after 1980,
because of adoption of conservation tillage, but till in some agricultural land the risk of soil erosion is there in some crops such as potato, sugerbeet, corn, soyabean etc.
Soil erosion is a physical phenomenon found in nature where surface soil is being drained from one place to other. The weathering agents, vegetation cover, soil type, topography of region, and geology of region are acting as an important factors influencing the soil erosion. Many researchers are assessing the soil erodibility risk in various places by employing Remote Sensing and GIS technologies. Tingting et al. [4] has assessed the soil erosion risk in Northern Thailand and reported that, the soil erosion risk is very high in the altitude between 100 and 400 m zone and it was found lower in forest area as compare to agriculture and plantation areas. Gitas et al. [5] has assessed the soil erosion risk in Chalkidiki from Greece by using LISS III data and modified USLE Raster model. They have modified the protocol for estimation
Table 3. Physiographic units of the study area
Sr. no. Physiographic Units Area (ha) Area (% )
1 H12-Hills very steep agricultural land 8.81 0.22
2 H32- Hills moderately steep agricultural land 21.53 0.53
3 P12-Upper piedmont agricultural land 24.95 0.62
4 H22-Hills steep agricultural land 35.81 0.89
5 PI 1-Upper piedmont forest 71.90 1.78
6 RB-Riverbed 85.70 2.13
7 H33- Hills moderately steep dense scrub 126.27 3.13
8 H13-Hills very steep dense scrub 175.95 4.37
9 S-Settlement 266.02 6.60
10 P21 -Lower piedmont forest 320.19 7.95
11 H 11-Hills very steep forest 381.92 9.48
12 H31-Hills moderately steep forest 406.69 10.09
13 P22-Lower piedmont agricultural land 455.18 11.30
14 H21 -Hills steep forest 634.61 15.7,5
15 H14-Hills very steep open scrub 1013.15 25.15
were determined as grid layer by processing data and prepared the soil erosion risk maps in three different seasons and determined its accuracy levels.
The result reveals that, the multi temporal NDVI gives better insights than a single data approach. In modern industrialized era the increase population is degrading the surrounding environmental parameters and which is posing various kinds of threats. The vegetation degradation is one of the threat resulted due to
human development activities and which is posing the risk of soil erosion. The increased risk of soil erosion may cause adverse impact on agriculture as well on horticulture making it unsustainable. Therefore worldwide people are working on the soil erosion risk of particular
areas with respect to deforestation and other factors in different watersheds. Lu Yuan
and Hua Cui [6] has evaluated soil erosion sensitivity in Guangxi area by using GIS based system and explain affecting parameters on soil erosion.
Kale; JGEESI, 19(1): 1-14, 2019; Article no.JGEESI.47493
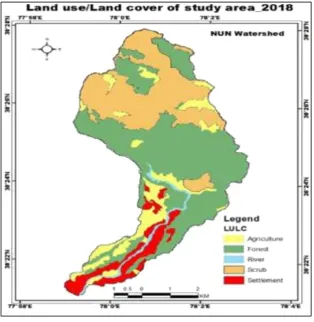
Table 4. LULC categories
Sr. no. LULC categories Area (ha) Area (%)
1 Forest 1973.68 48.96
2 Scrub 116.35 2.89
3 Agriculture 473.32 11.74
4 River 77.90 1.93
5 Settlement 322.14 7.99
6 Miscellaneous 17.61 0.44
Total 4031.0 100.00
4.
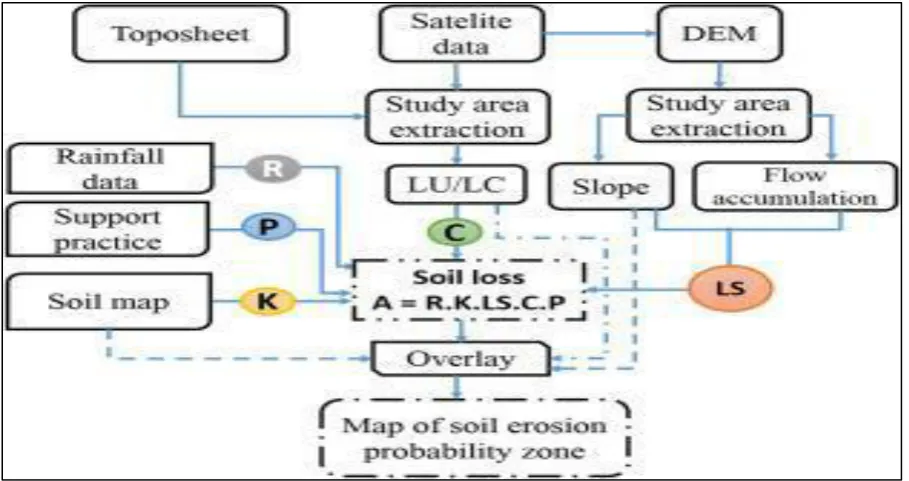
MATERIALS AND METHODS
To study the soil erosion risk at selected study area of Nun river watershed, the LISS III images of March 2016 was used. The DEM is used to delineate the watershed of Nun River and boundary was determined by employing the following methodology. By using the LISS III the soil erosion from the Nun river watershed was determined by using RUSLE model.
4.1 Rainfall Erosivity (R) Factor
The R factor represents the erosive force of a specific rainfall event, The rainfall erosivity is an index of rainfall erosivity which is the potential ability of the rain to cause erosion. To produce R-factor map, the interpolated R- factors were converted into a raster format with 30 m resolution and extracted for the studied watershed.
The equations for calculation of R-Factor is given below:
R’ = A + 0.329 * DEM layer R = 81.5 = 0.375 *R’
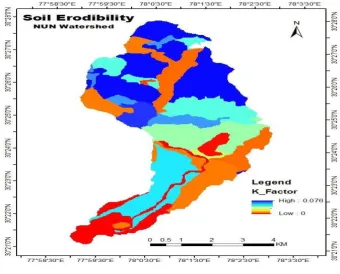
4.2 Soil Erodibility (K) Factor
The soil erodibility factor, K value is the rate of soil loss per rainfall erosion index unit as measure on standard plot and often determined using inherent soil properties. The K-factor is related to soil texture, organic matter content permeability, and other factors and it is basically derived from the soil type. K factor is the integrated effect of processes that regulate rainfall acceptance and the resistance of the soil
to particle detachment and subsequent
transport. Soil textural triangle was used to determine the soil textural class from the percentages of sand, silt and clay in soil.
4.2.1 Slope length (L)
L-factor presents the effect of slope length on erosion. Slope length is the distance from the origin of overland flow along its flow path to the location of the either concentrated flow or deposition. In this case study LISS III data and ArcGIS software was used to measure the slope
length. Homogeneous field areas were
delineated and slope length measured of many fields and length was generated.
4.2.2 Slope steepness (S)
S factor represents effect of slope steepness on erosion as soil loss increases more rapidly with slope length. The relation of soil loss to gradient is influenced by density of vegetation cover and soil particle size. In this case study from SRTM 30 meters data DEM map was generated from which terrain slope map in degree and percentage was generated.
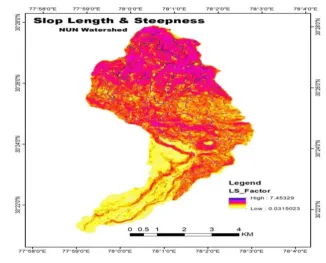
4.2.3 Topograhic factor (LS)
The LS factor reflects the effect of topography on erosion where slope length factor (L) represent the effect of slope length on erosion, and the slope steepness factor (S) reflects the influence of slope gradient on erosion. The LS factor is considered in the soil loss equation model due to the fact that both the length and the steepness of the slope substantially affect the rate of soil erosion by the water. The steeper and longer the slope, the higher is the rate of erosion by water because of the greater accumulation of runoff. The slope length and steepness values were drawn from the SRTM DEM (30 m resolution) using the Arc GIS Spatial analyst tool and the Arc Hydro tool. The resulting slope length (L) map indicated that the slope length varied from 0 to 102. The slope steepness (S) map showed that the slope gradient ranged from 07 to 2.46 in the lower and head stream of the watershed,
respectively. Values for combined LS factor varied between 0 and 28.19.
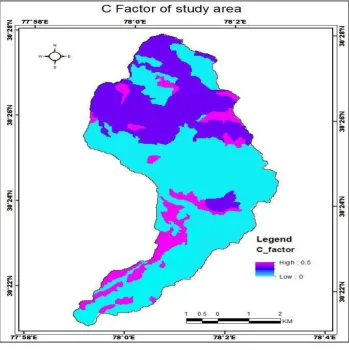
4.2.4 Land use / land cover (C)
The land use/ land cover (C) factor represents the ratio of soil loss from land covered by vegetation to the corresponding loss from continuous fallow. The C factor is the most important factor in RUSLE model due to its
representation to reduce soil erosion.
Supervised classification was performed to generate land use land cover map. The land use land cover map has been classified as forest, dense scrub, open scrub, agricultural land, river and settlement. The land use land cover map of the study area was derived from LISS III image as the basis for determining the C factor values.
4.3 Conservation Practice / Support
Practice Factor (P)
The P factor is the ratio of soil loss with a specific support practice to the corresponding loss with up slope and down slope tillage. The
lower P value, the more effective the
conservation practice is deemed to be at reducing soil erosion. The conservation practices (P) factor are also known as erosion control practice factor is the ratio of soil loss with a specific conservation practice like contouring, strip-cropping, or terracing measures to the corresponding loss with up and down slope cultivation. Thus, the P factor for RUSLE can be mapped through by collecting data from frequent field observations. The P factor ranges from 0 to 1, where the highest value is allocated to areas with no protection practices.
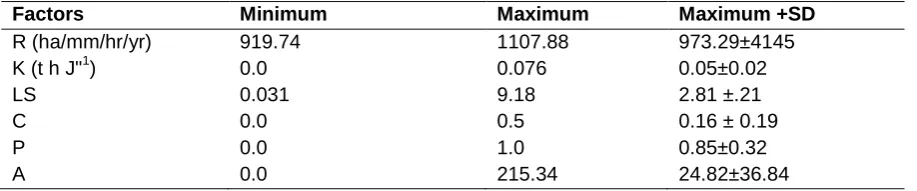
The revised Universal Soil Loss Equation "RUSLE" model aims at predicting soil loss from lands due to soil erosion by water. This is universally accepted. It is based on 5 factors related to rainfall (R), soil characteristics (K), topography (LS), land use (C) and cover management (P).
Table 5. Summary statistics of RUSLE factors
Factors Minimum Maximum Maximum +SD
R (ha/mm/hr/yr) 919.74 1107.88 973.29±4145
K (t h J"1) 0.0 0.076 0.05±0.02
LS 0.031 9.18 2.81 ±.21
C 0.0 0.5 0.16 ± 0.19
P 0.0 1.0 0.85±0.32
Kale; JGEESI, 19(1): 1-14, 2019; Article no.JGEESI.47493
Fig. 9. Landuse landcover
It can be written as:
A='R*K*LS*C*P
Where,
A = The annual land loss (ton/ha/year)
R = Rainfall erosivity factor (MJ mm ha-1
IT-1 yr-1)
K = Erodibility factor (ton ha hr/ha.MJmm) LS = Slope length and slope indication
factor
C = Vegetation cover Management factor P = Supporting practices factor while' C, P
and LS are dimensionless.
In this study, these 5 factors are
represented on a raster with a cell resolution of
30* 30 m and geo-referenced to the
Universal Traverse Mercator WGS 84 (Zone
44 N). These are computed by using
suitable datasets and appropriate software
such as ERDAS imagine and ArcGIS
10.3.
5. RESULTS AND DISCUSSION
5.1 Rainfall Erosivity (R) Factor
The average rainfall of the twenty five years is 2051.4 mm and the average annual R factor value varies from 919.74 to 1107.89 MJ ha/mm/hr/yr. The mean value is 1013.82MJ ha/mm/hr/yr. The rainfall erosivity was found to be more in the northern part of watershed as compared to southern part which is indicative of the decrease in the rainfall from north to south and a reflection of spatial variation in erosivity of the area.
5.2 Soil Erodibility (K) Factor
The K value in the study area ranged from 0 to
0.07 th MJ -1 mm-1 and the mean value is 0.038
th MJ -1 mm-1. The K map show spatial
Table 6. Extent of soil erosion risk in nun watershed
Classes Soil loss (ton/ha/ yr) Area (ha) Area (%)
Low 0-20 2570.13 64.83
Moderate 20- 40 264.69 6.68
Moderately high 40-50 342.27 8.63
High 60-80 346.59 8.74
Very high >80 440.55 11.11
Low 0-20 2570.13 64.83
5.3 Topographic Factor (LS) Factor
A topography map with a spatial resolution of 30
mSRTM DEM was used to develop a map of the
slope length and slope steepness factor (LS). The highest elevation and steep slopes were found in the northern part of watershed. As a result the LS values were found in the northern part as compared to the southern part which is almost plain in topography. It can be seen from LS map that the LS factor value in the study varies from 0.0315023 to 7.45329 and the mean value is 2.73.
5.4 Land Use / Land Cover (C Factor)
The C factor values were generated from
Remote Sensing data. The factor values ranged
from 0 to 0.5 and the mean value is 0.25.
5.5 Conservation Practices / Support
Practice Factor (P Factor)
The P factor value varies from 0 to 1 and the
mean value is 0.78. From the P map may be inferred that owing to the hilly topography, majority of the areas in the watershed is engaged in some conservation practice.
Kale; JGEESI, 19(1): 1-14, 2019; Article no.JGEESI.47493
Fig. 11. P factor
Fig. 12. Soil erosion risk
Table 7. LULC class wise extent of soil erosion risk in Nun watershed LULC types Minimum Maximum Mean SD
Scrub 0.00 195.47 72.67±30.50
Forest 0.19 215.34 1.45±6.48
Agriculture 0.00 138.09 27.54±24.08
River 0.00 0.00 0.00
5.6 Soil Risk Assessment
After completing data input procedure and
preparation of R,K, C, P and LS maps are data
layers, they were multiplied in GIS environment to draw up the erosion risk map showing the spatial distribution of soil loss in study area. The annual soil loss was calculated after obtaining the product of R, K, LS, C, F as factors for soil erosion. The annual soil loss for the Nun watershed varies from 0 to 354 ton/ha/yr. The average annual soil loss is 24.82 ton/ha/yr. Majority of the watershed falls under low erosion risk class excepting few patches in the northern part which is very highly susceptible soil erosion owing to topography and low vegetation. Prevalence of forest cover may account for less susceptibility to soil erosion almost in the entire of Nun watershed.
6. CONCLUSION
The study area under taken is a part of Dehradun District, Uttarakhand with an aim to assess the soil erosion risk and model by using RUSLE in the Nun watershed. Remote Sensing and GIS techniques along with field generated data on soil characteristics was used for assessing the risk of soil erosion. From Cartosat 3 30 m DEM, delineation of the study area (Nun watershed) was identified. In this identified study area LISS III image was used to estimate the soil erodibility.
The Finding of the Study Shows:
• The annual average soil loss of the Doon
watershed was found to be 24.82 ton/ha/yr.
• It is clearly evident that the major cause of
soil erosion is slope, steepness, heavy rainfall and nature of vegetation cover are influencing the soil erodibility.
• Highest soil loss was observed in open
scrub area followed by agriculture, dense
scrub and minimum in forest dominated areas.
• Using RUSLE MODEL, conservation
measures can be suggested depending on the amount of soil eroded from the particular area.
COMPETING INTERESTS
Author has declared that no competing interests exist.
REFERENCES
1. Bakker MM, Govers G, Jones R,
Rounsevell M. The effect of soil erosion on agricultural productivity. Geophysical Research Abstracts. 2005;7.
2. Yassoglou N, Montanarella L, Govers G,
Van Lynden GG, Jones RJA, Zdruli P, Kirby M, Giordano A, Le Bissonnais Y, Daroussin J, King D. 1998.
3. Keif M, Yoshino K. Evaluation do the
economicv effects of soil erosion risk on agricultural productivity using remote sensing: Case of watershed in Tunisi".
International Archives of the
Photogrammetry, Remote Sensing and Spatial Information Science. Kyoto, Japan. 2010; XXXVIII:Part 8.
4. Tingting LV, Sun Xiayou, Zhangd Dandan,
Xue Zhenshanand, Gong Jianming.
Assessment of soil erosion riskin Northern Thailand; 2008.
5. Gitas IZ, Koastas Dourous, Charana
Minakou, George N. Silleos, Karydas CG.
Multi-temporal soil erosion risk
assessment in N. Chalkidiki using a modified USLE raster model. EARSel e
Proceedings.2009;8(1):40-52.
6. Lu Yuan, Hua Cui. GIS based sensitivity
evaluation for soil erosion in Guangxi. Research of Soil and Water Conservation. 2007;14(1):98-100.
_________________________________________________________________________________ © 2019 Kale; This is an Open Access article distributed under the terms of the Creative Commons Attribution License (http://creativecommons.org/licenses/by/4.0), which permits unrestricted use, distribution, and reproduction in any medium, provided the original work is properly cited.
Peer-review history: