A MODEL FOR MANAGEMENT OF MIXED COPPICE STANDS
IN SEMIARID PERSIAN OAK FORESTS
Alireza Salehi
1, Ljusk Ola Eriksson
21Doctor of Forestry,2Professor, Department of Forest Resource Management, SLU, SE-901 83, Ume˚a, Sweden
Abstract. This study aims to present a diameter class model to predict the effects of different forest
management practices on growth and yield conditions of the mixed coppice stands of Persian oak (Quercus persica) in the semiarid forests in southern Zagros, Iran. Using inventory data the model was applied to make management recommendations for a forested watershed. Some requested data for the model were extracted from available information on an adjacent forested area. The model was analyzed under a set of different management strategies considering uneven-aged forest management. Linear programming was used to solve the problems. The model yields results of importance for policy development. For instance, the present prohibition of harvests could be counterproductive as some 10–20 times more volume can be extracted when harvests are allowed. In addition, the effect of improved protection of natural regeneration from grazing seems only to be justified if it is combined with harvesting trees. These conclusions should however be considered with great caution as the calculated model parameters hinge on a number of critical assumptions. Sensitivity analyses with the model could show what parameters are critical and therefore motivate research with permanent field trials.
Keywords:Forest management, Mixed Coppice Stands, Persian Oak
1
Introduction
The deciduous speciesQuercus persica (Q. branti var. persica) known as Persian oak is widely distributed across the Zagros region in western Iran [12, 15, 24]. The Zagros forests, with an area of around 5 million hectares, account for almost 40% of the country’s forests [24]. Ac-cording to the available written documents [25], they were one of the first exploited forests in the world and were used to build cities around 2700 BC. The persis-tence of these forests could be due solely to the excellent vegetative reproduction capacity of oaks through shoot regrowth after cutting [19] or natural damage [21]; thus, being in coppice form is an inherent characteristic of these oaks. In Zagros, more than 90% of the oaks are in coppice form [24]. These primarily oak forests are classi-fied as semiarid forests. They are currently considered as degraded forests [12, 24]. Today, there are no commer-cial sized trees left in Zagros and the lack of regeneration in these forests due to increased browsing pressure on re-generating trees is a major concern [9, 12, 19, 22, 24]. Forests in Iran are under governmental authority. Since the beginning of 2000, with the aim of improving for-est conditions, the forfor-est authority has developed long-term programs for the conservation of the Zagros forests.
For the programs to be successful, economically, ecolog-ically and socially sound forest management schemes for these uneven-aged, mixed coppice oak forests have to be developed. Since 1970, the volume table of Persian oak known as the Yasuj-form class has been used by the forest authority for forestry practices in the Zagros re-gion [12]. However, the table offers limited help in a dynamic analysis of different management strategies at the forest level.
With the objective of overcoming the limited applica-bility of yield tables in forestry practice, a great vari-ety of approaches have been developed to project evolu-tion of uneven-aged forest stands [1, 3, 10, 18, 20]. So far, many stand models have been developed for man-agement of boreal and temperate mixed or uneven-aged forests [18], but this has been rarely conducted for semi-arid forests, particularly for coppice oaks stands. This could be because utilization of this type of forest is not so economically important.
Numerous studies present management models based on diameter class models for management of uneven-aged forest stands (e.g., [3, 4, 8, 10, 13, 26, 27]. The diameter distribution, where the number of trees is spec-ified by size classes, is one of the most common variables
Copyright c2010 Publisher of the International Journal ofMathematical and Computational Forestry & Natural-Resource Sciences
obtained from forest inventories in Iran. Therefore, di-ameter class models would seem appropriate for ana-lyzing forest data to select optimal forest management strategies.
This study aims to present a diameter class model to predict the effects of different forest management prac-tices on growth and yield conditions of the uneven-aged, mixed coppice stands of Persian oak in southern Zagros. We will use the model to make suggestions for develop-ment strategies for a case area in the Zagros region. In addition to giving some management recommendations, the analyses highlight the lack of data for the model and can therefore help the Iranian national forest inventory to plan for forest inventories that enhance the reliability of such kinds of models.
After introducing the study area, the mathematical model and the parameters of the model are presented. The uneven-aged forest management model is then ap-plied to the study area under different management ob-jectives. The results will then be analyzed in terms of the ability of the model to support policy analysis and the implications they have for further research.
2
Data and Models
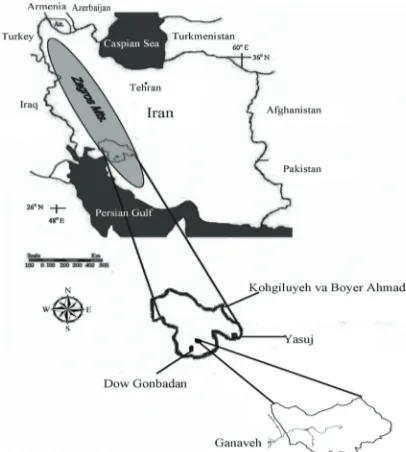
2.1 Study Area. Based on the differences in oak species and climatic conditions, the Zagros vegetation zone is divided into two distinct regions, where the southern Zagros region has less humidity than the north-ern region [12, 24]. The study was carried out in the Ganaveh watershed (30◦27N, 50◦50E) in southern Za-gros, located 15 km north of the city of Dow Gonbadan (Gachsaran) in the province of Kohgiluyeh va Boyer Ah-mad, Iran (Fig. 1). The mountainous watershed with steep slopes has an area of 6621 ha. Ganaveh village with its agricultural lands, an area of 133 ha, is located in the center of the watershed. The vegetation types, which are mainly oak trees and shrub-bush, cover an area of 5848 ha, extend between 1200 and 2300 m (a. s. l.) and are differentiated and mixed in different parts of the area depending on ecological factors. The re-maining area of the watershed is covered by rocks and cliffs. From a 15-year period (1986–2001) of measure-ment, annual precipitation is approximately 500 mm, and the mean annual temperature is 22.5◦C. The mean minimum temperature for January is 5.3◦C, the mean maximum temperature for July is 42.7◦C and the mean number of days with a minimum temperature of 0 ◦C or less is 9 days (data from Headquarters of Natural Re-sources of Yasuj, HNRY). The following figures are based on woodland inventory data gathered by the HNRY in 2003: oak (Q. persica) 79%, wild almonds (Amygdalus spp.) 9%, wild pistachio (Pistacia mutica) 5% and other species 7% are the most frequent woody species.
Cratae-gus sp. and Acer cinerascens are the most important shrub species. Soils vary from moderately deep, well-drained sandy loams to steep gravel slopes with rock outcrops. These soils are classified mainly as lithic lep-tosols and calcaric regosols (HNRY data). The average annual volume growth of Persian oak in southern Zagros is reported to be around 0.7 m3 ha−1 year−1 [12].
Today, livestock grazing on the woodland understory and collection of fuel wood and acorns are the principal objectives of traditional forest management of Persian oak by inhabitants in this forested region, while in pre-vious decades trees were cut to obtain poles for rural house construction [22]. The field inventory data in 2003 by HNRY (more details in the data section) shows that more than 50% of the inventoried plots did not have any woody species regeneration and that 54% of the oaks were in coppice form. The cutting of trees has been prohibited for around three decades, which has caused stability in crown cover density and in the number of large trees [22]. Consequently, letting trees grow old also causes a relatively high rate (20%) of bad quality oak trees (HNRY’s inventory data).
Figure 1: Location of the study area within the province of Kohgiluyeh va Boyer Ahmad, Iran.
in every diameter class after cutting or natural mortal-ity. The sprouts possibly coming up from the roots are ignored. Seed regeneration is modeled as a fixed value per period and region.
The forest area is distributed on R different regions. The reasons for this in the current study are that the natural seed regeneration, the recovery of fuel wood and the initial state of the forest vary as functions of distance from the village. The model operates with a total ofT time periods of equal length. Apart from stems of natu-ral seed regeneration and sprouts, the model keeps track of K diameter classes of established trees. The model operates with a number of parameters whose value will determine the outcome of processes such as regeneration, mortality, and growth. The values of the parameters are established in the data section following the model de-scription below.
Eq. (1) presents the number of stems of seed regener-ation in regionrat the beginning of timet+ 1,st+1,r, as:
st+1,r=ηr ∀ t∈1, . . . , T−1;r∈1, . . . , R, (1)
where ηr is a constant regeneration rate per hectare in regionr.
Eq. (2) presents the number of sprouts found in region rat the beginning of timet+ 1,ct+1,r, as:
ct+1,r= K
i=1
(hitr+mitr)·σ
∀t∈1, . . . , T−1;r∈1, . . . , R, (2)
wherehitrandmitrare, respectively, the number of
har-vested trees and the number of trees that are dying in diameter class i in period t in region r. The expected number of sprouts for a dead or a harvested tree is given by σ. Together,st,r andct,r represent the recruitment
base for established trees in diameter class 1.
Eq. (3) presents the number of trees that die in class iduring periodtin regionras a function of the number of trees left after harvest, i.e.:
mitr= (nitr−hitr)·μ
∀ i∈1, . . . , K; t∈1, . . . , T;r∈1, . . . , R, (3)
where nitr is the number of trees in diameter class i
at the beginning of period t in region r and μ is the mortality rate of established trees.
The transitional processes from a diameter class to a higher diameter class are presented in Eqs. (4)–(6). The number of trees in diameter class i, (i= 2, K− −1), in periodt+ 1 in regionris given as the sum of surviving trees of the previous period that remain in class i and
those that transition from classi− −1, i.e.:
ni,t+1,r= (nitr−hitr)·(1−γi)·(1−μ) +
(ni−1,t,r−hi−1,t,r)·γi−1·(1−μ)
∀ i∈2, . . . , K−1;t∈1, . . . , T−1;r∈1, . . . , R, (4)
whereγi is the growth ratio, i.e., the probability that a tree in class i that has not died or been harvested will be found in diameter classi+ 1 in the next period.
The number of trees in the limiting diameter classes 1 and K are modeled slightly differently. The number of trees in the first diameter class in periodt+ 1 in region r is given as the sum of surviving trees of the previous period of: (i) natural seed regeneration, (ii) sprouts and (iii) established trees after harvest that remain in the class, i.e.:
n1,t+1,r =str·ςs+
ctr·ςc+ (n1tr−h1tr)·(1−γ1)·(1−μ)
∀t∈1, . . . , T −1;r∈1, . . . , R, (5)
where ςs and ςc are the survival rates for natural seedlings and sprouts, respectively, i.e., the probability that a natural seedling and a sprout, respectively, will survive and enter the first diameter class. The number of trees in diameter classK in period t+ 1 in region r is given as:
nK,t+1,r= (nKtr−hKtr)·(1−μ) +
(nK−1,t,r−hK−1,t,r)·γK−1·(1−μ)
∀t∈1, . . . , T−1;r∈1, . . . , R. (6)
The collection of dead wood for fuel and harvesting of oak trees as poles are the two main traditional activities in these woodlands. The volume of recovered fuel wood in periodtfrom region ris presented in Eq. (7) as:
vftr=
K
i=1
mitr·υi·ρr·αr
∀ t∈1, . . . , T;r∈1, . . . , R, (7)
where υi is the average volume of the tree in diameter
class i, and ρr and αr are the recovery factor of fuel
wood and the area in regionr, respectively.
The volume of harvested wood in periodtfrom region ris given in Eq. (8) as:
vhtr= K
i=1
hitr·υi·αr
∀ t∈1, . . . , T;r∈1, . . . , R. (8)
period, all obtained from the HNRY inventory in 2003, is given as:
s1r=sr;c1r=cr; ni1r=nir
∀ i∈1, . . . , K;r∈1, . . . , R (9)
We also require all variables to be nonnegative, i.e.:
s, c, m, n, h, vh, vf ≥0. (10)
So far, the physical or technical part of the problem has been presented. The following two sets of relations (11 and 12), together with the objective function (13), bring in the policy issues:
R
r=1
vht+1,r≥
R
r=1
vhtr ∀t∈1, . . . , T−1, (11)
ni,T−τ,r=niT r ∀i∈1, . . . , K;r∈1, . . . , R. (12)
Both sets ensure some kind of sustainability of the system. Eq. (11) requires that the harvested volume is nondeclining over time and ensures a steady resource flow from the forest. Initial experimentation with the model showed that without this constraint the initial harvests would be far too high. In contrast, fuel wood collection is not constrained. This is so because fuel wood collection here is a strict function of the state. Eq. (12) requires that the diameter distribution before harvest in each region in periodT−τ andT should be the same. Inspection of the solutions reveals that this requirement in effect means that you establish a steady state in periodT − −τ that is maintained thereafter.
The objective function maximizes the value of fuel wood and harvested wood, i.e.:
M ax
T
t=1
R
r=1
(whr·vhtr·δt+wfr·vftr·δt), (13)
wherewhrandwfr are the weight or value attached to a harvested cubic meter and a cubic meter of collected fuel wood in region r, respectively, andδtis the discount factor in periodt.
2.3 Data. Data about the distribution of oaks in di-ameter classes (dbh) were utilized from a systematic in-ventory with 0.52% sampling intensity, conducted by HNRY in spring 2003 on 171 sample plots. The plots with an area of 0.2 ha were rectangular (40 m×50 m) with distances of 200 m ×500 m between plot centers. Numbers of regenerated oaks from both seed and sprouts with a height less than 0.3 m were recorded in subplots with an area of 100 m2 (10 m × 10 m). A few stems that either were below breast height or had a dbh less
than 2.5 cm were, for simplicity, counted with the stems in the first class (5 cm).
The model was prepared for three regions (R= 3) that were constructed as overlapping circles with a radius of 2, 4 and 6 km, from the village respectively. Given that the total forest area is 5848 ha and assuming that the relative forested area is the same in each sector, the for-est areas are 650, 1949 and 3249 ha in regions 1, 2 and 3, respectively. The corresponding number of sample plots to regions was 50, 73 and 48, respectively.
One of the most important elements of the diameter class model is the growth model. Assuming a uniform distribution of the trees in a diameter class, the transi-tion probability of a tree advancing from diameter class itoi+ 1 can be calculated asγi=gi/w, wheregi is the
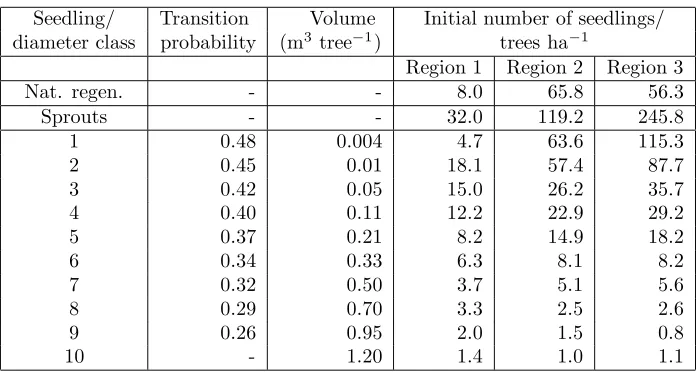
average periodic diameter increment of diameter classi and w is the width of the class [6, 27]. The transition probabilities were based on the annual diameter growth in 5-cm classes of a forest area with almost similar con-ditions to our forests in southern Zagros, the Monj and Bard-Karkhaneh forest, presented by [12]. The growth period was set to 5 years, not single years. This was due partly to keep the model small, and partly to have tran-sition probabilities somewhat close to 0.5. The classes have mid-class diameters from 5 cm to 50 cm, meaning that K = 10. The growth model is presented in Table 1.
The proportion of plots with regeneration in the HNRY inventory was 0.13, and it was taken as the proba-bility of regeneration being established. The occurrence of natural regeneration per hectare was assessed by re-gressing the number of seedlings on distance from the village for the plots with natural regeneration. This re-sulted in the function ES(d) = exp(3.95 + 0.375×d) (R2= 0.30), wheredis the distance in km from the vil-lage. The number of regenerated trees per hectare at any given time, ES(d)×0.13, then becomes 9.55, 19.50 and 39.82 for the three regions, respectively. The total recruitment base during a 5-year period,ηr, is thus five times this measure, or 47.74, 97.50 and 199.10, respec-tively.
Based on data from the Monj and Bard-Karkhaneh forest, Persian oak between 100 and 200 years old has a good propensity to produce a large amount of sprouts. This range encompasses especially diameters between 20 and 45 cm. After cutting the trees down, there were no sprouts on 18.2% of the stumps. On average, there were 4.7 sprouts on each stump that yielded sprouts, yielding an expected number of sprouts per dead tree,σ, of 3.85. Here, it is assumed that mortality and cutting produces the same amount of sprouts.
transi-Table 1: Growth and volume parameters and initial state of the forest.
Seedling/ Transition Volume Initial number of seedlings/ diameter class probability (m3tree−1) trees ha−1
Region 1 Region 2 Region 3
Nat. regen. - - 8.0 65.8 56.3
Sprouts - - 32.0 119.2 245.8
1 0.48 0.004 4.7 63.6 115.3
2 0.45 0.01 18.1 57.4 87.7
3 0.42 0.05 15.0 26.2 35.7
4 0.40 0.11 12.2 22.9 29.2
5 0.37 0.21 8.2 14.9 18.2
6 0.34 0.33 6.3 8.1 8.2
7 0.32 0.50 3.7 5.1 5.6
8 0.29 0.70 3.3 2.5 2.6
9 0.26 0.95 2.0 1.5 0.8
10 - 1.20 1.4 1.0 1.1
tion probabilities. Because cutting and looping of trees has not been practiced for some time, one could as-sume that the current diameter distribution reflects the mortality rate. In addition, implicit in the transition probabilities is the expected time it would take for a tree to go from one diameter class to the next. Thus, the probability that a tree belonging to diameter class i would die during a 5-year period could be computed as 1−(ni+1/ni)5/ti, where ni is the average number of
trees per hectare according to the HNRY inventory and tiis the expected number of years for a surviving tree to
go from classito classi+ 1, i.e., 5/γi. This calculation
yielded a varying quota, for instance 5%, 29% and 7%, for the first three diameter classes, respectively. Because there is no reasonable physical logic behind this result, an average mortality rate was calculated by weighing the mortality rate of each diameter class with the number of trees in that class, resulting in a mortality rate of 15%. Abrahimi and Jahanbaz, cited in [12], observed a sur-vival rate of sprouts of 15% in southern Zagros. This figure will be used here as the survival rate for sprouts, ςc. There is, however, no reliable data on the survival
rate of natural regeneration, ςs. Instead, the model
it-self was used to derive a survival rate for natural regen-eration. The underlying assumption was that with no harvest under the conditions found in the most remote region, a steady state would eventually be established. With a projection period of 300 years, a survival rate, ςs, of 5% satisfied this requirement. That the survival rate for sprouts is higher than that for acorn seedlings is logical because sprouts, contrary to acorn seedlings, are supported by stems with more powerful roots.
In an unpublished paper by the authors about the im-pacts of forest-based activities on the attributes of the
Ganaveh woodland, [23] reported that far from all the available fuel wood is recovered. It is reasonable to as-sume that the recovery factor, the proportion of volume of natural mortality that is retrieved, will decrease with distance from the village. Making the arbitrary assump-tion that the recovered amount in region 2 will be half of that in region 1, and in region 3 half of that in region 2, we determine that 57%, 29% and 14% of the available fuel wood is recovered from regions 1, 2 and 3, respec-tively. [23] reported a collected amount corresponding to 126 m3year−1(740 kg m–3 wood). The recovery factors ρr then becomes 26.3%, 3.5% and 0.9% for regions 1, 2
and 3, respectively, when the collected volume is set in relation to the total volume of mortality assessed from the current diameter distribution in each region, the vol-ume per tree (see below) and the mortality rate, ςc, of 15%.
The tree volume for diameter classi, i={1, . . . , K}, υi, was obtained from the volume table of Persian oak [12] (see Table 1). The state of the forest according to Inventory 2003 is also presented in Table 1. A dis-count rate of 3% per year was used for computing the discount factors δt, t={1, . . . , T}. The planning hori-zon was set to 150 years, i.e.,T = 30. The steady state condition (12) is invoked 10 periods before the ending period, i.e., τ = 10. The linear programming problems were solved with MINOS [17]. Solving the problems, in-cluding matrix generation, took a couple of seconds with a PC with a 1.8 MHz processor.
3
Results
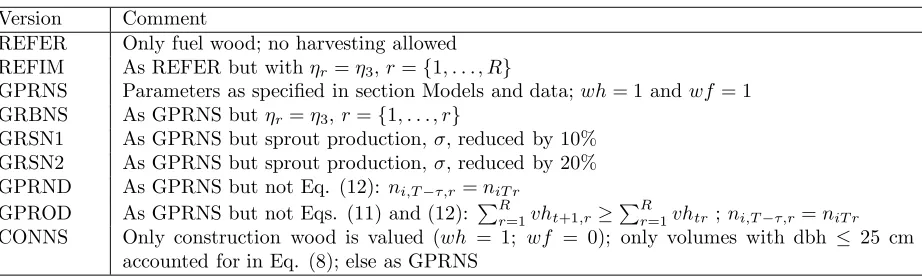
RE-Table 2: Description of the versions.
Version Comment
REFER Only fuel wood; no harvesting allowed REFIM As REFER but withηr=η3,r={1, . . . , R}
GPRNS Parameters as specified in section Models and data;wh= 1 and wf = 1 GRBNS As GPRNS butηr=η3,r={1, . . . , r}
GRSN1 As GPRNS but sprout production,σ, reduced by 10% GRSN2 As GPRNS but sprout production,σ, reduced by 20% GPRND As GPRNS but not Eq. (12): ni,T−τ,r =niT r
GPROD As GPRNS but not Eqs. (11) and (12): Rr=1vht+1,r≥Rr=1vhtr; ni,T−τ,r=niT r CONNS Only construction wood is valued (wh = 1; wf = 0); only volumes with dbh ≤ 25 cm
accounted for in Eq. (8); else as GPRNS
FER reflects the current management, i.e., harvesting is not allowed, meaning that hitr = 0 and Eqs. (11) –
(13) are not in effect. REFIM is identical to REFER except that animal grazing is controlled such that nat-ural regeneration could occur in all regions as it does in the furthermost region. Version GPRNS is the base model, and is specified according to Eqs. (1) – (13) and with the parameters set as above. Harvested wood and collected fuel wood is valued equally, a possible inter-pretation being that everything is used as fuel. GRBNS analyzes what would happen if foraging could be con-trolled as in version REFIM. GRSN1 and GRSN2 are sensitivity analyses of the sprout recruitment parame-ter. GPRND and GPROD are there to assess the cost of the nondeclining harvest constraint and the steady state requirement, i.e., Eqs. (11) and (12). Finally, ver-sion CONNS should illuminate the management impli-cations of harvesting only for construction purposes. A maximum dimension of 25 cm is set because the quality of larger trees tends to be too poor [9, 12].
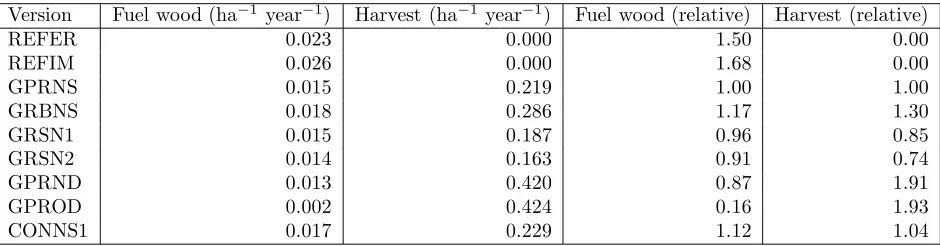
The production of harvested wood and fuel wood over the first 100 years, the period for which no steady state requirement is imposed, is presented in Table 3. For all versions with harvest except GPROD, the nondeclining harvest constraint forces the solution to a constant har-vest level over the entire planning horizon, making the comparison of harvests over time easy. Production of harvested wood increases by 30% when compared with GPRNS if foraging can be controlled. If sprout occur-rence is reduced by 10% and 20%, the output is reduced by 15% and 26%, respectively.
The steady state condition for periods 20–30 has a large effect on the result; if it is removed, as in version GPRND, the harvest level almost doubles. If, in addi-tion to that, the nondeclining constraint is removed, as in version GPROD, the average harvests increase only slightly more. The big difference between GPRND and GPROD is the harvests over time; whereas the harvest
in GPRND is 12,000 m3 in each period, the harvest in GPROD is 91,000 m3in the first 5-year period and then drops to a level of about 9,000 m3per period. Due to the rather unorthodox or unrealistic harvest pattern, version GPROD will be left out in the following discussion.
Despite the fact that in version CONNS only wood≤ 25 cm dbh is accounted for and that fuel wood is not ac-counted for in the objective function, the resulting man-agement yields more harvested wood and fuel wood than the base version. This is an effect of the nondeclining harvest constraint. Because harvests in diameter classes above 25 cm are not accounted for, they can be under-taken without affecting this constraint. Thus, cuttings in these diameter classes are used to regulate the forest and subsequently increase the overall production level.
Collected fuel wood is 10–20 times lower than the har-vested volumes (Table 3). For GPRNS, it amounts to an average of 90 m3year−1compared with 1283 m3year−1 of harvested wood. The pattern over time is more or less the same for all versions with harvest, i.e., the amount of fuel wood starts at about 120 m3year−1 and gradu-ally reduces to about 30 m3year−1after 100 years. This also reflects a reduction in standing volume from some-where below 20 to about 8 m3ha−1. Current procedures, version REFER, give substantially more fuel wood than when harvests are introduced. Another 18% is achieved when animal grazing is controlled. However, they all start at about the same level and it is only at year 50 that REFER gives about 50% more fuel wood than the other versions. This is also the time when REFIM starts to depart from REFER in terms of fuel wood.
Inspecting the regional pattern of harvests reveals that region 1 generally yields very small harvest volumes, at least for the first 50 years. It appears that because har-vests are constrained, region 1 is reserved mostly for fuel wood collection and, in later periods, to even out the harvest level.
Table 3: The amounts of collected fuel wood and harvested wood (ha−1) and year (m3) over the first 100 years and the corresponding relative amount relative to version GPRNS. Fuel wood as if collected although not valued in the model; harvested volume only with dbh≤25 cm.
Version Fuel wood (ha−1 year−1) Harvest (ha−1 year−1) Fuel wood (relative) Harvest (relative)
REFER 0.023 0.000 1.50 0.00
REFIM 0.026 0.000 1.68 0.00
GPRNS 0.015 0.219 1.00 1.00
GRBNS 0.018 0.286 1.17 1.30
GRSN1 0.015 0.187 0.96 0.85
GRSN2 0.014 0.163 0.91 0.74
GPRND 0.013 0.420 0.87 1.91
GPROD 0.002 0.424 0.16 1.93
CONNS1 0.017 0.229 1.12 1.04
substantially between versions. It also varies over time for the same version. (We limit the analysis here to the first 100 years and to regions 2 and 3 due to the limited and irregular harvests in region 1). There is a tendency that the less regeneration you get, the lower the diameter classes that are harvested. In version GPRNS, harvests are mostly in diameter class 3 during the first 50 years, then in class 4. With reduced sprout regeneration, according to GRSN1, cuttings will be in classes 2 and 3 in the first 20 years and almost only in class 4 in the last 50 years, whereas GRSN2 leads to cuttings almost only in class 2 for the first 30 years and a switch to class 3 thereafter. With increased natural regeneration, according to GRBNS, cuttings will dominate in class 4 for the first 50 years, then in class 5 and higher.
With less constrained versions, you tend to get more pure diameter class harvesting policies, as expected. Re-moving the steady state condition, as in GPRND, results in harvests in class 7 and above. When production is geared for construction wood (CONNS), there is a pure class 5 harvesting policy for the first 70 years with har-vests only from region 3, thereafter in class 4. Year 95 cuttings are in almost all classes in all regions to adapt to the steady state condition.
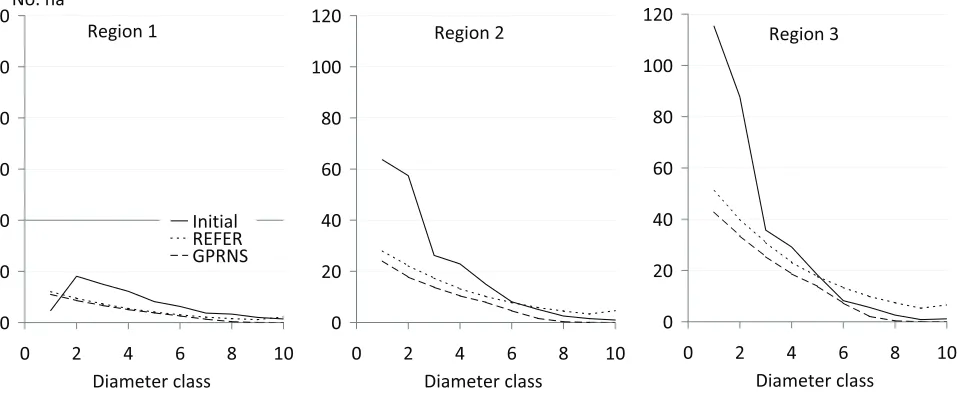
Fig. 2 demonstrates that the steady state distribution imposed in year 100 could vary substantially between re-gions, although the only differences in management con-ditions, apart from the initial diameter distributions, are natural regeneration and fuel collection efficiency. Even though the management in REFER and GPRNS are dif-ferent, at least in regions 2 and 3, the distributions are fairly similar for the smaller classes, indicating that nat-ural regeneration has a decisive influence on the distri-bution. It can also be noted that the distributions after 100 years of all versions are associated with an inverse J-shape and that there is a marked difference between the initial and final distributions for the smaller classes.
4
Discussion
The model gives perspective to a number of manage-ment issues. Roughly, about 10 times more volume could be recovered in case cutting of trees was allowed. Thus, the present prohibition of harvests seems counterproduc-tive. Engaging people in harvesting could add to the diversification of income sources already observed in the area in an unpublished paper about livelihood depen-dency on the woodland resources by [23].
The REFIM version in some way reflects the current efforts of the forest authority, i.e., to control animal grazing while maintaining the ban on tree cutting. The model suggests that this will only have limited effect on the collected amounts of fuel wood, and then not until about 50 years from now. The effect of improved pro-tection of natural regeneration is more pronounced if it is combined with harvesting trees. The harvest level is then increased by about 30% when compared with the case with today’s level of natural regeneration.
Neverthe-0 20 40 60 80 100 120
0 2 4 6 8 10
Diameter class Initial REFER GPRNS Region 1
No. ha-1
0 20 40 60 80 100 120
0 2 4 6 8 10
Diameter class Region 2
0 20 40 60 80 100 120
0 2 4 6 8 10
Diameter class Region 3
Figure 2: Diameter distribution (stems ha−1) for different regions; the initial distribution, and the distributions before harvest in period 20 for alternatives REFER and GPRNS.
less, we could find a poor relationship between recruits and distance of plots from the village. Yet the fact that the steady state diameter distribution in year 100 has less trees in smaller classes than the current distribution may indicate an underestimation of regeneration.
For the assessment of mortality of sprouts, some em-pirical evidence could be used. This was not the case with the mortality of natural seed regeneration. In-stead, it was derived from the model itself, assuming that the rest of the model was correct and a steady state would eventually develop. However, the relative flatness, especially in the relatively undisturbed region 3, of the inverse J-shaped diameter distributions of the model runs in year 100 compared with today’s situation indicate that mortality may be underestimated.
The assumption of a constant mortality rate over di-ameter classes is a simplification. It still appears to be a valid approximation since the diameter distribution at steady state tends to the classic, or ideal, inverse J-shaped distribution [7, 16]. This is to be expected for a forest of the kind presented here, i.e. a forest where the competition between trees is small [5].
Here, we use the simplest diameter class model possi-ble, i.e., a model with constant transition probabilities. A number of models have been suggested that are den-sity dependent; thus, they have transition probabilities that are in some way dependent on the amount of trees in the class or in the stand [4, 13, 27]. The density in-dependence should however not , be of major concern in this semiarid forest where trees rarely compete with each other. The transition probabilities may still be put
to question because they yield an expected age of the larger diameter classes that is clearly below observed values (data from the Monj and Bard-Karkhaneh forest in [12], thus indicating an overestimation of growth.
In summary, there is clearly need for better empiri-cal support of the model parameters. What would be most adequate would be field data including repeated measurements on permanent sample plots to estimate recruitment, stand growth, mortality and survival rates. However, not only the growth and yield parameters of the model need to be scrutinized. It is also clear that how the objectives and constraints are introduced is of importance. One relates to the implementation of the management actions and the values associated with them. For instance, it has been assumed that all cut trees can be recovered, and, contrary to fuel wood, that there is no cost related to distance of transport.
Another question is raised by the observation that in many areas of the Zagros region, utilization of nontim-ber forest products (NTFPs) has higher value than uti-lization of timber [24]. In [23] the authors report that one of those NTFPs is acorns, a source that requires a management strategy that considers tree diameter and the relationship between crown size and per unit crown area production [11]. In addition, the results could indi-cate that management makes the diameter distribution less steep, and encompass a smaller range of diameters, which in turn could be translated into diminished biodi-versity [14].
steady state condition that equates the diameter dis-tributions between years 100 and 150. Steady state regimes can be viewed as ideal conditions that manage-ment could strive for [2]. The results indicate that such requirements need to be handled with care. That the CONNS version can satisfy the constraint by harvesting and, in principle, leave the stems behind, is a sign of an unfortunate combination of requirements. Another issue concerns the objective function and the doubtful realism of discounting values. Intertemporal transfer of values requires access to financial markets, which probably is not an option for most of the villagers of Ganaveh. In practice, at least in this case, it is probably of limited importance because the nondeclining harvest, in combi-nation with the steady state condition, sets a level that is not affected by the discount rate; maximizing the har-vest level would yield the same solution.
5
Conclusion
The presented model deals with the management and distribution of diameter classes to predict the effects of different forest management practices on growth and yield of uneven-aged mixed coppice stands of Persian oak in the semiarid forests of the Ganaveh woodland. Although the present model has many parameters with an uncertain value, it should be viewed as a preliminary model with the potential to be developed with informa-tion that is more accurate.
The model appears to be a viable option for policy de-velopment as it generates results with bearing on such issues. Controlling the animal grazing and maintain-ing the ban on tree cuttmaintain-ing reflects the current efforts of the forest authority to preserve the woodland. The prohibition of harvests seems counterproductive, as har-vested volumes could be about 10–20 times larger than the current level of fuel wood collection. Without har-vesting, the model suggests controlling animal grazing will only have limited effect on the collected amounts of fuel wood, and then not until about 50 years from now. The effect of improved protection of natural re-generation becomes more pronounced if it is combined with harvesting of trees. The model runs also show that the policy regulations associated with harvesting are im-portant. A steady state requirement is highly restrictive on the production level, whereas a nondeclining harvest constraint regulates when harvests are allocated in time. Management regimes should be fairly straightforward to implement as they can be specified by diameter limit rules.
Because of a number of critical assumptions of the model parameters, the predictions of the model are uncertain. There is clearly need for better empirical support of the model parameters. The exercise shows
that sensitivity analyses can be performed that indicate where better data is most needed. In this paper, we choose only to test the sprout production parameter; it appears that the value of this parameter has such an influence on the long run harvest level that it could mo-tivate further field studies.
Further refinements are needed for the modeling of livelihood implications. Engaging people in harvesting could add to the diversification of income sources already observed in the area. NTFPs should be accounted for and management costs added. With better understand-ing of the growth and yield conditions and the livelihood dependency of the inhabitants, the presented modeling framework could be an effective tool in policy develop-ment in dialog with stakeholders.
6
Acknowledgement
The authors would like to thank all staff in the office of the Preservation Plan for Zagros Forests at the Head-quarters of Natural Resources of Yasuj, Iran, for their assistance with data collection. We would also like to thank the peer review input from the reviewers.
References
[1] Buongiorno J. 2001. Quantifying the implications of transformation from even to uneven-aged forest stands. Forest Ecology and Management, 151(1– 3):121–32.
[2] Buongiorno J, Gilless JK. 2003. Decision methods for forest resource management. Amsterdam: Aca-demic Press.
[3] Buongiorno J, Michie BR. 1980. A matrix model of uneven-aged forest management, Forest Science, 26(4):609–25.
[4] Buongiorno J, Peyron JL, Houllier F, Bruciamac-chie M. 1995. Growth and management of mixed-species, uneven-aged forests in the French Jura— implication for economic returns and tree diversity. Forest Science, 41(3):397–429.
[5] Coomes DA, Duncan RP, Allen RB, Truscott. 2003. Disturbances prevent stem size-density distribu-tions in natural forests from following scaling re-lationships J. Ecology Letters; 6: 980–989.
[6] Davis LS, Johnson KN, Bettinger P, Howard T. 2001. Forest management. 4th ed. New York: McGraw-Hill.
[8] Favrichon V. 1998. Modeling the dynamics and species composition of a tropical mixed-species uneven-aged natural forest: effects of alternative cutting regimes. Forest Science, 44(1):113–24.
[9] Ghazanfari H, Namiranian M, Sobhani H, Mohajer RM. 2004. Traditional forest management and its application to encourage participation for sustain-able forest management in the northern mountains of Kurdistan Province, Iran. Scandinavian Journal of Forest Research, 19:65–71.
[10] Hao QY, Meng FR, Zhou YP, Wang JX. 2005. A transition matrix growth model for uneven-aged mixed-species forests in the Changbai Mountains, northeastern China. New Forests, 29(3):221–31.
[11] Healy WM, Lewis AM, Boose EF. 1999. Variation of red oak acorn production. Forest Ecology and Management. 116(1–3):1–11.
[12] Jazirehi MH, Ebrahimi M. 2003. Silviculture in Za-gros. 1st ed. Tehran: University of Tehran.
[13] Kolbe AE, Buongiorno J, Vasievich M. 1999. Geographic extension of an uneven-aged, multi-species matrix growth model for northern hardwood forests. Ecological Modelling, 121(2–3):235–53.
[14] Krebs C. 1989. Ecological methodology. New York: HarperCollins.
[15] Menitsky YL. 2005. Oaks of Asia. An.A. Fedorov (ed.); translated from Russian. Enfield, NH: Science Publishers.
[16] Meyer HA, Stevenson DD. 1943. The structure and growth of virgin beech-birch-maple-hemlock forests in northern Pennsylvania. J. Agr. Res., 67, 465–484.
[17] Murtagh BA, Saunders MA. 1983. MINOS 5.0 users guide. Stanford.
[18] Porte A, Bartelink HH. 2002. Modelling mixed for-est growth: a review of models for forfor-est manage-ment. Ecological Modelling, 150(1–2):141–88.
[19] Pourhashemi M, Mohajer MRM, Zobeiri M, Amiri GZ, Panah P. 2004. Identification of forest veg-etation units in support of government manage-ment objectives in Zagros forests, Iran. Scandina-vian Journal of Forest Research, 19:72–7.
[20] Pretzsch H, Biber P, Dursky J, von Gadow K, Hasenauer H, Kandler G, et al. 2002. Recom-mendations for standardized documentation and further development of forest growth simulators. Forstwissenschaftliches Centralblatt, 121(3):138– 51.
[21] Rackham O. 2001. Trees & woodland in the British landscape: the complete history of Britain’s trees, woods & hedgerows. London: Phoenix Press.
[22] Salehi A, Wilhelmsson E, S¨oderberg U. 2008. Land cover changes in a forested watershed, southern Zagros, Iran. Land Degradation & Development, 19(5):542-53.
[23] Salehi A, Chiwona Karltun L, Sderberg U, Eriks-son LO. 2009. Livelihood dependency on woodland resources in southern Zagros, Iran. (Unpublished Report)
[24] Sagheb-Talebi K, Sajedi T, Yazdian F. 2004. Forests of Iran [in Persian with English summary]: Re-search Institute of Forest and Rangelands, Iran.
[25] Sands R. 2005. Forestry in a global context. Wallingford.
[26] Shao GF, Wang F, Dai LM, Bai JW, Li YS. 2006. A density-dependent matrix model and its appli-cations in optimizing harvest schemes. Science in China Series E-Technological Sciences, 49:108–17.