Ministro:Fernando Haddad Reitor: Antˆonio Nazareno Guimar˜aes Mendes
Vice-Reitor:Jos´e Roberto Soares Scolforo
Pr´o-Reitora de Pesquisa: Edila Vilela de Resende Von Pinho´ Editora UFLA
Presidente do Conselho Editorial:Renato Paiva Volume 10, no. 2, June of 2011. Editorial Board
Editor-in-Chief Scientific Editors
Luiz Henrique Andrade Correia, UFLA, Brazil Gabriel Paillard, UFC, Brazil Executive Editors Hor´acio Hideki Yanasse, INPE, Brazil Heitor Augustus Xavier Costa, UFLA, Brazil Jo˜ao M. R. da S. Tavares, FEUP, Portugal
Sanderson Lincohn Gonzaga de Oliveira Muthu Ramachandran, Leeds Metr. Univ., UK Tales Heimfarth, UFLA, Brazil Pl´ınio de S´a Leit˜ao J´unior, UFG, Brazil
Associate Editors
Abdelmalek Amine, Univ. Djillali Liabes-Sidi, Algeria Alceu Britto Jr., PUC-PR, Brazil Alessandra Alaniz Macedo, USP, Brazil Alessandro Marchetto, IRST, Italy
Alice Kozakevicius, UFSM, Brazil Anderson de Rezende Rocha, Unicamp, Brazil Anita Fernandes, UNIVALI, Brazil Antonio Maria Pereira de Resende, UFLA, Brazil Antonio Pedro Timoszczuk, USP, Brazil Ant´onio Ribeiro, European Commission, Italy
Arnaldo de Albuquerque Ara´ujo, UFMG, Brazil Aruna Ranganath, Bhoj Reddy Eng. Col. for Women, India Aswani Kumar Cherukuri, VIT University, India Ayyaswamy Kathirvel, KVCET, India
Bruno de Oliveira Schneider, UFLA, Brazil Carlos de Castro Goulart, UFV, Brazil Claudio Cesar de S´a, UDESC, Brazil Claudio R. Jung, UNISINOS, Brazil Daniel Mesquita, UFU, Brazil Deepak Dahiya, ITM Gurgaon, India Denilson Alve Pereira, UFLA, Brazil Eder Mateus Nunes Gon¸calves, FURG, Brazil Elisa Huzita, UEM, Brazil F´abio Levy Siqueira, USP, Brazil
Fatima L. S. Nunes, USP, Brazil Frank Jos´e Affonso, UNESP, Brazil
Giovani Rubert Librelotto, UFSM, Brazil Heitor Augustus Xavier Costa, UFLA, Brazil Hernan Astudillo, Univ. Tec. Federico Santa Maria, Chile Hyggo Almeida, UFCG, Brazil
Ilda Reis, FEUP, Portugal Ildeberto Aparecido Rodello, USP, Brazil
Jo˜ao Carlos Giacomin, UFLA, Brazil Jo˜ao Manuel R. S. Tavares, Universidade do Porto, Portugal Joaquim Quinteiro Uchˆoa, UFLA, DCC Johan M. Sharif, Swansea University, UK
Jorge Martinez-Gil, University of Malaga, Spain Jorge Rady Almeida Junior, USP, Brazil Jos´e Lu´ıs Braga, UFV, Brazil Luciana A. F. Martimiano, UEM, Brazil Luciano Jos´e Senger, UEPG, Brazil Luiz Camolesi Jr., Unicamp, Brazil Luiz Carlos Begosso, FEMA, Brazil Luiz Eduardo G. Martins, UNIMEP, Brazil Luiz Henrique Andrade Correia, UFLA, Brazil Marco Aurelio Gerosa, USP, Brazil Marcos A. Cavenaghi, UNESP, Brazil Marco Tulio Valente, UFMG, Brazil Maria Istela Cagnin, UFMS, Brazil Michel S. Soares, UFU, Brazil
Muthu Ramachandran, Leeds Metr. Univ, UK Nandamudi Vijaykumar, LAC-INPE, Brazil Omar Andres Carmona Cortes, CEFET/MA, Brazil O. P. Gupta, Punjab Agricultural Univ., India Pl´ınio S´a Leit˜ao J´unior, UFG, Brazil Priti Sajja, Sardar Patel University, India Rajkumar Samanta, Megnad Saha Inst.Tech., India Raquel O. Prates, UFMG, Brazil
Reghunadhan Rajesh, Bharathiar Univ., India Renato de F. B. Neto, Innolution Sist., Brazil Ricardo Terra, UFMG, Brazil Ricardo da Silva Torres, Unicamp, Brazil Rodrigo Fernandes de Mello, USP, Brazil Roger Pizzato Nunes, UFPel, Brazil
Rog´eria Cristiane Grat˜ao Souza, UNESP, Brazil Rosˆangela A. Delosso Penteado, UFSCar, Brazil Sanderson Lincohn Gonzaga de Oliveira, UFLA, Brazil Udo Fritzke Jr., PUC-Po¸cos, Brazil
Valter F. Avelino, USP, Brazil Valter Vieira de Camargo, UFSCar, Brazil Vitus S. W. Lam, University Hong Kong
Technical staff: Ariana da Silva Laureado, T´ulio Vono Siqueira (Secretary); Jaqueline Alvarenga Silveira, and J´essica Renata Nogueira.
Indexed in: INSPEC;Qualis-CAPES.
INFOCOMP – Journal of Computer Science – v.10, n.2 (2011) – Lavras: Universidade Federal de Lavras, 2011.
Anual (1999 - 2003), Semestral (2004), Trimestral (2005 - ) Sum´arios em Inglˆes
ISSN 1807–4545
1. Ciˆencia da Computa¸c˜ao I.Universidade Federal de Lavras. II. Departamento de Ciˆencia da Computa¸c˜ao.
A survey of point insertion techniques in bidimensional Delaunay
Triangulations
S. L. G.DEOLIVEIRA
UFLA - Universidade Federal de Lavras DCC - Departamento de Ciência da Computação
P.O. Box 3037 - Campus da UFLA 37200-000 - Lavras (MG) - Brazil
Abstract. Triangulations are geometric discretizations essential in many scientific applications, such as engineering simulations, visualizations, and geographic information systems. The preferred shape of a triangle depends on the applications. Theoretical and experimental analysis of numerical methods that are used in conjunction with triangulations suggest that triangles with no large angles and/or small angles serve well in most applications. This paper is a brief review of a point insertion in 2D Delaunay Triangulations. Important works on the insertion of vertices in Delaunay Triangulations are described as a start point for one who needs to build a quality mesh using adaptive triangular-mesh refinement.
Keywords: Delaunay Triangulation, mesh generation, adaptive triangular mesh refinement, computa-tional geometric modeling.
(Received April 10th, 2011 / Accepted June 18th, 2011)
1 Introduction
Triangulations are geometric discretizations essential in many scientific applications, such as engineering simulations, medical imaging, visualizations, and geo-graphic information systems [22]. Erten and Üngör [22] explain that the preferred shape of a triangle depends on the applications. However, theoretical and experimen-tal analysis of numerical methods that are used in con-junction with triangulations suggest that triangles with no large angles and/or small angles serve well in most applications (see [1]). According to Erten and Üngör [22], “in general, the better the shape of the triangles, the smaller the interpolation and approximation errors are in their use”.
Delaunay triangulations are optimum in maximiz-ing the smallest angle [17]. An approach in order to provide quality triangular meshes is to use algorithms based on a automatic point insertion strategy on the De-launay Triangulation. A planar DeDe-launay Triangulation [15] for a point set P is a triangulation DT(P) such that no point in P is inside the circumcircle of any triangle
in DT(P). The Delaunay Triangulation builds the opti-mal triangular mesh. This means that it builds triangles more similar to the equilateral ones for a given fixed point set.
The Delaunay Triangulation and its duals Voronoi Diagram [52] and medial axes have been applied in many different fields, such as the ones earlier cited, in-cluding numerial methods and computer graphics. The reader is referred to Guibas and Stolfi [26] and Barth [4] for properties and algorithms in order to build 2D Delaunay Triangulations. Shewchuk [45] presented as-pects of the Delaunay mesh generation. Edelsbrunner [18] provided a theoretical review on Delaunay Trian-gulation. De Floriani and collaborators [12] reviewed the basic triangulation properties, Delaunay Triangula-tions, constrained and conforming triangulations. They also presented a survey of algorithms for building these kind of triangulations, mainly in the context of digital terrain modeling in geographic information systems.
S. L. G. de Oliveira A survey of point insertion techniques in bidimensional Delaunay Triangulations 2 angle [48]. Triangle’s high-quality mesh generation
is based on Chew-Ruppert Delaunay refinement al-gorithm [41]. Both were surveyed by Shewchuk in [46]. In addition, Shewchuk described Ruppert’s De-launay refinement algorithm in [47]. These algorithms evolved from the works of Chew [7] and Bern et al. [5]. The Chew-Ruppert Delaunay refinement method is modified in Triangle to handle domains with small angles well, following a idea in the paper of Miller et al. [32]. It also incorporates a modification by Üngör [51] that reduces the number of triangles gen-erated. Triangle’s implementation of the divide-and-conquer and incremental Delaunay triangulation algo-rithms follows closely the presentation of Guibas and Stolfi [26]. Triangle uses a triangle-based data structure instead of Guibas and Stolfi’s quad-edge data structure. TheO(nlogn) divide-and-conquer algorithm promoted by Guibas and Stolfi was originally developed by Lee and Schachter [31]. Dwyer [16] showed that the al-gorithm is improved by using alternating vertical and horizontal cuts to divide the vertex set. Triangle uses an expected O(n1/3) time point location scheme pro-posed by Mücke [33]. Triangle’sO(nlogn) sweepline algorithm for Delaunay triangulation is due to Fortune [23], and relies upon Sleator and Tarjan’s splay trees [50]. The earlier description is based on the Triangle’s website [48].
Given a Delaunay Triangulation, one is allowed to insert points (called the Steiner points) in order to com-pute good quality triangulations. This, however, may increase the number of points and triangles in a trian-gulation, which is a key factor in the running time of an application algorithm. The reader is referred to [22] for details and a survey on the context of providing a good triangulation.
After this brief introduction, Section 2 provides a further review of the schemes for point insertion in a Delaunay Triangulation in the context of providing a adaptive refined mesh. Section 3 describes the Voronoi Diagram. Section 4 surveys the Rivara’s schemes and others. Some future directions are given in Section 5.
2 Point insertion in a Delaunay Triangulation
A point insertion in a Delaunay Triangulation is not a trivial task. For example, if one simply inserts a point into the triangle barycenter (Figure 1a), this pro-cess fastly degenerates the triangulation quality, spe-cially along boundaries. This occurs even when car-rying out global refinement. In [38], the authors affirm that a pure Delaunay algorithm does not provide a natu-ral point insertion scheme that guarantees the construc-tion of good-quality nonuniform triangulaconstruc-tions when
the algorithm is iteratively used in the adaptive mesh refinement. They described experiments with the sim-ple centroid insertion (see Figure 1a) concept.
Figure 1:Triangle partition processes: (a)ternary subdivision- re-finement by simple centroid insertion; (b) rere-finement by centroid in-sertion and adding midedges - a second refinement is performed in the bottom right triangle; (c) trisection of the edges, joinning the centroid to those points and also to the vertices.
The literature is rich in approaches to introduce points into the triangulation. These schemes provide high-quality Delaunay Triangulations and some of them are described in the following.
Fowler and Little [24] proposed the vertex inser-tionin conjunction with the Delaunay Triangulation. A Delaunay criterion localizes the position of a potential point to be inserted. This could affect the fit to the cir-cumscribed circle about the triangle. The authors ar-gued that it is sufficient to perform series of domain-limited searches in each triangle of the model; rather than carrying out global searches for the global "worst-fit" points. In this approach, adding a point destroys the original triangle and introduces new triangles. The in-serted point is a vertex of the new triangles. In Figure 2, a point is introduced and the region is triangulated. The reverse operation, known in computer-graphic con-text asdecimation, is performed in order to unrefine the region. In a variation, a point is inserted, the set of tri-angles on its neighborhood are deleted and the region is retriangulated (Figure 3). The inverse operator, the ver-tex removal, deletes a point together with its incident triangles and constructs new triangles in the region.
Figure 2:Vertex insertion and vertex decimation.
Figure 3:Vertex insertion and vertex decimation.
S. L. G. de Oliveira A survey of point insertion techniques in bidimensional Delaunay Triangulations 3 tails in Shewchuk [48]. Chew ([7] and [8]) proposed
a Delaunay improvement algorithm that triangulates a given polygon into a uniform mesh with all angles be-tween 30 and 120. It guarantees that the output mesh is size-optimal within a constant factor amongst all uni-form meshes.
The Hierarchical Delaunay Triangulations (HDT) was proposed by De Floriani and Puppo in [13] and [14]. It is based on a hierarchy of triangle-based sur-face approximations, where each node, except the root, is a triangulated irregular network refining a triangle face belonging to its parent in the hierarchy (see Fig-ure 4). This method is similar to the proposed by Scar-latos Pavlidis in [42]; however, the triangle subdivision is more general. The subdivision inside every macro-triangle is locally a Delaunay Triangulation; whereas a global expanded subdivision of the whole domain ger-ally is not. The triangle partition is performed by an iterative application of a selector process that, at each step, updates the current Delaunay Triangulation by in-troducing the point having the maximum error. More-over, in order to subdivide a triangle for a given hier-archical level, they used a curve approximation algo-rithm [3] in order to insert points along the edges. Af-terwards, points are added in the inner triangle until an error threshold is met throughout the triangle. So, the inner triangle is retriangulated using Delaunay Trian-gulation. The constructing algorithm basis for a HDT must be an on-line approach that incrementally builds a Delaunay Triangulation through iterative point inser-tion [12]. According to Heckbert and Garland [28], the HDT seems to present nearly identical flexibility and speed compared to the one proposed in [42]. How-ever, for a given error threshold, the HDT likely yields slightly better simplification.
Figure 4:Hierarchical Delaunay Triangulations.
Ruppert [41] presented an algorithm to triangulate planar straightline graphs. It guarantees that every tri-angle in the output mesh has smallest tri-angle greater than 278. It produces a size-optimal nonuniform mesh. It is also size-optimal to within a constant factor. The idea behing these algorithms is either: to refine a small
an-gled triangle by the Delaunay insertion of its center; or a modification of the boundary if the circum-circle is external to the meshing region (see [37] for de-tails). Baker [2] published a comparison of edge and circumcenter based refinements. Properties of mesh im-provement for iterative Delaunay refinement based on inserting a point in the circumcenter of triangles to be refined was also established by Shewchuk in [44]. A combination of edge refinement and Delaunay point in-sertion was described by Borouchaki and George in [6] and [25].
Shewchuk [46] presentd a framework for analyz-ing Delaunay refinement algorithms that unifies the mesh generation algorithms of Chew and Ruppert. The Shewchuk’s framework improves the Chew’s and Rup-pert’s algorithms in several ways, and also helps to solve the difficult problem of meshing nonmanifold do-mains with small angles.
Üngör [51] presented an algorithm based on the off-center insertion. In the former case, the off-center of a triangle with the shortest edgepqis a pointoon the bisector ofpqfurthest fromp (orq) such that the an-gle among the three points is a user-specified constraint angle. The idea of usingoff-centersled Har-Peled and Ungor [27] to the design of the first time-optimal De-launay refinement algorithm.
Erten and Üngör [21] proposed algorithms that im-prove the off-center performance with respect to the mesh size and a minimum angle tolerance. This is per-formed by using point selections depending on some triangle cases. Erten and Üngör [20] published a De-launay refinement algorithm that generally terminates for constraint angles up to 42◦.
Erten and Üngör [22] proposed two algorithms to improve the performance of Delaunay refinement. The first one uses the Voronoi Diagram and unifies previ-ously suggested Steiner point insertion schemes (cir-cuncenters [7], [40], [46], sink [19], off-center [51]) together with a proper strategy. The second algorithm integrates a local smoothing strategy into the refinement process. For a given input domain and a constraint an-gleα, the Delaunay refinement algorithms aim to com-pute triangulations with angles at leastα.
Recently, Plaza and collaborators [34] proposed the 7-triangle Delaunay partition (Figure 5). This refine-ment scheme also propagates the refinerefine-ment and inserts non-similar triangles.
Figure 5:7-triangle Delaunay partition
S. L. G. de Oliveira A survey of point insertion techniques in bidimensional Delaunay Triangulations 4
3 Voronoi Diagram
The Voronoi Diagram was proposed in [52]. Shamos [43] was the first to argue that the Voronoi Diagram can be used as a tool to provide efficient algorithms for a wide variety of geometric problems.
Barth [4] defined the Delaunay Triangulation of a point set as the dual of the Voronoi Diagram of the set. The 2D-Delaunay Triangulation is formed by connect-ing two points if and only if their Voronoi regions have a common border segment. If no four or more points are cocircular, then the vertices of the Voronoi Diagram are the triangle circumcenters. Moreover, Voronoi ver-tices represent locations that are equidistant to three or more points.
Consider the Delaunay Triangulation of a setV of planar points. The Voronoi Diagram describes the prox-imity relationship among the points ofV. The Voronoi Diagram of a setV ofn points is a planar subdivision intonconvex polygonal regions. Each region is asso-ciated with a point ofV. Each Voronoi region of each point ofVis the set of planar points which lie closer to the point than to any other point inV. Two points ofV are neighbors when the corresponding Voronoi regions are adjacent [12].
An interface orthogonal to the segment between two centroids facilitates finite-volume approximations. Moreover, it improves the solution accuracy and re-duces the computational effort to approximate a solu-tion of a partial differential equasolu-tion. Furthermore, in this approach, the finite volumes are not the triangles themselves, but the Voronoi Diagram (see Figure 6), i.e. parts of each triangle.
Figure 6:A single Delaunay Triangulation and its dual the Voronoi Diagram.
4 Longest-edge based triangle partition within Delaunay Triangulation
Rivara [35] presented the backward longest-edge refine-ment (BLER) algorithm based on an interesting concept in order to conform the mesh in the finite element con-text: the longest-edge propagation path (LEPP). Briefly, the LEPP keeps a path ofntriangles that have also to be refined for each triangle of the mesh. For example, consider that the triangle t0 is marked to be refined.
The LEPP indicates that the trianglest1, t2,· · ·, tnalso must be refined in order to mantain a conforming good-quality mesh. It propagates the list until the longest-edge shared by triangles tn−1 and tn. This edge is larger than the one of its previous neighbor or tn is in the boundary. Figure 7 shows an example of the LEPP-midedge propagation with 3T-LE partition ap-proach andtn is bisected, wheren=4 in this example. The BLER is a partition procedure that extended both the pure longest-edge refinement algorithms for general nonDelaunay Triangulation (see [39] and the references therein) and the longest-edge refinement algorithm for Delaunay Triangulations proposed by Rivara and Inos-troza [38]. Specifically, the algorithm presented in [38] guarantees that meshes of analogous quality to the input reference-mesh are built.
Figure 7:LEPP-midedge oft0.
Rivara and collaborators ([37] and [49]) presented the LEPP-Delaunay midedge algorithm . It generalized and improved both previous longest-edge algorithms for the Rivara’s refinement of general nonDelaunay Tri-angulations, and the longest-edge algorithm for the re-finement of Delaunay meshes [38].
In the LEPP-Delaunay midedge algorithm, only considering local information associated to the terminal triangle that contains a constrained edge allows a real constrained Delaunay Triangulation. The constrained Delaunay Triangulation is the best approximation of the Delaunay Triangulation containing the set of given seg-ments among its edges.
The LEPP-Delaunay midedge algorithm avoids the interaction with the entire set of constrained items. This algorithm is not a nested partition procedure because it changes the previously existing points. Moreover, it replaces previous triangles by Delaunay triangles due to the circumcircle test of DT(P). In addition, it suf-fers of a looping case for angle tolerance greater than
22◦. Namely, in certain cases, the triangles are not
im-proved during the refinement. Nevertheless, it is inter-esting since it provides meshes with triangles which the smallest angle is greater than or equal toπ/6, including
along boundaries.
S. L. G. de Oliveira A survey of point insertion techniques in bidimensional Delaunay Triangulations 5 construction of nonobtuse triangles in boundary for
LEPP-Delaunay Triangulations within control volume methods. Each 1-edge obtuse boundary triangle is elim-inated by the Delaunay insertion of midedges.
Consider thatαis the smallest angle of the triangle. In the case thatα≥25.4◦, any isolated 1-edge obtuse
triangle and isolated pairs of neighbour 1-edge obtuse triangles sharing their longest edge demand the inser-tion of only one point. Whenα ≥ 15.4◦, the
Delau-nay insertion of at most three boundary/interface points eliminates any isolated 1-edge boundary triangle and isolated pairs of neighbour 1-edge boundary triangles sharing a longest edge. An obtuse angle in each isolated 2-edge boundary triangle having medium-size edge l and longest-size edgeLover the boundary is eliminated by building an isosceles triangle of boundary edges of lengthsl/2 followed by the Delaunay insertion of a fi-nite number of pointsN, whereN ≤ sin2(.14α/2).
A generalization of those approaches solves more complex patterns of obtuse triangles, i.e. chains of 2-edge constrained triangles forming a saw diagram and clusters of triangles that have boundary/interface edges sharing a common vertex [29]. Hitschfeld and collabo-rators [30] presented the LEPP algorithm for Delaunay mesh and its dual Voronoi Diagram, without obtuse an-gles opposite to the boundary and interfaces for semi-conductor device simulation using Box-method Delau-nay meshes.
Rivara and Calderon [36] presented the LEPP-Delaunay centroid algorithm. They proved that the cen-troid version of the LEPP-Delaunay algorithm produces triangulations both with average smallest angles greater than those obtained with the midedge version and with larger smallest edges without suffering from the loop-ing case associated to the midedge method. In addition, the centroid version terminates for high-quality thresh-old angle, i.e. up toπ/5. They also showed that the
centroid version behaves better than the off-center al-gorithm for quality threshold angle larger than25◦.
Because the finite-element conformity requirement, most of those previous articles describe algorithms that propagate the refinement in neighbors of the triangle marked to be refined and/or modify the points of the current mesh. As an example, Rivara and Inostroza [38] pointed out that numerical experiments performed with their 2D algorithm have shown that the number of points inserted by propagation is approximatelyN1/2, whereN is the number of points in the mesh.
If an algorithm modifies the positions of the refined-triangle points, the data-structure nodes that represent those triangles also have to be changed. A process that operates strict local changes (a nested mesh) is
desir-able. In [26] and [11], the authors described algorithms that perform the circumcircle test of DT(P) without lo-cally destroying the current triangulation.
In [36], for constrained edges, in both the circum-center and the off-circum-center algorithm if a prospective pointP to be inserted is inside the diameter circle of any constrained edgeE, the midpoint ofEis inserted instead ofP. This implies that a strict Delaunay Trian-gulation is maintained. As a result, no angle lesser than π/2appears in the triangulation.
5 Concluding remarks
Plaza and collaborators [34] provided several open problems related to their 7-triangle partition ap-proaches. There is a lot of work related to 3D (for ex-ample, see [10]). In addition, the 3D review shall be provided.
The purpose of this article is to survey the ap-proaches and not to evaluate them. Probably other schemes exist. However, such schemes may be either variations of the ones cited in this article or are not known to the author. However, the author hopes that this review and the references cited serve to consoli-date the ideas, principles and schemes that constitute the state-of-art in this subject. Moreover, the author hopes that the list of references and descriptions to the large body of work on this issue can provide a useful starting point for one faced with the task of adaptively constructing a Delaunay Triangulation.
6 Acknowledgements
This work was supported by FAPEMIG under the project CEX-APQ-01198-10, year 2010.
References
[1] Babuzka, I. and Aziz, A. K. On the angle condi-tion in the finite element method. SIAM Journal on Numerical Analysis, 13:214–226, 1976.
[2] Baker, T. J. Triangulations, mesh generation and point placement strategies. In Caughey, D., editor, Computing the future. John Wiley, pages 61–75, 1995.
[3] Ballard, D. H. and Brown, C. M.Computer Vision. Prentice Hall, Englewood Cliffs, NJ, 1982.
[4] Barth, T. J. Aspects of unstructured grids and finite-volume solvers for the Euler and Navier-Stokes Equations. In Von Karman Institute for Fluid Dynamics Lecture Series, NASA Ames Re-search Center, 1994-05, February 1995.
S. L. G. de Oliveira A survey of point insertion techniques in bidimensional Delaunay Triangulations 6 [5] Bern, M., Eppstein, D., and Gilbert, J. R. Provably
good mesh generation. Journal of Computer and System Sciences, 48(3):384–409, June 1994.
[6] Borouchaki, H. and George, P. L. Aspects of 2-d Delaunay mesh generation. International Journal for Numerical Methods in Engineering, 40:1957– 1975, 1997.
[7] Chew, L. P. Guaranteed-quality triangular meshes. Technical Report 983, Department of Computer Science, Cornell University, 1989.
[8] Chew, L. P. Constrained Delaunay triangulation. Algorithmica, 4:97–108, 1994.
[9] Clarkson, K. L. and Shor, P. W. Applications of random sampling in computational geometry ii. Discrete & Computational Geometry, 4(1):387– 421, 1989.
[10] Danovaro, E., De Floriani, L., Magillo, P., Puppo, E., and Sobrero, D. Computer Graphics in Italy -Level-of-detail for data analysis and exploration: A historical overview and some new perspectives. Computers&Graphics, 30:334–344, 2006.
[11] De Floriani, L. Surface representation based on triangular grids. The Visual Computer, pages 27– 48, 1987.
[12] De Floriani, L., Bussi, S., and Magillo, P. Triangle-based surface models.Chapter 9 in Intel-ligent Systems and Robotics, Breach Science Pub-lishers, pages 340–373, 2000.
[13] De Floriani, L. and Puppo, E. A hierarchical triangle-based model for terrain description. In et al., A. U. F., editor, Theories and Methods of Spatio-Temporal Reasoning in Geographic Space, Berlin, Springer-Verlag, pages 236–251, 1992.
[14] De Floriani, L. and Puppo, E. Extrating contour lines from a hierarchical surfase model.Computer Graphics Forum (Proceedings Eurographics 93), 12(3):249–260, 1993.
[15] Delaunay, B. Sur la sphère vide.Izvestia Akademii Nauk SSSR, Otdelenie Matematicheskikh i Es-testvennykh Nauk, 7:793–800, 1934.
[16] Dwyer, R. A. A faster divide-and-conquer algo-rithm for constructing delaunay triangulations. Al-gorithmica, 2(2):137–151, 1987.
[17] Edelsbrunner, H. Triangulations and meshes in computational geometry. Acta Numerica, 9:133– 213, 2000.
[18] Edelsbrunner, H. Geometry and Topology for Mesh Generation. In: Cambridge monographs on applied and computational mathematics. Cam-bridge University Press, New York, 2001.
[19] Edelsbrunner, H. and Guoy, D. Sink insertion for mesh improvement. In Proceedings of the 17th ACM Symposium on Computational Geom-etry, pages 115–123, 2001.
[20] Erten, H. and Üngör, A. Computing acute and non-obtuse triangulations. In Canadian Confer-ence on Computational Geometry (CCCG), pages 205–208, 2007.
[21] Erten, H. and Üngör, A. Triangulations with lo-cally optimal Steiner points. In Belyaev, A. and Garland, M., editors,Eurographics Symposium on Geometry Processing, pages 143–152, 2007.
[22] Erten, H. and Üngör, A. Quality triangulations with locally optimal steiner points.SIAM Journal of Scientfic Computing, 31(3):2103–2130, 2009.
[23] Fortune, S. A sweepline algorithm for voronoi di-agrams.Algorithmica, 2(2):153–174, 1987.
[24] Fowler, R. and Little, J. Automatic extraction of irregular network digital terrain models. ACM Computer Graphics (SIGGRAPH ’79 Proceed-ings), 13(3):199–207, 1979.
[25] George, P. L. and Borouchaki, H.Delaunay trian-gulation and meshing. Hermes, 1998.
[26] Guibas, L. J. and Stolfi, J. Primitives for the ma-nipulation of general subdivisions and the compu-tation of Voronoi Diagrams. ACM Transactions on Graphics, 4(2):74–123, April 1985.
[27] Har-Peled, S. and Üngör, A. A time-optimal de-launay refinement algorithm in two dimensions. In Proceedings of the 21st ACM Symposium on Computational Geometry, Pisa, Italy, pages 228– 236, 2005.
[28] Heckbert, P. S. and Garland, M. Survey of polyg-onal surface simplification algorithms. Technical report, Carnegie Mellon University - Department of Computer Science, 1 May 1997.
[29] Hitschfeld, N. and Rivara, M. C. Automatic con-struction of non-obtuse boundary and/or interface Delaunay triangulations for control volume meth-ods.International Journal for Numerical Methods in Engineering, 55:803–816, 2002.
S. L. G. de Oliveira A survey of point insertion techniques in bidimensional Delaunay Triangulations 7 [30] Hitschfeld, N., Villablanca, L., Krause, J., and
Rivara, M. C. Improving the quality of meshes for the simulation of semiconductor devices using LEPP-based algorithms.International Journal for Numerical Methods in Engineering, 58:333–347, 2003.
[31] Lee, D.-T. and Schachter, B. J. Two algorithms for constructing the delaunay triangulation. Interna-tional Journal of Computer and Information Sci-ence, 9(3):219–242, 1980.
[32] Miller, G. L., Pav, S. E., and Walkington, N. J. When and why ruppert’s algorithm works. In Twelfth International Meshing Roundtable, pages 91–102, September 2003.
[33] Mücke, E. P., Saias, I., and Zhu, B. Fast random-ized point location without preprocessing in two-and three-dimensional delaunay triangulations. In Proceedings of the Twelfth Annual Symposium on Computational Geometry, May 1996.
[34] Plaza, A., Márquez, A., Moreno-González, A., and Suárez, J. P. Local refinement based on the 7-triangle longest-edge partition. Mathematics and Computers in Simulation, 79:2444–2457, 2009.
[35] Rivara, M. C. New longest-edge algorithms for the refinement and/or improvement of unstruc-tured triangulations.International Journal for Nu-merical Methods in Engineering, 40:3313–3324, 1997.
[36] Rivara, M. C. and Calderon, C. LEPP ter-minal centroid method for quality triangulation. Computer-Aided Design, 42:58–66, 2010.
[37] Rivara, M. C., Hitschfeld, N., and Simpson, B. Terminedges Delaunay (small-angle based) al-gorithm for the quality triangulation problem. Computer-Aided Design, 33:263–277, 2001.
[38] Rivara, M. C. and Inostroza, P. Using longest-side bisection techniques for the automatic refinement of Delaunay triangulations. International Journal for Numerical Methods in Engineering, 40:581– 597, 1997.
[39] Rivara, M. C. and Venere, M. Cost analysis of the longest-side (triangle biection) refinement algo-rithms for triangulations. Engineering with Com-puters, 12:224–234, 1996.
[40] Ruppert, J. A new and simple algorithm for qual-ity 2-dimensional mesh generation. In Proceed-ings of the Fourth ACM-SIAM Symposium on Dis-crete Algorithms, pages 83–92, 1993.
[41] Ruppert, J. A Delaunay Refinement Algorithm for Quality 2-Dimensional Mesh Generation.Journal of Algorithms, 18(3):548–585, May 1995.
[42] Scarlatos, L. and Pavlidis, T. Hierarchi-cal triangulation using cartographic coherence. CVGIP: Graphical Models and Image Processing, 54(2):147–161, March 1992.
[43] Shamos, M. I.Computational geometry. PhD the-sis, Yale University, New Haven, Conn., 1977.
[44] Shewchuk, J. R. Triangle: Engineering a 2D qual-ity mesh generator and Delaunay triangulator. In First Workshop on Applied Computational Geom-etry. ACM, pages 124–133, 1996.
[45] Shewchuk, J. R. Lecture notes on Delaunay mesh generation, 1999.
[46] Shewchuk, J. R. Delaunay refinement algorithms for triangular mesh generation. Computational Geometry, 22:21–74, 2002.
[47] Shewchuk, J. R. Ruppert’s delaunay refinement algorithm. website, July 2005.
[48] Shewchuk, J. R. Triangle: A two-dimensional quality mesh generator and delaunay triangulator. website, July 2008.
[49] Simpson, B., Hitschfeld, N., and Rivara, M. C. Approximate shape quality mesh generation. En-gineering with Computers, 17:287–298, 2001.
[50] Sleator, D. D. and Tarjan, R. E. Self-adjusting bi-nary search trees.Journal of the ACM, 32(3):652– 686, July 1985.
[51] Üngör, A. Off-centers: A new type of
Steiner points for computing size-optimal quality-guaranteed Delaunay triangulations. In Proceed-ings of the Latin American Symposium on The-oretical Informatics, Buenos Aires, Argentina, pages 152–161, April 2004.
[52] Voronoi, G. Nouvelles applications des paramétres continus à la théorie des formes quadratiques. Journal fur die Reine und Ange-wandte Mathematik, 133:97–178, 1907.
Operational Profiles for Statistical Testing of Distribution
Management System
ILIJABASICEVIC1
ILIJAKUPRESANIN2
MIROSLAVPOPOVIC1
1University of Novi Sad
Faculty of Technical Sciences 21000 Novi Sad- Serbia
2JP SRBIJAGAS
Narodnog Fronta 12 21000 Novi Sad - Serbia
1[email protected],[email protected] 2[email protected]
Abstract.Each generation of software systems is becoming more complex. Also, software is becoming more important because today critical infrastructure systems depend on software. This paper presents the method applied in testing of a complex software system. For complex systems, it is very important to measure their reliability. Statistical testing based on operational profiles is a de facto industrial standard for this purpose. As a case study, we used Windows-based distribution management system that is used in electric power distribution utilities. A library that contains the analytical functions subsystem was tested. The paper gives an overview of the system and module being tested, and of the statistical method we applied. The main contribution of this paper is development of operational profiles for a real-world complex system. Two of the operational profiles we have developed for testing of the system are presented in detail. Another contribution is a new approach which supports generation of test cases on-the-fly: during execution of implementation under test on a test bed. This is possible by joining together the test case generator and the test bed.
Keywords:power distribution management system, statistical testing, operation profiles, software test-ing, software reliability.
(Received December 8th, 2010 / Accepted June 16th, 2011)
1 Introduction
Statistical testing is a technique that originates from quality assurance in automatic production of mechan-ical and electrmechan-ical devices. Given the importance that complex software systems have in everyday life, some-times in critical applications, it is no surprise that this technique has found its place in software engineering, too.
Along the time scale, software of today is getting more complex. The statistical testing using operational
profiles is a method for measuring reliability of com-plex software systems. An example of critical infras-tructure system that depends on software is Distribution Management System (DMS) in electrical power distri-bution network, the case study that is used in this paper. The complexity of this class of software systems stems from the complexity of mathematical models of distri-bution networks, which are the basis for the software model. As an example of complexity, the input space for DMS in the case of the State of Texas measures 13
million of variables [8].
This paper presents operational profiles we have de-veloped for DMS system. In our approach, the test case generator and test bed are joined together. This way, system supports generation of test cases during execu-tion of implementaexecu-tion under test on the test bed.
The DMS Software is a software package for per-forming technical tasks in electric power distribution utilities. This software tool enables utility’s staff to de-sign and manage the network’s power and automation equipment in order to maximize the quality and quan-tity of the electrical energy supplied to the consumers.
The DMS software is modularly organized pack-age with three-tier software architecture. It is based on standard software solutions that should allow for sim-ple integration with other standard software and hard-ware equipment found in the environment of electricity distribution (SCADA Systems, equipment for medium voltage (MV) automation, etc.).
The general DMS software architecture is briefly described as follows. The first tier is a relational data base. The middle tier integrates static technical and his-torical data with dynamic data (available for example from third party SCADA systems). In the third tier, there are user clients - Microsoft Windows applications. In the actual software architecture, some of third tier clients represent a shell for the DMS analytical func-tions system.
The most important applications of the third tier are [2]:
• Front-end application for data base editing. Used for editing of parameters of network elements, of their connectivity and finally their graphic repre-sentation in the form of a network diagram.
• Multiple-view user interface for visualization of supply and distribution substations and MV and LV network, as well as for managing and moni-toring distribution network state. It contains inte-grated DMS analytical function system.
• SCADA system user interfaces.
2 Related Work
Whittaker and Thomason described a method for statis-tical testing based on Markov chain model of software usage in [14]. In this fundamental paper, authors dis-cuss the construction of Markov chain and show how analytical results associated with Markov chains can aid in test planning. An innovation in this method is that test sequences generated and applied to the software
are used to create the second Markov chain to encap-sulate the history of the test. The paper also presents a stopping criterion for testing process. However, the ex-ample Markov chain for a hypothetical graphical user interface (GUI) is a very simple one. In the conclusions and prospects for future work authors mention that they are investigating more abstract models. To that end, we are still missing more complex and abstract domain spe-cific models in the available literature. That is exactly the place where our paper tries to provide contribution by dealing with the construction of real-world opera-tional profiles for the complex library of power distri-bution functions. The parameters of application pro-gramming interface (API) functions of this library are complex data structures rather than simple keystrokes. In contrast to [14], the stopping criterion in our paper is simply reaching the given target reliability figure.
In their essay on application of statistical science to testing and evaluating software intensive systems [5], Poore and Trammell present a high-level overview of the statistical testing process. In the section on build-ing usage models they provide valuable rules and hints, e.g., how to expand states and arcs and how to create sub-models within a model, but they do not cover sen-sitive issue of how to generate inputs. Generating in-puts gets really complicated when they are not simple types, such as strings, etc. For example, in the case of the DMS library the input may be the part, or com-plete model of the power distribution network, which is essentially a graph whose nodes and arcs are com-plex data types. In our paper, we provide some guid-ance and experience how to generate such inputs. Au-thors of [5] also present analytical method of assign-ing probabilities to state transitions within usage model. Alternatively, in our paper, we practice direct assign-ment of probabilities based on domain specific knowl-edge of power distribution systems, because they pro-vide rather accurate representation of the reality. But, it is worth mentioning that analytic assignment has its place in practice when the probabilities are unknown.
[3], we do not measure model coverage directly. We use an alternative approach by selecting the test case length based on the domain-specific knowledge and then use significance quality indicators (SLi)s as the measure of generated test cases quality. The stopping criterion in this paper is that the mean significance confidence level is above 20% and that the target reliability figure is reached. Another difference between [3] and this pa-per is that we use the reliability estimation method pro-posed by Woit [15], which is based on the purely statis-tical hypothesis approach and therefore does not require construction of equivalence classes.
In another paper [4], closely related to [3], Guen and Thelin report on their practical experiences with sta-tistical usage testing by means of their tool MaTeLo. The company’s Alitec experience shows that the model construction takes between 0.5 and 4.5 days per KLOC (1000 lines of code). They have found that even for small software products, the size of the model would be very large, and have commented that it is probably the major drawback of that sort of modelling. In addition, they reported that time to finish testing was between 1.5 and 8.3 days/KLOC for 5 example projects, but they do not provide data about the target reliability and cover-age. In our own experience, the most consuming part of modelling was gathering domain-specific knowledge of the behaviour of the power distribution network, e.g. knowledge about how switches and tap changers are operated. That activity lasted several months, and it is still work in progress. Once the basic knowledge was collected, we were able to construct various op-erational profiles within a working week each, so that time for a model per MLOC (million lines of code) be-came extremely low, e.g. 5/2x106 = 2.5 days/MLOC. Typical testing campaign in our experience lasts for 2-3 weeks, yielding time to finish test in the range of 7-11 days/MLOC.
MaTeLo [4] contains a usage model editor. Based on entered usage model, the back end test case gener-ator generates automatically TTCN-3 test cases. Simi-larly, in [10], [9], [7], there is usage model editor based on GME. Depending on entered usage model, textual test cases are generated and executed in a JUnit based test bed. In both approaches, there are three separated steps:
1. Input of the model
2. Generation of test case
3. Execution of test case in test bed
Also in the prototype tool presented in [12], the test case generator and the test oracle are separated. In their
approach, test case generator is Java framework used for testing Java classes. In this paper, we present an approach where steps 2 and 3 are joined. The first step is realized by writing C++ code.
The flat and hierarchical models supported by cur-rent statistical testing environments, such as MaTeLo [3], tend to become enormous very quickly as systems grow in complexity. This fact is recognized as major drawback in [4]. In his study [13], Weber proposes a solution to this issue. The proposed solution is to use parallel models because their usage provides exponen-tial reduction in model size. Essenexponen-tially, Weber creates an operational profile of a system by extending its re-quirement specification model. The approach is demon-strated with the example of Flight Guidance System (FGS) provided by Rockwell Collins. Although [13] presents an interesting approach, it requires a specifica-tion model in language such as RMSL-e (based on Re-quirements State Machine Language, RSML) as its in-put which may not be readily available in case of legacy systems and development of such models would be very costly. For example, the library we are dealing with in our paper contains millions of lines of FORTRAN code. Additionally, this legacy code is sequential by its very nature. Therefore, reducing the size of operational pro-file based on introduced parallelism is not possible.
Most of research on operational profiles is focused on operations and little is said about operation param-eters. Shukla et al. [12] offer a solution to this issue by introducing support for defining constraints on indi-vidual parameters, relationships between different input parameters (of the same or different operation calls), and between output parameters of calls and input pa-rameters of subsequent calls. Unfortunately, they do not report in details what kinds of constraints and rela-tionships are supported and how. Although their work seems promising, they demonstrated it only on a three rather small examples, namely Stack, Symbol Table and Forest (of abstract syntax trees) with 35, 128, and 234 lines of code, respectively. In our paper, we deal with the complex legacy library of power distribution func-tions. We provide parameter constraints and relation-ships by translating them into C++ code that directly manipulates power distribution network model used by the library.
3 Implementation under Test
This DMS analytical function system is a component that contains the domain specific knowledge of DMS software. It implements comprehensive set of sophis-ticated algorithms that enable efficient design, optimal operation and decision making referring to the whole
equipment installed in the distribution network [6]. It realizes all technical tasks in distribution utilities in the following four modes of operation:
• Operation Management,
• Operation Planning,
• Development Planning,
• Simulation, Analysis and Training.
All analytical functions are developed on the basis of algorithms specially aimed for distribution networks, which enable performing both analysis and optimiza-tion of operaoptimiza-tion and development of very large radial and weakly meshed distribution networks.
The DMS analytical function system is imple-mented as a dynamic link library, named dmsapp.dll. This paper describes the method we have applied in the black-box testing of the library. The library is written in the FORTRAN programming language (version 10, as of today it is being ported to version 11). It is de-veloped by development team, and tested by quality as-surance team. It is an important module of the DMS system and realizes calculation of load flow, fault calcu-lation, thermal monitoring and several other functions. Application Programming Interface (API) of the library contains functions for creation and destruction of the network model and invocation of specific calculations. There is a C language API for use in C applications. API functions will not be described here in detail. All calculations that the library and its API provide to de-velopers are based on the software model of distribution network and this model is implemented in the library.
The software model of the distribution network in DMS system is a complex data structure. As has al-ready been stated, it is the graph whose nodes and arcs are complex data types. Elements in the model are linked by identifications: for each element, in the data structure that represents it, there are fields for identifi-cations of adjacent elements. In the general case, each network element is presented with three objects, con-taining different types of data. Those three objects com-prise an abstraction hierarchy. The catalogue object contains catalogue data. Those are technical and ad-ministrative data that describe the class of objects. The set of similar objects after a period of use are assigned type data that is the result of statistical processing of measured data about the set. The basic data describe the specific element in case, and among others, contain the dynamic values. Thus, the catalogue object is the highest one in abstraction hierarchy and the basic data object is the lowest.
4 Testing Procedure
Testing of the library is realized using test environment we have developed. It is based on CPPUnit [1] frame-work for automated testing. In the setUp() method of CPPUnit test case, the test environment is prepared for the test. The tested library is initialized and the net-work model is loaded into the library. In the main test case method, which is registered to the CPPUnit frame-work, the finite state machine of Markov chain is ex-ecuted. This is done by using OP State Machine class which is configured with particular states and their tran-sitions. Each state transition implies invocation of func-tions that belong to the application programming inter-face of the tested library. In the tearDown() method, the test environment is closed down by freeing the used memory and by closing the handles of used system ob-jects. It is possible that CPPUnit has defects, but during the testing we did not encounter them. If those defects manifested themselves, it would not make a problem for the testing process, because in that case, the asserts would fail.
The applied methodology is based on statistical test-ing methods described in [15], which are often used to-day, for example in Cleanroom Engineering [11]. This method implies that the functional correctness of DMS System is tested using operational profiles. The method is sufficient for testing provided that the operational profile correctly models the statistics of the usage of the tested product. An operational profile is modelled as a finite state machine. It can be represented as a graph, consisting of a certain number of states which are nodes of the graph. We can describe the state as a general condition of the software module. The edges are state transitions which are triggered by events that occur with certain probabilities. An event is either an external invocation of a member function of the tested module or a change of value of an externally accessible variable.
We have developed realistic, non trivial operational profiles for the DMS system. The API that is used for program invocation of DLL functions is rather complex because data structures that are used for data passing - as input and output arguments of function calls - are large and complex. This implies a large number of test cases required for testing of the analytical functions li-brary.
is the system reliability. An important characteristic of our approach is that tests are generated and executed dy-namically. Test cases are generated (based on specified operational profile) during execution of the system in the test bed. This feature is realized by joining together the test case generator and the test bed.
In the traditional statistical testing, the first step is to generate (based on the operational profile) test cases and to save generated test case in a file. In the next step, the file is read and the test case is executed in the test bed. On the other hand, in our approach, the two steps are joined. First, the test bed generates the next test step by selecting one of the state transitions available in the currently active state - according to probabilities of state transitions and then, generated test step is ex-ecuted. This is repeated until the last test step in the test case is executed. Operational reliability of the soft-ware module is the probability that module execution, selected at random according to given operational pro-file, will not fail.
Reliability = 1 - (failure rate).
Module execution is considered to be the sequence of events issued to the module beginning with module ini-tialization (or re-iniini-tialization) and ending with module termination (or re-initialization). Operational profile is a description of the distribution of input events that is expected to occur in module operation. System reliabil-ity is determined by formula:
M =rN where:
N - number of successfully executed tests, r - reliability,
M - confidence
For example, for the system’s reliability (with the con-fidence of 0.7%) to be 99%, 500 test cases ought to be executed successfully, for the reliability of 99.9%, 5000 test cases ought to be executed successfully, for the re-liability of 99.99%, 50000 test cases ought to be exe-cuted successfully, etc. Confidence is the probability that module has reliability less than r and still passes N tests. Significance level represents the quality of test sample of operation profile. Significance level is calcu-lated using next formulas:
eij=Pij∗Pfij,
Di=P(fij−eij)∗ fije−ijeij,
where:
Pij- probability of event j in state i, fij- real occurrence of event j in state i, eij- expected occurrence of event j in state i, Di- discrepancy of state i.
For significance level calculation, it is necessary to form a table in which rows represent states and columns
rep-resent events. Elements of the table are real and ex-pected occurrence of events (eij and Pij). Significance level is determined inχ-table for every state based on calculated discrepancy. The mean value of the signifi-cance level is calculated next. It is given as the arith-metical mean value of significance levels of all states. If the mean value of significance level is greater than 20%, the given sample of operation profile is valid.
The testing method also includes a method for esti-mating software reliability based on statistical hypothe-sis testing. The result is reliability estimation accompa-nied by the measure of confidence. The overall proce-dure comprises of the following steps:
1. Specification of an operational profile
2. Generation of random test cases based on the op-erational profile
3. Execution of test cases
4. Verification of test cases
5. Reliability estimation based on the model and the results of the verification of test cases
Testing process is modelled using Binomial distri-bution because it satisfies the following criteria:
• Testing is performed with replacement
• Tests are selected at random and they are mutually independent
• Test has only two possible outcomes (success, fail-ure)
• The probability of failure does not change during the testing
In this testing, three operation profiles have been identified and implemented:
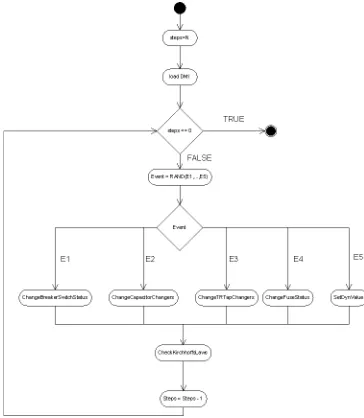
1. Operational profile for changing dynamic data of distribution scheme. This profile randomly chooses a number of elements of each type and randomly changes dynamic values of selected ele-ments. As each switchgear element contains pur-pose field, the elements are classified according to the value of that field. The set contains 5% of all switchgear elements with the purpose field indicating supply line or reactor, 10% of those with purpose indicating three types of high voltage transformers or a feeder, etc. After each change, load flow is calculated once again. The validity of Kirchhoff laws is checked before and after se-ries of changes of dynamic values of different ele-ments.
2. Operational profile for scheme mutation. This pro-file is different from propro-file 1 because instead of dynamic values, the static structure of the network is changed. There are two basic types of muta-tion: scheme extension and scheme reduction. Ex-tension is achieved by adding elements or groups of elements, and reduction by deleting elements or groups of elements from the scheme.
3. "Realistic" operational profiles. We have devel-oped six operational profiles based on operations that network operators routinely undertake in their everyday work. Those are:
• Change of the position of tap changers,
• Activation of capacitor batteries and its impact on currents and voltages,
• Load growth simulation and monitoring of changes of currents in the transformer bay,
• Detection location and insulation of faults,
• Feeder looping,
• Load sharing between the two feeders (Feeder to feeder load shedding).
We describe here a typical test case for operational profile 1. First, the tested library is initialized and an ex-isting network scheme is loaded. This is a scheme that has already been used with the DMS system and thus, it is assumed to be correct. This starting statement is necessary because in further steps, the network scheme would be modified.
The test procedure modifies the scheme and checks if the library would successfully process or recognize as invalid the subsequent states of the scheme. The scheme is stored in a set of binary files and placed in the com-mon folder. It is loaded from binary files to the library by first placing it into an array of binary type data struc-tures. If this step goes well, the scheme is loaded from the array into dmsapp.dll.
Using one of the described profiles, the loaded net-work scheme is modified (by modifying dynamic val-ues of network elements), see 1. By invoking the load flow calculation or by checking the validity of Kirch-hoff laws, test case verifies if the DMS system can pro-cess the modified network. The expected behaviour is that the library should either correctly perform the re-quested calculations or return an error code in the case of an invalid state of the input network. Any other be-haviour (e.g., unsuccessful calculation, throwing an ex-ception during calculation) is considered to be test fail-ure.
For the operational profile 2 (scheme mutation), the scheme is modified (by modifying the network struc-ture) before it is loaded into dmsapp.dll.
From the programmer’s point of view, test execu-tion is achieved by instantiating an object of class OP-StateMachine that models the finite state machine of module execution. First, objects that represent spe-cific states of operation profile are instantiated and their state transitions (including probabilities) are config-ured. Thus a vector of state objects is formed. This vector is a parameter of the OPStateMachine construc-tor. During the construction of the object, the state ma-chine is executed. By applying probabilities that are given in the state machine, the test case is generated and executed dynamically. Next the significance level of the test is calculated. This calculation is based on two ma-trices: of expected and achieved occurrence of events. Based on the calculated value, it is decided whether generated test case is a representative sample.
5 Operation Profile for Changing Dynamic Data
The operation profile for changing dynamic data has the following three states: S0 - Initial state,S1- Network loaded, ready for check procedures, S2 - Check pro-cedure done, network ready for the next modification. and seven state transitions which are represented with events that trigger them and state transition probabili-ties we used in testing:
1. LoadDMIAndSetLibOptions (100%),
2. CheckKirchhoffsLaws (100%),
3. ChangeCapacitorChangers (15%),
4. ChangeFuseStatus (20%),
5. ChangeSwgStatus (35%),
6. ChangeTRTapChangers (15%),
7. SetDynValueGenerator (15%).
In the following text, each of the events is explained. The LoadDMIAndSetLibOptions event triggers scheme loading. The following options are set for dmsapp.dll: Load Flow, Estimation, Performance and Switching. All Switching options are activated except grounded and energized and different levels.
the capacity of each capacitor in the list is changed to a random value in acceptable interval. This interval is read in the catalogue object of the capacitor.
Figure 1:The UML activity diagram for the profile 1 (changing dy-namic data)
The ChangeFuseStatus event starts the procedure in which the list of all fuses in the network is com-piled. 10% of elements in the list are chosen at ran-dom and turned off, the rest are turned on. Before each turn on/off operation, the viability of the operation is checked, and upon each successful state change, it is checked whether the load flow calculation of the new network topology is possible. If not, the test is finished at that point.
The ChangeSwgStatus event starts the procedure in which the list of all switchgear elements in the network is compiled. Next, the elements in the list are classified by the value in their purpose field. For each purpose type, a set of randomly chosen elements A is formed. Set B, is subset of A and elements of B are chosen at random from A. The status of elements in B is set to open, and the status of all elements in A that are not in B is set to close.
The ChangeTRTapChangers event starts the proce-dure in which the list of all tap changers for high voltage transformers in the network is compiled. Next, values of elements in the list are randomly set in ranges that are read from their catalogue objects. This procedure is repeated for middle voltage transformers, too.
The SetDynValueGenerator event starts the proce-dure in which the list of all generators in the network is compiled. The regulation type of the generator can be:
1. Regulation of active power,
2. Regulation of active power and voltage,
3. Regulation of active and reactive power,
4. Regulation of active and reactive power and volt-age.
Based on the regulation type, the values of elements in the list are changed:
1. Active power in the range (Pmin,Snom), wherePmin is the minimal power of the generator andSnomis the nominal power of the generator,
2. Reactive power in the range (Qmin,Qmax), where Qmin is the minimal reactive power and Qmax is the maximal reactive power
3. Voltage in the range (0.5*Vnom, 1.5*Vnom), where Vnomis the nominal voltage.
Pmin, Snom,Qmin,Qmax, andVnom values are retrieved from the catalogue object for the generator. The probabilities of events are determined in the follow-ing manner. LoadDMIAndSetLibOptions and Check-KirchhoffsLaws have 100% probabilities to occur. The events ChangeTRTapChangers, ChangeCapacitor-Changers and SetDynValueGenerator are assumed to be less probable to cause errors, so they have smaller prob-abilities. The events ChangeSwgStatus and Change-FuseStatus are changing the topology of the network. Therefore, it is assumed that they can cause more errors and thus have greater probabilities.
Figure 2) presents the operational profile for chang-ing dynamic data. There are three states. Upon loadchang-ing the scheme, the system transitions fromS0 toS1, and afterwards, upon checking Kirchhoff laws, it transitions fromS1toS2. It returns fromS2toS1by changing dy-namic values of certain network elements.
6 Feeder-to-Feeder Load Shedding
This operational profile is based on one of the scenarios of the realistic use of the DMS system. In the following paragraph the reader can find explanation of the testing procedure in this operational profile. The first step is to compile a list of all candidates. The candidate has to meet the following conditions:
• Switchgear element SWG is in off state
• SWG is contained in feeder bay TSM (transformer station medium voltage) or joint
Figure 2:The operational profile for changing dynamic data
• SWG should be connected to two different feed-ers, belonging to different TSH (transformer sta-tion high voltage) elements
In the second step, an element from the list is selected at random (SW G1) and the testing is started. Measured values for both feeders are recorded. The following variables are set: the feeder with greater load isFmax; TSH that containsFmax is T SHmax. Next, the direct path from T SHmax to SW G1 over Fmax is searched. A list of elements containing sections and TSMs in the direct path from TSHmax to the selected TSM is com-piled. A list of all SWG elements that belong both to that path and to the feeder is compiled. If there are no SWG elements in the path that meet the requirements, the test is considered to be successful, and the execution returns to the beginning of step 2.
Next,SW G1is switched off. If it is not possible to execute load flow calculation,SW G1is switched to its former state, the test is considered to be successful, and the execution returns to the step 2.
From the list of SWG elements that are in the path and are switched on, one is selected (SW G2). SW G2 is switched off. If it is not possible to execute load flow calculation, SW G1 andSW G2 are switched back to their previous states, the test is considered to be suc-cessful, and the execution returns to the step 2.
Check of the validity of Kirchhoffs laws for the new state of the network is conducted. The new measured values for selected feeders are compared with old, and if the following conditions are met, the test is considered to be successful:
F eeder1Load < F eeder2Load: F eeder1Load < F eeder1LoadN ew F eeder2LoadN ew < F eeder2Load F eeder1Load > F eeder2Load: F eeder1Load > F eeder1LoadN ew
F eeder2LoadN ew > F eeder2Load
Afterwards,SW G1 andSW G2are switched back
to their previous states and the check of the validity of Kirchhoffs laws for the new state of the network is con-ducted. The execution returns to the beginning of the step 2.
The test is performed in the following manner. First, from the list of SW G1, one by one, each of the
ele-ments in the list is selected. Next, the path from TSH to TSM containingSW G1is searched (over the feeder with greater load). Afterwards, all SWG elements in the path are added to theSW G2list and a SWG is selected at random from theSW G2list. In the last step, feeder to feeder load shedding is performed for the selected combination.
7 Conclusion
DMS is a large and complex software package for per-forming technical tasks in electric power distribution utilities. As already stated, DMS software systems are getting more complex every day. One important soft-ware metric is its reliability, and therefore, statistical testing by using operational profiles as a de facto stan-dard for measuring software reliability is of special in-terest in development of DMS systems.
Two important contributions of this paper are the set of developed operational profiles for statistical testing of DMS systems and on-the-fly testing approach, which is achieved by joining together the test case generator and the test bed. In earlier test beds that are described in the available literature, the two were separated.
The operational profiles have been developed for testing of one module of distribution management sys-tem software - that is the module that contains analyt-ical functions subsystem. Several operational profiles have been developed, two of which are presented here in detail (operational profile for changing of dynamic data, and feeder-to-feeder load shedding).
Besides providing us with a measure of reliability, the testing with the use of operational profiles has al-lowed us to identify certain software faults earlier in the development process.
8 Acknowledgement
This work was partially supported by the Ministry of Education and Science of the Republic of Serbia under the project No. 44009 and 32031, year 2011.
valu-able discussions and feedback during realization of this paper.
References
[1] Cppunit - c++ port of junit. source-forge.net/projects/cppunit.
[2] Dms software, windows for distribution networks. DMS Group, 2006.
[3] Guen, H. L., Marie, R., and Thelin, T. Reliabil-ity estimation for statistical usage testing using markov chains. In International Symposium on Software Reliability Engineering (ISSRE), 2004.
[4] Guen, H. L. and Thelin, T. Practical experiences with statistical usage testing. InAnnual Interna-tional Workshop on Software Technology and En-gineering Practice (STEP), 2004.
[5] Poore, J. H. and Trammell, C. J.Statistics, Testing, and Defense Acquisition, chapter Application of Statistical Science to Testing and Evaluating Soft-ware Intensive Systems. National Academy Press, 1998.
[6] Popovic, D., Bekut, D., and Treskanica, V. Speci-jalizovani DMS algoritmi. DMS Group, 2004.
[7] Popovic, M., Basicevic, I., Velikic, I., and Tatic, J. Practical experiences with statistical usage test-ing. In Annual Conference on Engineering of Computer Based Systems (ECBS), pages 377–386, 2006.
[8] Popovic, M., Basicevic, I., and Vrtunski, V. Prac-tical experiences with statisPrac-tical usage testing. In Annual Conference on Engineering of Computer Based Systems (ECBS), 2009.
[9] Popovic, M. and Kovacevic, J. A statistical ap-proach to model-based robustness testing. In Annual Conference on Engineering of Computer Based Systems (ECBS), pages 485–494, 2007.
[10] Popovic, M. and Velikic, I. A generic model-based test case generator. In Annual Confer-ence on Engineering of Computer Based Systems (ECBS), pages 221–228, 2005.
[11] Prowell, S. J., Trammell, C. J., Linger, R. C., and Poore, J. H. Cleanroom Software Engineering: Technology and Process. Addison-Wesley Profes-sional, 1999.
[12] Shukla, R., Strooper, P. A., and Carrington, D. A. Tool support for statistical testing of software components. InAsia-Pacific Software Engineer-ing Conference (APSEC), 2005.
[13] Weber, R. J. Statistical software testing with paral-lel modeling: A case study. InInternational Sym-posium on Software Reliability Engineering (IS-SRE), 2004.
[14] Whittaker, J. A. and Thomason, M. G. A markov chain for statistical software testing. IEEE Trans-actions on Software Engineering, 20(10), October 1994.
[15] Woit, D. M. Operational Profile Specification, Test Case Generator, and Reliability Estimation for Modules. PhD thesis, Queen’s University Kingston, Ontario, Canada, 1994.
Applying the Heterogeneity Level Metric in a Distributed Platform
PAULOS. L. SOUZA FABIOHISTOSHI MARCOSJ. SANTANA REGINAH. C. SANTANA
SARITAM. BRUSCHI KALINKAR. L. J. C. BRANCO
USP - University of São Paulo
ICMC - Institute of Mathematics and Computer Sciences SSC - Computer Systems Department
P.O. Box: 668 - 13560-970 - São Carlos (SP) - Brazil {pssouza, hitoshi, mjs, rcs, sarita, kalinka}@icmc.usp.br
Abstract.Heterogeneity Level (HL) metric has been developed by our research-group to help scheduling algorithms to adapt themselves to the existent heterogeneity in the platforms. This paper presents our results considering the HL’s behaviour in a real adaptive scheduling. HL metric quantifies qualitative aspects from heterogeneity in order to provide efficient performances and lower cost to the execution in both heterogeneous and homogeneous platforms. HL use is investigated under different perspectives: CPU, memory, network and considering benchmarks results. A simple but effective adaptive scheduling using HL is proposed and its results point out to performance-gains around 53% when a non-adaptive scheduling algorithm is used. Our case studies show that the HL was efficient, flexible and easily used for scheduling policies.
Keywords:heterogeneity, load balancing, cluster.
(Received February 22nd, 2011 / Accepted May 2nd, 2011)
1 Introduction
Heterogeneous distributed platforms allow exploring different and specific resources according to differ-ent demands. They extend the platform performance through both gradual improvements and reuse of the resources already available in the organization. How-ever, associating different resources with diversified de-mands implies to compute a more complex strategy for this distribution. Heterogeneity must be used carefully in order to improve the computing cost vs. benefit rela-tion.
Processes scheduling is directly affected by hetero-geneity. It is necessary to consider relevant aspects from both platform and applications demand when the re-sources present different features, architecture or
per-formance. On the other hand, when the platform is homogeneous, the scheduling may encapsulate details from devices and basic software (such as operating sys-tems and compilers), because they present a uniform behavior, performance and architecture. This allows simpler and cheaper scheduling with efficiency. Other important point is that heterogeneity can be temporal as well, due to workload dynamical variation and node-changes in the platform [3].