ISSN: 2334-2366 (Print), 2334-2374 (Online) Copyright © The Author(s). 2014. All Rights Reserved. Published by American Research Institute for Policy Development
Simulation of a Computer-based Water Distribution System for
Bauchi Metropolis
Esiefarienrhe M. B.1 and Effiong M. E2
Abstract
A survey of activities of the Bauchi state water board was carried out. Having faced with problem of water supply in Bauchi we assess the board in terms of water dissemination Some records were not reviewed indicated that scientific and technical approaches were not implemented in increasing water distribution at any time the need arises.Some visitations and a number of consultative sessions with the staff and people around the community were made. Information about the method and mode of the distribution were collected and computer implementations were proposed to substitute the various activities for balanced distribution. The water software is implemented using visual basic programming language, and the system is a mouse driven and event driven techniques that consists of different modules to accomplish the implementation.
Keyword: SystemDesign;Water distribution; Water Board; Network flow; Directed Graph
1. Introduction
A water system has two primary requirements: First, it needs to deliver adequate amounts of water to meet consumer consumption requirements plus needed fire flow requirements. Second, the water system needs to be reliable; the required amount of water needs to be available 24 hours a day, 365 days a year (Harry, 2008).
1PhD, Maths/Stat/Computer Science Dept., University of Agriculture, Makurdi, Nigeria.
Phone: +2348032311297, Email: [email protected]
This is the goal of any good water system of which Bauchi water board seek to achieve. Water distribution system can be viewed as an interconnected collection of sources, pipes, and hydraulic control elements (e.g. pumps, valves, regulators, tanks) delivering water to consumers in prescribed quantities and at desired pressures. Such systems are often described in terms of a graph, with links representing the pipes, and nodes representing connections between pipes, hydraulic control elements, consumers, and sources. Thus, the behavior of any water distribution system is governed by:
1. Physical laws that describe the flow relationships in pipes and hydraulic control elements,
2. Consumer demand, and 3. System layout.
Reliability analysis of a water distribution system is concerned with measuring its ability to meet consumers’ demands in terms of quantity and quality, under normal and emergency conditions. The required water quantities and qualities are defined in terms of the flows to be supplied within given ranges of pressures and concentrations (e.g. residual chlorine, salinity). As such, water distribution systems play a vital role in preserving and providing a desirable quality of life to the public. A Computer-Based Water distribution System (CWDS)is a computer system designed to support the water resource management function with emphasis on water distribution and management. According to Bao and Mays (2001), anyWater Management System consists of three sub-systems:
1. Monitoring Management (MM) which is used to manage water resources’ quality and monitoring its operation on a National basis in an effective and efficient manner.
2. Water Resource Management (WRM) is used to achieve the sustainable use of water and the protection of the quality of the water resource.
3. Geographical information system (GIS) is used to geographically display Water Resource information in order to assist in interpreting and determining the quality and the status of water resource.
Anywhere that pipes meet, the total amount of water coming into that junction must be equal to the amount going out, otherwise we would quickly run out of water or we would have a buildup of water. We have a water inlet, which is the source, and an outlet the sink. A flow would then be one possible way for water to get from source to sink, so that the total amount of water coming out of the outlet is consistent. Intuitively, the total flow of a network is the rate at which water comes out of the outlet.
2. Water Distribution as a Network Problem
Water distribution problem can be viewed as a network problem in graph theory. A flow network is a directed graph where each edge has a capacity and each edge receive a flow. The amount of flow on each edge cannot exceed the capacity of the edge. A flow most satisfy the amount of flow into a node equals the amount of flow out of it, except when it is a source which has more outgoing flow or sink, which has more incoming flow (Saul and Walters, 2000: Liang and Nahaji , 2003: Mays, 2001: Ostfeld and Shamir, 2002).
Suppose G (V.E) is a finite directed graph in which every edge (U.V) € E has a- non negative, real valued capacity C (U.V). We distinguish two vertices; a source S and a sink t. a network flow is a real function F: V x V R with the following three properties for all nodes u and v;
i. Capacity constraint: f (u,v) <c (u,v). The flow along an edge cannot exceed its capacity. ii. Skew symmetry: f (u,v) = -f (u,v) The net flow from u to v must be the opposite of
the net flow from u to v.
iii. Flow conservation. wf (u,v) = o unless u=s or u=t the net flow to a node is zero, except for the source, which produce flow and the sink which consume flow.
Notice that f (u,v) is the net flow from u to v if the graph represents a physical network and if there is a real flow.
If adjacent (a,b) (i.e if there exist a pipe from a to b), then C (a,b) is the capacity of the pipe from a to b and if there exist no pipe from a to b, then C (a,b) = 0. At any point in the operation of the system. A given amounts of water (possibly 0) flows through each pipe. Define a flow function, f (a, b), where a and b are nodes, as 0 if b is not adjacent to a and as the amount of water flowing through the pipe from a to b other- wise. Clearly, f (a,b)>0 for all nodes a and b further - more, f(a,b)<c(a,b) for all nodes a and b since pipe may not carry more water than its capacity.
Let V be the amount of water that flows through the system from s to t, then the amount of water leaving s through all pipes equals the amount of water entering through all pipes and both, these amount equal V i.e. No node other than s can produce water and no node other than t can absorb water. Thus the amount of water leaving any node other than s or t is equal to the amount of water entering the node.
3. Flow Problem Analysis
According to Quimpo and Shamsi(2001), a networklike water distribution system, involves the determination of a path through the network, which minimizes or maximizes function of a property of the links in a particular path selected. Consider the network with m nodes and n arcs through a single connection flows. We associate with each arc(i.j) a lower bound on flow lij = 0 and upper bound on flow Uij. It is assumed that Uij (capacities) are finite integers. There are no costs involved in the maximal amount of flow from node 1 to node m.
Let f represents the amount of flow in the network flow from node 1 to node m. Then the maximal flow problem can be stated as follows:
Maximize f
Subject to Xij - Xki = f if i = 0, if i≠ 1 or m, -f if i = m.
Xij ≤ Uij, = 1,2,3….m
Xij>0, i,j = 1,2,3…m
Now let consider the following diagrams representing flow of water in pipes of different capacities where each are represents a pipe and the weight (number) above each arc is the capacity of the pipe in gallons per minutes.
The nodes represent points at which pipes of different capacities are joined and water is transferred from one pipe to another. Two nodes S. and T are designated as a source (or producer) and sink (or user) respectively. It signifies that the amount of water originating from S must be precisely reaching T through the pipes. We note that the source may be able to produce water at a prodigious rate and the sink may be able to consume water at a proportionate rate, the pipe may not have the capacity to carry it all from the source to the sink. Thus the limiting factor of the entire system is the pipes capacity and some topological factor (Rossman, 2004).
3.1 Improving a Flow Function
Given a flow function f, there are two ways to improve upon it.
One way consists of finding path s=x1,x2……Xn=T from S to T such that the
flow along each arch in the path is strictly less than the capacity i.e. f(xk-1,xk)<C(xk
-1,xk) for all k between 2 and n. The flow can be increased from each arc in such a path
by the minimum value of C(xk-1,xk)- (xk-1,xk) for all k between 2 and n, so that when
the flow has been increased along the entire path, there is at least one arc (xk-1,xk) on
the path for which f(xk-1,xk)=C (xk-1,xk) and through which the flow may not be
increased.
This paper is motivated by the current need for increase techniques for the distribution of water necessitated by fast population growth of Nigeria especially within Bauchi Metropolis.
4. Area of Study
Bauchi State is a State in northern Nigeria. Its capital is the city of Bauchi. The state was formed in 1976 when the former North-Eastern State was broken up. According to the 2006 census, the state has a population of 4.7million. Bauchi State occupies a total land area of 49,119 km² representing about 5.3% of Nigeria’s total land mass and is located between latitudes 9° 3' and 12° 3' north and longitudes 8° 50' and 11° east. Bauchi state has 20 Local Government Areas. Bauchi Metropolis is the city of Bauchi which is part of the Bauchi Local Government. Bauchi LGA occupies an area of 3,687km2 and has population of 493,810million as at 2006 census (Wikipedia). It administrative capital is Bauchi Metropolis. The main study area is the Urban Bauchi Area that started from Wunti Dada sub-settlement in the North to Kofa Idi sub-settlement in the south west andfrom Yelwa sub-settlement in the east to Gubi settlement in the west. The Urban Bauchi Area is made up of sub-settlements that are existing in the Neighborhoods pattern. They are Bauchi city, Wunti Dada, G R A, Yelwa, Zango, Rafimagarata, RafinZurfi, Gwallameji, Bayara, Kofa Idi.
5. Materials and Methods
The methodology used in this research is the Structured System Analysis and Design (SSADM) which is an accepted Software Engineering Methodology for software. Also used is the Expert System methodology, which involved knowledge engineering process of inference and knowledge-based (Anigbogu S. O and Inyiama H. C. 2006).This method consists of studying the current system for it is difficult to design a new system without understanding the old one. Data were collected for the system design using fact-finding techniques such as reading existing documentation of the water distribution system, observation of workers at work at the Gubi Dam Water Board and pipe laying activities in Bauchi metropolis, examining procedures (current) and interviewing users of the water board and managers who deal with water distribution records.
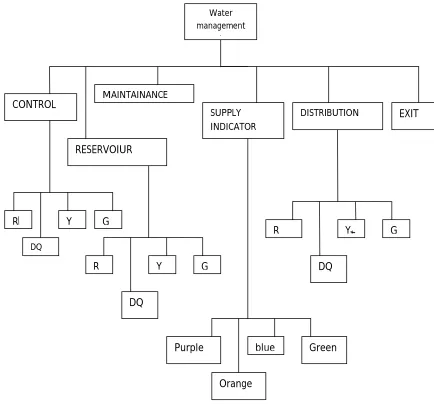
5.1 Proposed System Block Diagram
Block diagram is a diagram of a system, in which the principal parts or functions are represented by blocks connected by lines that show the relationships of the blocks. The components of Fig. 1 are explained below:
Water management: Is the main source of water in the state which refers toGubi Dam water Board.
Control panel: Is a control room where all supplies are control from reservoirs to all the areas in the Bauchi town, like Yelwa (Y), G.R.A (G), Doctors Quarters (DQ), Railway (R), etc.
Reservoirs (tanks):Is a place water is stored for distribution to areas mentioned above.
Maintenance: This is the place where maintenance works are done and it regulate the features of the output on the form (the form contains day, time, date, area, ADD, save, delete,next, previous, first,last)
Supplied Indicators:Fig. 1 represent indicators that show which area are presently being supplied with water, areas that are out of supply and Gubi Dam Reservoir where the water comes from. Colors are used as indicator. The colors simulate the manual method used by the operators. In the manual system, electric bulbs of different colors are used as indicators of supply, out of supply and water on reservoir. The new system uses color indicator which flashes and beep to indicate as follows: Purple color flash and beep shows: Areas on supply. Blue color flash and beep shows: Areas out of supply. Green color shows: Water board. Orange color show: Gubi reservoir.
Distribution unit
Fig. 1: Proposed Computer-Based Water Distribution System block diagram
6. Software Development and Deployment
The program was written in Visual Basic programming language, one of the Microsoft products. Visual Basic is of the windows programming application, unlike the older MS-DOS programming application (i.e. QBASIC, Turbo Pascal etc) which are command driven system. Visual Basic is an event driven system like all other windows application programmed.
Water management
system
EXIT
DISTRIBUTION SUPPLY
INDICATOR MAINTAINANCE
RESERVOIUR CONTROL
Y G
R DQ
R Y G
DQ
YY G
DQ G
DQ R
blue Green
This system is developed with visual basic 6.0 version and can run on any Microsoft Windows Operating System. It is a standalone application that can run without the support of any additional “dll” file (link) from any application.
The system is made of five (5) forms and two (2) reports
Forms
The forms are used to link processes together. Below are some of the forms used to design the application:
1. Welcome form (Flash form)
2. User Access form (Password verification form) 3. Main Menu form
4. Control Panel form 5. Maintenance form
The forms are attached in the appendix
Report
Reports are output module use to display the content of a database. And to present them in a printable format. Some of the reports used in this application were to display the quantity of water, time and date forroutine maintenance by the water board staff.
7. Results and Discussion
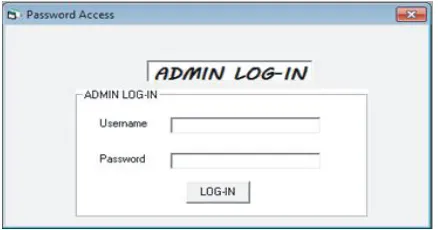
Fig. 2: The Password Dialog Box for the System
The Main Menu form shown in Fig. 3 offers options to either view the maintenance form, the control room or to exit the program. If exit program is selected, the program terminate, if the maintenance option is selected, a new form is loaded and date and time of maintenance is entered and store in the database for future referencing. But if the control panel option is selected then the system control panel which is the heart of the program is loaded.
Fig. 3: Main Menu of the system
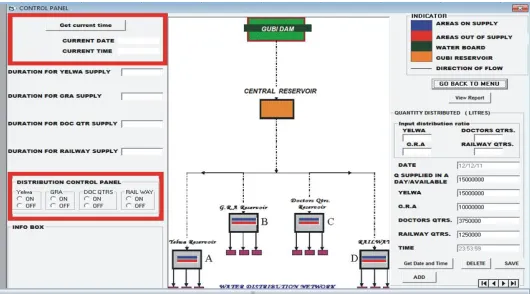
Control Panel Operation
The quantity of water shared is measured in litre and the least quantity shared at a time cannot be less than 10,000000 ltrs. This quantity of water is shared with ratio based on the population of an area (locality).
Fig. 4: The Control Panel of the CWDS
How to Operate the System
Steps:
i. Queue in ratio of distribution base on area population
ii. Enter quantity of water to be distributed
iii. click get current time button to enable the system to generate current time and then add data to database
iv. Use the time generated by the system to time-stamp the duration of supply to an area.
v. key in the date and time generated by the system for each area (location)
vi. Switch on the tank by selecting the option button for ‘ON’. The indicator showing that there is supply in that area will start blinking until the time allocated for that area elapse. Then the system automatically switches off and the blinking indicator turns red. A message is then displayed “Area Out of supply”.
The control panel where the above procedure is done is shown in Fig. 4.
The flowchart of the CWDS is also shown in Fig. 5
8. Conclusion
References
Anigbogu, S. O and Inyiama, H. C. (2006). Artificial Intelligence-Based Medical
Diagnostic Expert System for Malaria and the Related Ailments. Journal of Computer Science and its Applications, 12(1), 3-8.
Bao, Y., & Mays, L. W. (2001).Model for water distribution system reliability. Journal of Hydraulic Engineering, 116(9), 1119–1137
Harry E. Hickey. (2008). Water Supply Systems and Evaluation Methods. Volume I: Water Supply System Concepts. [Online] Available:
http://www.usfa.fema.gov/downloads/pdf/publications/Water_Supply_Systems_V olume_I.pdf (April 2, 2014)
Liang, T., &Nahaji, S. (2003). Managing Water Quality by mixing Water from different sources. Journal of Water Resources Planning and Management Division, 109, 48–57. Mays, L. W. (Ed.) (2001) Reliability analysis of water distribution systems, Congress
Cataloging-in-Publication Data, American Society of Civil Engineers (pp. 532).
Ostfeld, A., & Shamir, U. (2002).Design of optimal reliable multiquality water supply systems. Journal of Water Resources Planning and Management Division, 122(5), 322–333. Quimpo, R. G., &Shamsi, U. M. (2001). Reliability based distribution system maintenance.
Journal of Water Resources Planning and Management Division, 117(3), 321–339. Rossman, L. A. (2004). EPANET User Manual, Risk Reduction Engineering Laboratory, US
Environmental Protection Agency.
Saul, A. J., & Walters, G. A. (2000). Rehabilitation strategies for water distribution networks: a literature review with a UK perspective. Urban Water, 2(2), 153–170.
Shamsi, U. (2000). Computerized evaluation of Water Supply Reliability. IEEE Transaction on Reliability, 39(1), 35–41.