(UDC: 663.051.022.392)
Image analysis of oxidation induced food colour changes
L. Pezo 1, Z. Marković2, M. Pavlović 1, M. Kićanović1, S. Ostojić1,S. Zlatanović 1, J. Gvozdenović 2
1Institut of General and Physical Chemistry, Beograd, Studentski trg 12/V, Serbia, 2State University of Novi Pazar, Vuka Karadžića bb, Serbia,
3Faculty of Technology, Novi Sad, bul. Cara Lazara 1, Serbia
Abstract
Colour evaluation, by means of multivariate image analysis was applied on colour lightness changes corresponding to oxidative browning of minimally-processed basil-based food emulsions. We have analysed the influence of metal-chelating protein lactoferrin on browning of emulsions (atributed to enzymaic and non-enzymatic oxidation). The colourgram of digitalized images, taken during oxidation of the samples, was evaluated, both by colour analysis and by PCA analysis. The basic colour information was derived from frequency colour distribution for RGB and HSV colour system, while the PCA analysis was carried out by evaluating covariance matrix, for raw, mean centered and autoscaled matrix of the basic R, G, B colour information, and the evaluation of eigenvalues and eigenvectors for all three numeric models. The resulting colourgram information is one-dimensional signal, which consists of 4900 elements, and describes colour properties of the image. The changes in material due to oxidation was observed by the changes in lightness frequency distribution (L).
Key words: colourgram, PCA analysis, food, oxidation, browning
1. Introduction
In the assessment of food colour it is common practice to use spectrophotometers or light sensitive cells to quantify colour characteristics. The most diffused instruments evaluate only restricted areas of food samples or overall light reflectance from the entire surface of the food matrix, thus beeing not appropriate for inhomogenous food products. The changes in colour, occuring due to oxidation processes of such products can be observed by evaluation algorithm describing the colour intensity of digitalised images (Antonelli, A., et al. 2004, Riva M., et a. 2005, Acosta B., et al. 2010, Quevedo R., et al. 2009a, Kumara B., 2003, Gazmuri A.M., et al. 2009, Pilin A.,et al. 2009, Tien C. L., et al. 2001, Quevedo R., et al. 2009b). These authors evaluated colour characteristics of various materials. The colour images were taken using colorimeters, CCD cameras or optical scanners. Authors used different colour coordinate systems, and colour features were evaluated by image analysis.
oxidation (Chiu, C.H., et al. 2007, Huang, et al. 1999, Wakabayashi H., et al. 2006, Naidu A. S., 2002, Al-Nabulsi A. A., et al. 2005, Al-Nabulsi A. A., et al. 2007, C. Jacobsen, et al. 2008). Addition of natural antioxidative agents potentially influences lipid oxidation and browning (attributed to combined enzymatic and non-enzymatic oxidation) of minimally-processed green vegetable-based food emulsions. Pesto, obtained by the traditional recipe, from fresh basil, is limited to the very short shelf life due to oxidative procesess and microbial load (Severini, C., 2008, Fabiano, B., et al. 2000). Oxidative browning of pesto samples was determined by colour lightness changes, applying colour evaluation, by means of multivariate image analysis. Software was developed for processing of digitalized images in the form of one-dimensional signal, describing the colour content. The coloured, images were taken with a common digital CCD camera.The basic colour information was derived from frequency colour distribution for red, green and blue (RGB) and hue, saturation and intensity (HSI) colour system, while the PCA analysis (Huang, J., et al. 2003, Shlens, 2009) was carried out by evaluating covariance matrix, for raw, mean centered and autoscaled matrix of the basic R, G, B colour information, and the evaluation of eigenvalues and eigenvectors for all three numeric models. The changes in material due to oxidation was observed by the changes in lightness frequency distribution (L).
2. Materials and methods
2.1 Preparation of basil-based spreads
Basil-based spreads similar to italian pesto sauce, were prepared from fresh basil which was treated with hydrogen peroxide and/or short temperature shock during washing. The product contained virgin olive oil, refined sunflower oil, cheeses, such as parmesan and kachkaval, whey, walnuts, sunflower seeds, salt and garlic, as well as organic acids (ascorbic, citric and lactic acids) (Sigma-Aldrich, Germany) and lactoferrin (bovine lactoferrin, 95% protein, DMV International, Veghel, The Netherlands) as regulators of acidity, antioxidative and antimicrobial agents. The product was packaged in glass jars of 150g.
No. formulation pH
1. 0.5g/kg ascorbic acid, 0.4% NaCl 5.2
2. 0.5 g/kg ascorbic acid, 0.4% NaCl, 80 mg/kg lactoferrin, 5.3
3. 0.5 g/kg ascorbic acid, 0.4% NaCl, 400 mg/kg lactoferrin 5.3
4. 0.5 g/kg ascorbic acid, 0.4% NaCl, 2000 mg/kg lactoferrin 5.2
5. 0.5 g/kg ascorbic acid, 3% NaCl 5.3
6. 1 g/kg ascorbic acid, 1.5 g/kg citric acid, 0.4% NaCl 4.9
7 1 g/kg ascorbic acid, 1.5 g/kg citric acid, 0,4% NaCl, 400 mg/kg
lactoferrin 4.9
8. 1 g/kg ascorbic acid, 1.5 g/kg citric acid, 0.4% NaCl, 3.6% lactic acid 4.4
9. 1 g/kg ascorbic acid, 1.5 g/kg citric acid,
0.4% NaCl, 3.6% lactic acid 400 mg/kg lactoferrin
4.4
Table 1. Treatments of basil-based “pesto” spreads. Nine spreads were obtained by modulating levels of ascorbic acid, citric acid, lactic acid, NaCl and lactoferrin.
2.2 Colour analysis
Colour images of basil-based pesto spreads were captured by a Sony PowerShot A550 and A590 CCD camera, which is a common digital camera for home use. All the acquired images were 24 bit RGB (16.8 millions of colours) with a 1024 x 768 spatial resolution. The macro function of the digital camera has been used, to cover a scene area of approximately Ø10 cm. Each pesto sample was smeared to an approximately constant 3-5 mm thickness and to an area sufficient to cover completely the image scene, in order to avoid the presence of background in the image. Then, it was placed on a white paper napkin set on a flat white painted surface, 15cm below the digital camera. Paper napkins were used in order to absorb the excess of oil and therefore to avoid undesired reflection effects. With this setup, it was possible to capture images with negligible shadows and without specular reflections. There were 9 different pesto formulations to be observed, and the images of each different formulation of pesto were taken periodically by camera 22 times during the period of approximately 320 minutes.
C = Picture1.Point(X, Y): ‘3x8 bit color point at X, Y coordinate Blue = Int(C / 65536): C = C - Blue * 65536
Green = Int(C / 256) Red = C - Green * 256
The first step in the elaboration of every single digital RGB image with size {r, c, R, G, B} (where r is the number of pixel row, c is the number of pixel column and R, G and B channels) consists of unfolding it to a {(r x c), (R, G, B)} two-dimensional matrix of the R, G and B values (variables) for the r x c pixels (objects), i. e., (r x c) x 3 dimension. Since the imported files are 24 bit colour images, each one of the three R, G and B "slices" of the 3D array are (24/3) 8 bit greyscale images, and therefore the three R, G and B variables can assume all the integer values in the range 0-255. After this first step these coordinates were normalized, i. e., divided by 255, in order to be represented as values varies from 0 – 1.
Then, a series of quantities derived directly by the normalized R, G and B variables with simple algebraic operations are calculated for every pixel: lightness (L), which is the sum of R, G and B, divided by 3 (L=(R+G+B)/3) and the three relative colours, i.e. relative red (RR=R/(L·3)), relative green (RG=G/(L·3)) and relative blue (RB=B/(L·3)), which are ratios between the R, G, B values and their sum, L. It should be noticed that these values are also normalized, i. e., varies from 0 to 1. The relative values have been considered since a particular colour, e.g. red colour does not correspond to a high absolute value of the corresponding R variable, but to a high value of the ratio between R and L. For example, we can have R = 255 for pure red (with G = 0 and B = 0) , where RR coordinate equals 1.000, for white (with G = 255 and B = 255), RR coordinate reaches 0.333, and for yellow (with G = 255 and B = 0), RR coordinate is 0.667, etc.
Coresponding program routine should be as follows: L = B + G + R
RR = R / L: RG = G / L: RB = B / L: ‘relative coordinates L = L / 3: ‘lightness
The hue, saturation and intensity (HSI) values are also calculated, using the developed computer program, for the conversion from the RGB to the HSI colour space. The I values are computed for every pixel as the maximum value between R, G, and B:
max( , , )
l R G B (1)
while the S values are given by:
max( , , ) min( , , ) max( , , )
R G B R G B
S
R G B
(2)
H value is defined by a quite complex algorithm, difficult to represent in an easily readable analytical form, in a way that it varies from 0 to 1 with the corresponding colour passing from red through yellow, green, cyan, blue, and magenta, and then back to red. The Visual Basic procedure should be expressed as follows:
x1 = (G - R) / Sqr(2): y1 = (2 * B - R - G) / Sqr(6) If x1 = 0 And y1 = 0 Then Arg = 0
If y1 = 0 And x1 < 0 Then Arg = Pi If x1 = 0 And y1 < 0 Then Arg = -Pi / 2 If x1 > 0 Then Arg = Atn(y1 / x1)
If x1 < 0 And y1 >= 0 Then Arg = Pi - Atn(-y1 / x1) If x1 < 0 And y1 < 0 Then Arg = -Pi + Atn(-y1 / -x1) H = Arg * 180 / Pi + 150
If S = 0 Or I = 0 Then H = 0 If H < 0 Then H = H + 360 If H >= 360 Then H = H – 360
After normalization of H value ( min max min H H
H H
), all above mentioned variables (R, G, B, L, RR, RG, RB, H, S, I) fall within the range of 0 to 1 (all of them are normalized, as mentioned
above). Each of this value can be represented by descrete number:
255
i
j
, where, i = 0 to255. Then, a frequency distribution vector with a length of 256 elements is calculated over all the single pixels (r x c), for each one of the considered variables: R, G, B, L, RR, RG, RB, H, S, I, for instance the elements of red value distribution curve are calculated as follows:
If R = j then R1(j * 255) = R1 (j * 255) + 1
The elements of all other variables are calculated similarly. There were 10 variables, i. e., 10 distribution curves with 256 elements for each picture (256 x 10 matrix).
The PCA analysis was evaluated in above mentioned program, using the score matrix of raw unfolded matrix, the score matrix of mean centered score unfolded matrix, and the score matrix of autoscaled unfolded RGB matrix. The element of raw matrix were: R(i), G(i), B(i), i = 0,…, 255. Mean centered matrix was evaluated by evaluating the subtracting the mean value of each color vector to each element of the vector:
For i = 0 to 255: R_MEAN (i) = R1(i) – RMEAN: Next i
The autoscaled matrix was evaluated by dividing the mean centered matrix vectors with standard deviations for each vector:
For i = 0 to 255: R_AUTOSC (i) = R_MEAN(i) / R_STD: Next i
The evaluation of covariance and correlation matrix for raw, mean centered and autoscaled matrix followed, with the evaluation of eigenvectors and eigenvalues of covariance matrix. The eigenvectors of covariance matrix for all three models were treated as loading vectors in PCA analysis. The used equations for calculation of covariance and correlation were:
255
0
cov ,
255
i RG
R i RMEAN G i GMEAN
R G
255
0
255 2 2
0
, i
RG
i
R i RMEAN G i GMEAN corr R G
R i RMEAN G i GMEAN
(4)The eigenvalues (λ) of evaluated covariance matrix were calculated, as usually, using the equation:
det(COV
I) 0,1
cov
cov
cov
1
cov
cov
cov
1
RG RB RG GB RB GB
COV
(5)where, COV is the covariance matrix, and I is identity matrix.
The evaluation of roots for equation (5), was implemented in above mentioned program, using
Newton’s iterative method for finding roots of function
a ³ b ² c d 0
:
x = ((3*c/a) – (b^2/a^2))/3: y = ((2*b^3/a^3) – (9*b*c/a^2) + (27*d/a))/27 z = y^2/4 + x^3/27
i = sqr(y^2/4 - z): j = -i^(1/3): k = arccos(-(y/2*i)) m = cos(k/3): n = sqr(3)*sin(k/3): p = -(b/3*a)
Eig1 = -2j*m + p: Eig2 = j *(m + n) + p: Eig3 = j*(m - n) + p
The eigenvectors of covariance matrix are then calculated as:
P COV I (6)
and it should be calculated for all three models, raw, mean centered and autoscaled. The score matrix is evaluated as:
T X P (7)
where X is the raw, mean centered and autoscaled data matrix, T is the score model and P is the loading vectors (eigenvalues) of raw, mean centered and autoscaled model.
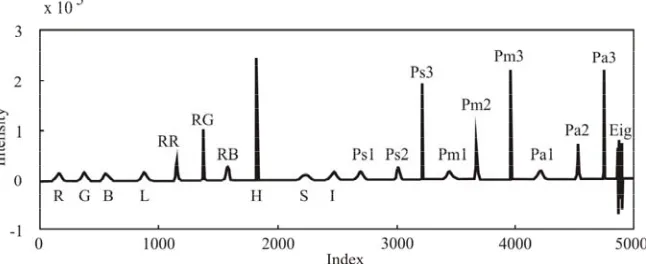
Equation (7) is used for matrix transformation of original matrix X (for all three models), and this transformation is defined by P matrix. The result of this matrix transformation is designed as score matrix for all three models, marked as Ps1, Ps2, Ps3, Pm1, Pm2, Pm3, Pa1, Pa2 and Pa3 on colourgram. Each of these matrix is formated by 3 x 256 values (R, G, B, for raw matrix, mean centered matrix, and autoscaled matrix). These vectors are joined in 256 x 9 matrix, and added to above formed 256 x 10 matrix.
Results
The resulting colourgram information is one dimensional signal, which is consisted of 10 x 256 + 9 x 256 + 3 x 3 x 3 + 3 x 3 x 1 = 4900 elemenats, as shown above, and it describes the colour properties of the image. The typical form of colourgram is shown on Fig. 1.
Fig. 1. Typical colorogram of pesto sample.
In this work, only lightness (L) was used to represent data recorded during the experiment, and these data is represented in reltive form, i. e., lightness was divided by initial lightness:
rel init
L
L
L
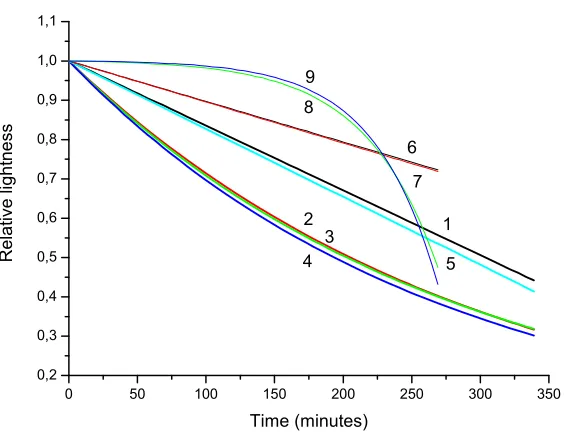
(8)The value L in equation (8), represents the maximum value reached in frequency distribution vector of lightness (while colourgram evaluation). It is been found that the pesto sample is getting darker while exposed to oxigen (browning effect), acording to exponential law (
y
y
0
A
exp( / )
x t
). Evaluated correlation coefficient for these curves were R2 =0,87,0 50 100 150 200 250 300 350 0,2
0,3 0,4 0,5 0,6 0,7 0,8 0,9 1,0 1,1
4 3 2
5 1 8
9
7
Relat
ive li
ght
ness
Time (minutes) 6
Fig. 2. Relative lightness of basil-based (pesto) spreads during oxidation at room temperature. The effect of 9 treatments with ascorbic, citric, lactic acid, NaCl and lactoferrin, as presented in
Table 1.
Pesto, obtained by the traditional recipe, from fresh basil, is limited to the very short shelf life. For this reason, pasteurisation or sterilisation and/or lowering of pH and addition of antimicrbial and antioxidative agents are needed for industrial production, but these treatments lead to colour, taste and flavour degradation. Changes in colour of pesto, occuring due to oxidation processes (oxidation of phenols, degradation of chlorophyll and non-enzymatic browning, due to the reaction of oxidated lipids with proteins), can be observed by evaluation algorithm describing the colour changes during oxidation process, obtained through colourgram analysis. The relative colour lightness, Figure 2., in all samples with 0.5 g/kg of ascorbic acid containing lactoferrin concentrations 80, 400 and 2000 mg/kg (treatments 2 and 3 and 4, respectively), decreased more quickly during the time, i.e. the browning was more intensive than in the control treatment 1. Samples containing lactic acid (3.6%) in combination with ascorbic acid (1 g/kg) and citric acid (1.5 g/kg), browned abruptly (treatments 8 and 9), after a period of 150 min, while the samples containing ascorbic acid (1 g/kg) and citric acid (1.5 g/kg), (treatments 6 and 7), proved to be least prone to oxidation. Treatments 7 and 9, contained 400 mg/kg of lactoferrin. The comparable results are obtained in different experimental systems, such as the application of digital image processing, which was very usefull for studying of enzymatic and non-enzymatic browning of fruits (Riva M., et al. 2005), and L coordinate of digital image was found to be significant for enzymatic browning (Acosta B., et al. 2010).
Conclusion
The colourgram was evaluated, both by colour analyzing and by PCA analysis. The basic colour information was derived from frequency colour distribution for RGB and HSV colour system, while the PCA analysis was carried out by evaluating covariance matrix, for raw, mean centered and autoscaled matrix of the basic R, G, B colour information, and the evaluation of eigenvalues and eigenvectors for all three numeric models. The resulting colourgram information is one-dimensional signal, which is consisted of 4900 elements, and describes colour properties of the image. The changes in material due to oxidation was observed by the changes in lightness frequemcy distribution (L).
Ascorbic and combination of ascorbic and citric acids inhibited browning of the product, (attributed to combined enzymatic and non-enzymatic oxidation), while lactoferrin slightly enhances browning in the presence of ascorbic acid (0.5 g/kg) at pH 5.2-5.3.
Извод
Анализе
слика
промене
боје
хране
услед
оксидације
L. Pezo 1, Z. Marković2, M. Pavlović 1, M. Kićanović1, S. Ostojić1, S. Zlatanović 1, J. Gvozdenović 2
1Institut of General and Physical Chemistry, Beograd, Studentski trg 12/V, Serbia, 2State University of Novi Pazar, Vuka Karadžića bb, Serbia,
3Faculty of Technology, Novi Sad, bul. Cara Lazara 1, Serbia
Резиме
Оцењивање боје, преко вишепараметарске анализе слика примењено је за праћење промена у осветљености боја, које одговарају оксидативном тамњењу минимално
-прерађених прехрамбених емулзија на бази босиљка. Анализирали смо утицај лактоферина, протеíна хелатора метала на тамњење емулзија (које може потицати од ензиматског и неензиматског тамњења). Оцењивани су колорограми дигитализованих слика, добијенихтокомоксидацијеузорака, коришћењеманализебојеиПЦАанализом.
Основнаинформацијаобојидобијенајеизрасподелеучесталостибоја, заРГБ (црвено,
зеленоиплаво) иХСВ (сјај, засићеностиинтензитет) системебоја, докјеПЦА анализа извршена вредновањем коваријансне матрице за основне, осредњене и аутоскалиране матрице почетних РГБ информација о боји и вредновањем сопствених вредности коваријанснематрице ивектора сопственихвредностиковаријансне матрицезасва три нумеричкамодела. Резултирајућаинформацијаколорограмајеједнодимензијалнисигнал којисе састојиод 4900 елеменатаиописујеособине бојаслике. Променеуматеријалу,
које настају током оксидације праћене су преко промена у расподели учесталости осветљености (Л).
Кључне речи: колорограм, ПЦАанализа, храна, оксидација, тамњење
References
Acosta B., Monguí J., Galvis J. A., Rodríguez M., Effect of application of browning inhibitors on the shelf life of minimally processed green lettuce, Food Innova 2010, 25-29 October 2010
Al-Nabulsi A. A., Holley R.A., (2005), Effect of bovine lactoferrin against Carnobacterium viridans, Food Microbiol., 22, 179–187
Al-Nabulsi A. A., Holley R. A., Int. J. Food Microbiol., (2007), Effercts on Echerichia coli O157:H7 and meat starter cultures of bovine lactoferrin in broth and microencapsulated lactoferrin in dry sausage batters, Int. J. Food Microb., 113, 84–91
Antonelli, A., Cocchi, M., Fava, G., Franchini, G. C., Manzini, D., Ulrici, A., (2004) Automated evaluation of food colour by means of multivariate image analysis coupled to a wavelet-based classification algorithm, Anal. Chim. Acta, 515, 3-13
Fabiano, B., Perego, P., Pastorino, R., Del Borghi, M., (2000), The extension of the shelf-life of “pesto” sauce by a combination of modified athmosphere packaging and refrigeration, Int. J. Food Sci. Techn, 35, 293-303
Gazmuri A.M., Bouchon P., Analysis of wheat gluten and starch matrices during deep-fat frying, Food Chemistry 115 (2009) 999–1005
Huang, S-W, Satue-Gracia, T., Frankel, E. N., German, B., (1999) Effect of lactoferrin on oxidative stability of corn oil emulsions and liposomes, J. Agric. Food Chem., 47, 1356-1361
Huang, J., Wium, H., Qvist, K. B., K., Esbensen, H., (2003) Multi-way methods in image relationship and applications, Chemometrics Intell. Lab. Syst. 66 141 – 158,
Jacobsen C., Let M. B., Nielsen N. S., Meyer A. S., (2008), Antioxidant strategies for preventing oxidative flavour deterioration of foods enriched with n-3 polyansaturated fatty lipids: a comparative evaluation Trends Food Sci. Technol., 19, 76-93.
Kumara B., Jinap S., Che Man Y.B., Yusoff, M.S.A., Note: Comparison of Colour Techniques to Measure Chocolate Fat Bloom, Food Science and Technology International 2003, 295, DOI: 10.1177/108201303036045
Naidu A. S., (2002), Activated lactoferrin – a new approach to meat safety, Food Technol. 56, 40-45
Pilin A., Pudil F., Bencko V., Changes in colour of different human tissues as a marker of age, Int J Legal Med (2007) 121:158–162, DOI 10.1007/s00414-006-0136-4
Quevedo R., Dıaz O., Caqueo A., Ronceros B., Aguilera J.M., Quantification of enzymatic browning kinetics in pear slices using non-homogenous L* color information from digital images, LWT - Food Science and Technology 42 (2009) 1367–1373
Quevedo R., Díaz O., Ronceros B., Pedreschi F., Aguilera J. M., Description of the kinetic enzymatic browning in banana (Musa cavendish) slices using non-uniform color information from digital images, Food Research International 42 (2009) 1309–1314
Riva M., Campolongo S., Leva A. A., A. Maestrelli, D. Torreggiani, Structure–property relationships in osmo-air-dehydrated apricot cubes, Food Research International 38 (2005) 533–542
Severini, C., Corbo, R., Derossi, A., Bevilaqua, A., Giulliani, R., (2008) Use of the humectants for the stabilisation of pesto sauce, Int. J. Food Sci Techn., 43, 1041-46
Shlens, J., A Tutorial on Principal Component Analysis, Center for Neural Science, New York University, New York City, and Systems Neurobiology Laboratory, Salk Insitute for Biological Studies, La Jolla (2009)
Tien C. L., Vachon C., Mateescu M.-A., Lacroix M., Milk Protein Coatings Prevent Oxidative Browning of Apples and Potatoes, Journal of food science, 66/ 4, (2001), 512-516

![Di μ chloro bis{chloro[2 (4 methylphenylamino) 1,2 diphenylethanoximato]copper(II)}](data:image/gif;base64,R0lGODlhAQABAIAAAP///wAAACH5BAEAAAAALAAAAAABAAEAAAICRAEAOw==)