R E S E A R C H A R T I C L E
Open Access
Comparison of ISS, NISS, and RTS score as
predictor of mortality in pediatric fall
Kapil Dev Soni
†, Santosh Mahindrakar
†, Amit Gupta
*, Subodh Kumar, Sushma Sagar and Ashish Jhakal
Abstract
Background:Studies to identify an ideal trauma score tool representing prediction of outcomes of the pediatric fall patient remains elusive. Our study was undertaken to identify better predictor of mortality in the pediatric fall patients.
Methods:Data was retrieved from prospectively maintained trauma registry project at level 1 trauma center developed as part of Multicentric Project—Towards Improving Trauma Care Outcomes (TITCO) in India. Single center data retrieved from a prospectively maintained trauma registry at a level 1 trauma center, New Delhi, for a period ranging from 1 October 2013 to 17 February 2015 was evaluated. Standard anatomic scores Injury Severity Score (ISS) and New Injury Severity Score (NISS) were compared with physiologic score Revised Trauma Score (RTS) using receiver operating curve (ROC).
Results:Heart rate and RTS had a statistical difference among the survivors to nonsurvivors. ISS, NISS, and RTS were having 50, 50, and 86% of area under the curve on ROCs, and RTS was statistically significant among them.
Conclusions: Physiologically based trauma score systems (RTS) are much better predictors of inhospital mortality in comparison to anatomical based scoring systems (ISS and NISS) for unintentional pediatric falls.
Keywords: Pediatric fall, Trauma score system, ISS, NISS, RTS
Background
Unintentional injuries were responsible for 3.9 million deaths and over 138 million disability adjusted life-years in 2004, and among them, 90% are from low- and middle-income countries (LMIC) [1–5]. A global pilot study on unintentional injury among childhood in the developing countries reveals that more than half had a history of falls (52%) [6, 7]. Principle of trauma care is same for the adult and pediatric, but the anatomical and physiological status of children increases the risk of severe injury with minor fall [8–10]. A systematic re-view on risk of pediatric (0–6 years) fall reveals that age, sex, and poverty are independent risk factors for injuries [11].
Trauma scoring system is an essential component of triage, to compare the different models of trauma care and its quality [12]. Previous study showed Glasgow
Coma Scale (GCS) as a superior predictor for inhospital mortality in comparison to Pediatric Trauma Score (PTS) [13, 14] and Injury Severity Score (ISS) raising concerns about the suitability of using anatomical based scoring systems. Potoka et al. developed novel scoring system based upon age-specific physiological criteria and concluded physiological-based score as a tool for predic-tion of survival [15]. Previous attempts to compare and validate different scoring systems in pediatric patients have yielded varying results [15–17]. However, an ideal tool for prediction in pediatric trauma remains elusive. The performance of trauma score may vary on the dif-ferent systems of care as well as difdif-ferent mechanism of injury.
Henceforth, the aim of the study is to compare three different severity score ISS, New Injury Severity Score (NISS), Revised Trauma Score (RTS) systems sensitivity among the pediatric patients arriving at emergency de-partment of the tertiary level 1 trauma center after fall. * Correspondence:[email protected]
†Equal contributors
Department of Trauma Surgery and Critical Care, Jai Prakash Narayan Trauma Centre, AIIMS, New Delhi, India
Methods
The data was collected from the trauma registry devel-oped under Towards Improving Trauma Care Outcome in India (TITCO), and the ethical permission was availed from the Institute Ethical Committee (All India Institute of Medical Sciences) for the study. The present paper is a secondary analysis of a single center data from a multi-centre study (no. IEC/NP-279/2013 RP-01/2013).
Data was retrieved from a prospectively maintained trauma registry at a level 1 trauma center, New Delhi, for a period ranging from 1 October 2013 to 17 February 2015. The registry includes all the patients admitted and died in the emergency room (ER). Patients were further screened; all pediatric fall patients were identified in the dataset and included for analysis. Patients with single long-bone injuries and brought dead were excluded.
The ISS, NISS, and RTS were calculated retrospect-ively based on internationally agreed definitions on Ab-breviated Injury Score (AIS) coding, calculated by certified coders (the Association for Advancement of Automotive Medicine (AAAM)). All the injuries of each patient are coded as per the AIS. There are nine body regions in AIS. A composite score is formed by combin-ation of these nine into six, and from these six regions, the highest value from three regions are selected. These highest values are squared and added together to calcu-late to be called as ISS. The highest three scoring from any of the nine AIS region is squared and added to achieve a composite score called as NISS. RTS is calcu-lated as per the formula: RTS = 0.9368GCS + 0.7326SBP + 0.2908RR.
The data were further analyzed using SPSS 23.
Statistical analysis
Chi square test and independent ttest were applied for categorical and continuous variable hypothesis testing. Receiver operating curve (ROC) was used to predict the mortality with three different trauma score systems. The variables needed to compute RTS, ISS, and NISS were available and used from dataset; however, PTS variables were unavailable.
Results
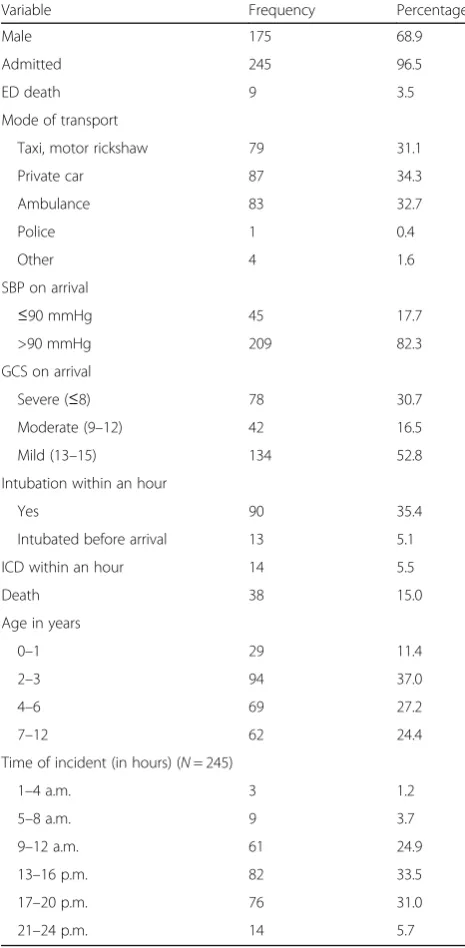
Out of 3408 patients screened, 385 were in pediatric age group (0–12 years). Two hundred fifty-four pediatric pa-tients were brought with history of fall and rest with other mechanism of injury (Fig 1). Falls were analyzed further, 68.9% were male, and among the mode of transport, taxi (31.1%), private car (34.3%), and ambulance (32.7%) were equally preferred. Nine 3.5% patients died early in the course within the ER with overall inhospital mortality of
Fig. 1Flow chart
Table 1Descriptive analysis of categorical variableN= 254
Variable Frequency Percentage
Male 175 68.9
Admitted 245 96.5
ED death 9 3.5
Mode of transport
Taxi, motor rickshaw 79 31.1
Private car 87 34.3
Ambulance 83 32.7
Police 1 0.4
Other 4 1.6
SBP on arrival
≤90 mmHg 45 17.7
>90 mmHg 209 82.3
GCS on arrival
Severe (≤8) 78 30.7
Moderate (9–12) 42 16.5
Mild (13–15) 134 52.8
Intubation within an hour
Yes 90 35.4
Intubated before arrival 13 5.1
ICD within an hour 14 5.5
Death 38 15.0
Age in years
0–1 29 11.4
2–3 94 37.0
4–6 69 27.2
7–12 62 24.4
Time of incident (in hours) (N= 245)
1–4 a.m. 3 1.2
5–8 a.m. 9 3.7
9–12 a.m. 61 24.9
13–16 p.m. 82 33.5
17–20 p.m. 76 31.0
21–24 p.m. 14 5.7
15% in the pediatric fall cohort. One third patients pre-sented with low GCS (less than 8) and were intubated. One third (33.5%) of the fall cases occurred between 13 and 16 p.m. and most (64.5%) within 8 h of the day (13–20 p.m.). More than one third (37%) of patients were in toddler (2–3 years) with few in preschooler (4–6 years) (27.2%) and school age (7–12 years) (24.4%) (Table 1). However, only few (17.7%) of them were having systolic blood pres-sure (SBP) less than or equal to 90 mmHg. Mean age of the patients was 4.5 ± 3 years, and mean of (SBP), SpO2, respir-ation rate, heart rate, and GCS were 105.25 ± 23.3 mmHg, 93.29 ± 17.6%, 19.4 ± 4.9 breaths/min, 106.9 ± 28.2 beats/ min, and 11.24 ± 4.3 respectively. Mean ISS, NISS, and RTS scores were 11.87 ± 7.6, 17.15 ± 10.1, and 6.71 ± 1.6 respect-ively (Table 2).
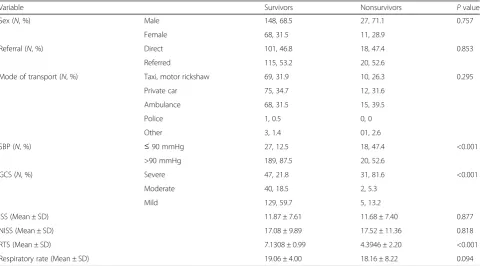
Percentage of patients with SBP less than or equal to 90 mmHg and severe GCS on arrival were statistically high among nonsurvivors. The mean ISS, RTS, and re-spiratory rate per minute were low among the nonsur-vivors than surnonsur-vivors whereas heart rate per minute and NISS among the nonsurvivors were higher. Among these vital signs and severity scores and RTS had a stat-istical difference among the survivors to nonsurvivors (Table 3).
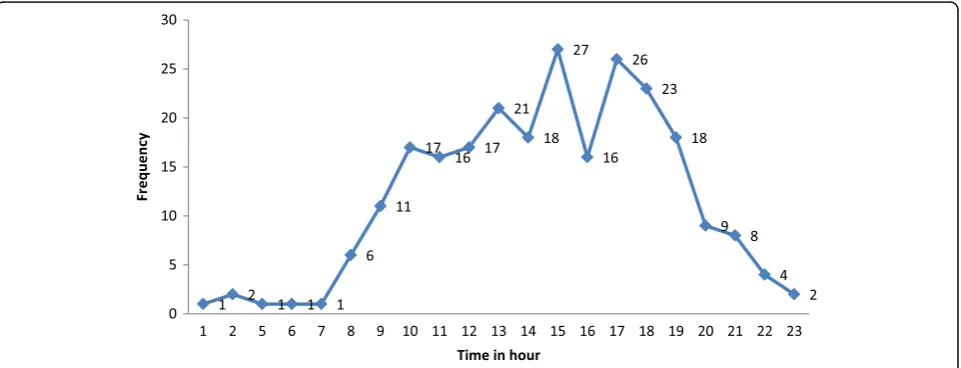
Negative linear correlation (r=−0.52) was found be-tween the age and frequency of fall signifying decrease in incidence of fall as the age progresses (Fig. 2). Figure 3
represent corelation between arrival time to the ER and number of pediatric patients with fall .
ISS, NISS, and RTS were calculated by the AAAM coders and were assessed to predict the sensitivity of these tools among the pediatric fall cases. Receiver operating characteristic curve was used to compare the sensitivity of three different trauma scores.
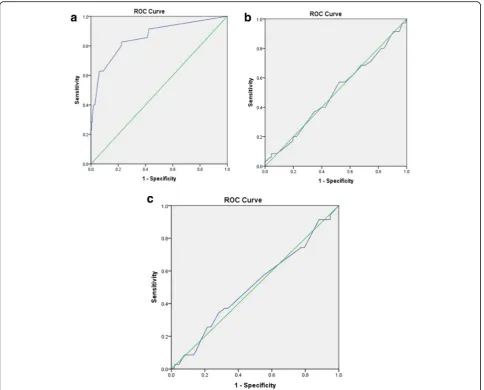
Among these three trauma scores, ISS, NISS, and RTS were having 50, 50, and 86% of area under the curve Table 2Descriptive analysis of continuous variables
Total Range Mean Std.
deviation
Age (years) 254 0–12 4.50 3.0
SBP
(mmHg) (on arrival to ED
253 0–190 105.25 23.3
Heart rate (beats/min) (on arrival to ED)
254 0–256 106.90 28.2
GCS (on arrival to ED) 254 3–15 11.24 4.3
SpO2(on arrival to ED) 254 0–100 93.29 17.6
Respiration rate (breaths/min) (on arrival to ED
250 0–40 19.40 4.9
ISS 230 1–42 11.87 7.6
NISS 230 1-50 17.15 10.1
RTS 250 0.29–7.84 6.71 1.6
SBPsystolic blood pressure,EDemergency department,GCSGlasgow Coma Scale,ISSInjury Severity Score,NISSNew Injury Severity Score,RTS Revised Trauma Score
Table 3Comparison selected variables among survivors and nonsurvivors
Variable Survivors Nonsurvivors Pvalue
Sex (N, %) Male 148, 68.5 27, 71.1 0.757
Female 68, 31.5 11, 28.9
Referral (N, %) Direct 101, 46.8 18, 47.4 0.853
Referred 115, 53.2 20, 52.6
Mode of transport (N, %) Taxi, motor rickshaw 69, 31.9 10, 26.3 0.295
Private car 75, 34.7 12, 31.6
Ambulance 68, 31.5 15, 39.5
Police 1, 0.5 0, 0
Other 3, 1.4 01, 2.6
SBP (N, %) ≤90 mmHg 27, 12.5 18, 47.4 <0.001
>90 mmHg 189, 87.5 20, 52.6
GCS (N, %) Severe 47, 21.8 31, 81.6 <0.001
Moderate 40, 18.5 2, 5.3
Mild 129, 59.7 5, 13.2
ISS (Mean ± SD) 11.87 ± 7.61 11.68 ± 7.40 0.877
NISS (Mean ± SD) 17.08 ± 9.89 17.52 ± 11.36 0.818
RTS (Mean ± SD) 7.1308 ± 0.99 4.3946 ± 2.20 <0.001
Respiratory rate (Mean ± SD) 19.06 ± 4.00 18.16 ± 8.22 0.094
(Fig. 4). RTS was statistically significant among them. Performance of ISS and NISS was considerably low (Table 4).
Discussion
We compared the three standard trauma scores, i.e., RTS, ISS, NISS, in the pediatric fall population and found that RTS was most sensitive to predict the inhos-pital mortality. This may be attributed to higher propen-sity of respiratory and neurological derangements seen frequently in pediatric patients in absence of anatomical injuries. It may be speculated that since ISS depends on anatomical injuries, a conservative approach for radio-logical investigations may miss substantial number of in-juries and could lead to poor performance of ISS and
NISS in the given cohort of pediatric fall. Previous studies has shown that vital signs like heart rate, respira-tory rate, and GCS may be more accurate predictors for inhospital mortality than ISS and NISS and may depend on age [15, 18]. Similarly in adults, a multicentric study in India concluded that RTS is a better predictor of in-patient mortality than ISS and NISS [12]. However, per-formance of RTS in particular cohort of pediatric fall was lacking. The present study demonstrates the con-sistent superiority of RTS against ISS and NISS too. Among children, a smaller injury or fall may result in severe derangements and have adverse outcome due to their physiological vulnerability, immature immune sys-tem, and fragile structure [8]. El-Gamasy et al. 2016 studied Pediatric Trauma Big Score as a predictive for Fig. 2Scatter diagram representing the age and frequency of the fall among pediatric patients
mortality in pediatric polytraumatized patients and concluded that it has higher sensitivity and specificity than other trauma scores (PTS and NISS) [19, 20].
Limitation
This study is limited to the patients admitted in one of the tertiary trauma level 1 trauma center in Delhi. It is a secondary analysis of prospectively collected dataset; hence, pediatric trauma score could not be compared
to RTS, ISS, and NISS since the variables needed to compute were not available. Therefore, the question whether PTS or RTS is a better predictor for inhospital mortality in pediatric fall cohort could not be answered in the present study. The study could not calculate Pediatric Big Score due to lack of required variable in the data base.
Conclusions
To conclude, physiologically based trauma score systems (RTS) are much better predictors of inhospital mortality in comparison to anatomical based scoring systems (ISS, NISS) for unintentional pediatric falls. Fall constitutes major mechanism of unintentional injury to pediatric cohort. An identification of more precise tool may help clinician to better identify the patients at risk of worse outcome at an early stages and could lead to institutions of prophylactic measures.
Fig. 4Receiver operating curve (ROC) curve ofaRevised Trauma Score (RTS),bInjury Severity Score (ISS), andcNew Injury Severity Score (NISS)
Table 4Area under the curve for different severity scores
Score Area under curve Pvalue
ISS 0.507 0.901
NISS 0.495 0.959
Acknowledgements
The authors would like to thank Prof. Nobhojit Roy (principle investigator of the multicentric study: Towards Improved Trauma Care Outcomes (TITCO) for his overall support of the project and the current study.
Funding None.
Availability of data and materials
Yes. The dataset used and analyzed for the current study are available as suplementary/additional file.
Authors’contributions
KDS, SM, and AG contributed to the conception and design of the study. KDS, SM, and AG contributed to the acquisition of data. KDS, SM, AG, and AJ contributed to the analysis and/or interpretation of data. KDS, SM, AG, SK, and SS contributed to drafting of the manuscript. SK and SS contributed to the revision of the manuscript critically for important intellectual content. KDS, SM, AG, SK, SS, and AJ contributed to the approval of the version of the manuscript to be published.
Competing interests
The authors declare that they have no competing interests.
Ethics approval and consent to participate
We have obtained permission from the Institute Ethical Committee (All India Institute of Medical Sciences) for the study. The present paper is a secondary analysis of a single center data of the multicentric study“Towards Improved Trauma Care Outcomes (TITCO)”no. IEC/NP-279/2013 RP-01/2013.
Received: 9 February 2017 Accepted: 8 June 2017
References
1. Hyder AA, Vecino-Ortiz AI. BRICS: opportunities to improve road safety. Bull World Health Organ. 2014;92(6):423–8
2. Chandran A, Hyder AA, Peek-Asa C. The global burden of unintentional injuries and an agenda for progress. Epidemiol Rev. 2010;32(1):110–20. 3. Bradbury K. Predictors of unintentional injuries to school-age children seen
in pediatric primary care. J Pediatr Psychol. 1999;24(5):423–33. 4. Babu A, Rattan A, Ranjan P, Singhal M, Gupta A, Kumar S, et al . Are falls
more common than road traffic accidents in pediatric trauma? Experience from a Level 1 trauma centre in New Delhi, India. Chin J Traumatol. 2016; 19(2):75–8.
5. Bhargava P, Singh R, Prakash B, Sinha R. Pediatric head injury: an epidemiological study. J Pediatr Neurosci. 2011;6(1):97–8.
6. Bhamkar R, Seth B, Setia MS. Profile and risk factor analysis of unintentional injuries in children. Indian J Pediatr. 2016;83(10):1114–20.
7. Hyder A. Global childhood unintentional injury surveillance in four cities in developing countries: a pilot study. Bull World Health Organ. 2009;87(5): 345–52.
8. Advanced trauma life support (ATLS®): the ninth edition. J Trauma Acute Care Surg. 2013;74(5):1363-6.
9. Mock C. Guidelines for essential trauma care. 2004.
10. Trunkey DD. Guidelines for essential trauma care. World J Surg Springer-Verlag. 2005;29(5):662–2.
11. Khambalia A, Joshi P, Brussoni M, Raina P, Morrongiello B, Macarthur C. Risk factors for unintentional injuries due to falls in children aged 0-6 years: a systematic review. Inj Prev. 2006;12(6):378–81.
12. Roy N, Gerdin M, Schneider E, Kizhakke Veetil DK, Khajanchi M,et al. Validation of international trauma scoring systems in urban trauma centres in India. Injury. 2016;47(11):2459–64.
13. Yousefzadeh-chabok S. Comparing Pediatric Trauma, Glasgow Coma Scale and Injury Severity scores for mortality prediction in traumatic children. Ulus Travma Acil Cerrahi Derg. 2016;22(4):328–32.
14. Cicero M, Cross K. Predictive value of initial Glasgow coma scale score in pediatric trauma patients. Pediatr Emerg Care. 2013;29(1):43–8. 15. Potoka DA, Schall LC, Ford HR. Development of a novel age-specific
pediatric trauma score. J Pediatr Surg. 2001;36(1):106–12.
16. Narci A, Solak O, Turhan-Haktanir N, Aycicek A, Demir Y, Ela Y et al. The prognostic importance of trauma scoring systems in pediatric patients. Pediatr Surg Int. 2009;25(1):25–30.
17. Grisoni E, Stallion A, Nance ML, Lelli JL Jr, Garcia VF, Marsh E. The New Injury Severity Score and the evaluation of pediatric trauma. J Trauma. 2001;50(6): 1106–10.
18. Marcin JP, Pollack MM. Triage scoring systems, severity of illness measures, and mortality prediction models in pediatric trauma. Crit Care Med. 2002; 30(11):S457-6.
19. El-Gamasy ME-A, Elezz AEBA, Basuni AM, Elrazek MSAA. Pediatric trauma BIG score: predicting mortality in polytraumatized pediatric patients. 2016;20(11): 640–6.
20. Borgman MA, Maegele M, Wade CE. Pediatric trauma BIG score: predicting mortality in children after military and civilian trauma. Pediatr. 2011;127(4): e892-7.
• We accept pre-submission inquiries
• Our selector tool helps you to find the most relevant journal
• We provide round the clock customer support
• Convenient online submission
• Thorough peer review
• Inclusion in PubMed and all major indexing services
• Maximum visibility for your research
Submit your manuscript at www.biomedcentral.com/submit