R E S E A R C H
Open Access
Predictive models for pressure ulcers from
intensive care unit electronic health records
using Bayesian networks
Pacharmon Kaewprag
1*, Cheryl Newton
2, Brenda Vermillion
3,4, Sookyung Hyun
5, Kun Huang
1,6*and Raghu Machiraju
1,6*FromThe International Conference on Intelligent Biology and Medicine (ICIBM) 2016 Houston, Texas, USA. 08-10 December 2016
Abstract
Background:We develop predictive models enabling clinicians to better understand and explore patient clinical data along with risk factors for pressure ulcers in intensive care unit patients from electronic health record data. Identifying accurate risk factors of pressure ulcers is essential to determining appropriate prevention strategies; in this work we examine medication, diagnosis, and traditional Braden pressure ulcer assessment scale measurements as patient features. In order to predict pressure ulcer incidence and better understand the structure of related risk factors, we construct Bayesian networks from patient features. Bayesian network nodes (features) and edges (conditional dependencies) are simplified with statistical network techniques. Upon reviewing a network
visualization of our model, our clinician collaborators were able to identify strong relationships between risk factors widely recognized as associated with pressure ulcers.
Methods:We present a three-stage framework for predictive analysis of patient clinical data: 1) Developing electronic health record feature extraction functions with assistance of clinicians, 2) simplifying features, and 3) building Bayesian network predictive models. We evaluate all combinations of Bayesian network models from different search algorithms, scoring functions, prior structure initializations, and sets of features.
Results:From the EHRs of 7,717 ICU patients, we construct Bayesian network predictive models from 86 medication, diagnosis, and Braden scale features. Our model not only identifies known and suspected high PU risk factors, but also substantially increases sensitivity of the prediction - nearly three times higher comparing to logistical regression models - without sacrificing the overall accuracy. We visualize a representative model with which our clinician collaborators identify strong relationships between risk factors widely recognized as associated with pressure ulcers.
Conclusions:Given the strong adverse effect of pressure ulcers on patients and the high cost for treating pressure ulcers, our Bayesian network based model provides a novel framework for significantly improving the sensitivity of the
prediction model. Thus, when the model is deployed in a clinical setting, the caregivers can suitably respond to conditions likely associated with pressure ulcer incidence.
Keywords:Pressure ulcers, Intensive care units, Electronic health records, Bayesian networks, Model learning
* Correspondence:[email protected];[email protected];
1Department of Computer Science and Engineering, The Ohio State University, Columbus, Ohio, USA
Full list of author information is available at the end of the article
Background
Pressure ulcers
A pressure ulcer (PU) is a localized injury to the skin and/ or underlying tissue usually over a bony prominence, as a result of pressure, possibly in combination with shear [1]. Surveys indicate that patients admitted to the intensive care unit (ICU) have higher incidence of PUs than general hos-pital patients in acute care settings [2]. The prevalence of ICU pressure ulcers in the United States during the year 2009 ranged from 16.6% to 20.7% [2]. An estimated 2.5 mil-lion patients are treated each year in acute care settings at a cost of $11 billion per year due to PUs [3], many of which may be preventable.
Identifying accurate risk factors of PUs is essential to de-termining appropriate prevention strategies. Risk factors for ICU patients are likely to be different from those of general hospital patients since ICU patients are often in more morbid conditions and are hence more likely to be advised for bed rest. Consequently, the supine and sedentary pos-ition required of a bed rest in conjunction with related fac-tors often leads to the onset or aggravation of PUs. The Braden scale is a risk assessment tool that can assist nurses in identifying a patient’s risk of developing a pressure ulcer [4]. It is the most widely used tool for predicting PU risk in the United States, and contains 6 predominantly skin-related criteria, namely, sensory perception, moisture, activity, mobility, nutrition, and friction & shear. Despite its widespread use, our studies found that while Braden scale is sensitive, its accuracy is considered insufficient (0.672 AUC) for identifying patients at risk for developing PUs in ICU settings [5, 6].
Besides the characteristics used in Braden scale, medica-tions such as vasopressor agents are often administered in ICU to increase blood pressure for patients in hypotension caused from shock states. Some studies have found that vasopressor agents were statistically significant for the de-velopment of PUs in ICU settings [7, 8]. However, other studies did not find a conclusive relationship between vaso-pressor agents and PU development [9–11]. Separately, comorbid conditions such as hypertension, spinal cord in-jury, respiratory disease, vascular disease, and diabetes mel-litus have also been found to increase risk of PU development [12–15]. Thus, there is a need for identifying medications and diagnoses as factors for PUs. This issue motivates us to also examine medications and diagnoses as indicators of PU incidence.
Bayesian network
A practical problem with the use of medication and diag-nosis data is that they are embedded in electronic health records (EHRs). EHRs consist of rich and comprehensive patient-specific information from a large number of sources in different formats consisting of heterogeneous data types. Even when expertly extracted out into features,
many of the features (e.g. flu and high body temperature) violate the assumption of independence required by most machine learning models. Bayesian network models, on the other hand, take into account these interactions be-tween variables and eliminate interactions bebe-tween vari-ables that fail a dependence test, while retaining more important ones.
A Bayesian network is naturally suited to represent dependent relationships between variables. Nodes in a Bayesian network represent features from the data, and edges represent dependencies between those features. Bayesian networks are interpretable, which is critical for cli-nicians who need a parsimonious view of probable causal factors pertaining to diseases. Bayesian networks have been applied to effectively assist users in identifying faulty net-work structures and model discrepancies [16], and to depict the underlying uncertainty and facilitate contextual under-standing in clinical practice guidelines [17]. They have also been utilized for investigating complex phenotype data, specifically for the visualization of complex associations [18], the dependency structure of data, the reduction of di-mensionality and comparison of substructures, and the esti-mation of causal effects from data [19]. In addition, a Bayesian network has been used to predict mortality, re-admission, and length of stay in real time using EHR data to improve quality of care in the emergency unit [20].
In this paper we construct Bayesian networks from fea-tures of ICU patients in order to predict PU incidence and better understand the structure of related features. Specific-ally, we estimate the value of a hidden node (PU), given the values of the observed nodes (Braden scale, medication, and diagnosis features). After constructing the Bayesian network, we perform inference to estimate the risk that pa-tients will develop PUs during hospitalization. We find that on our ICU data, Bayesian network models have compar-able overall performance to, but higher sensitivity than, models constructed from classical machine learning algo-rithms such as logistic regression [6]. A beneficial “ bypro-duct” of Bayesian network modeling is that a feature dependency graph structure is learned. From this feature relationship graph, high risk factors associated with PU in-cidence in ICU settings can be directly identified using the Markov blanket property of the Bayesian network’s PU node [21].
tumors from a significant set of meta-analysis genes [22] and single nucleotide polymorphism (SNP) biomarkers significantly associated with Alzheimer’s disease [23]. Markov blanket property along with the Tabu search algo-rithm has been used to predict postoperative morbidity of heart disease [24].
Our contributions in this paper are the following. We evaluate our three-stage framework for predictive analysis with Bayesian networks, on one of the largest datasets de-veloped for PU predictive analysis, which includes 86 medi-cation, diagnosis, and Braden features extracted from the EHRs of 7,717 ICU patients. We evaluate multiple runs of all combinations of four search algorithms, two prior struc-ture initializations, two scoring functions, and five sets of features, and find that the best combination gives Bayesian networks with an average AUC of 0.827, which is compar-able to the best classical machine learning models from our previous study [6]. We visualize a representative Bayesian network and use the Markov blanket property to identify several known and several suspected high risk factors asso-ciated with PU incidence. Our clinician collaborators used this information to identify strong relationships between risk factors widely recognized as associated with pressure ulcers.
For our data the Bayesian network based approach yields models with much higher sensitivity than the classical ma-chine learning models (average sensitivity increased to 0.455 from 0.160). Meanwhile, there is only a slight sacrifice in specificity (average specificity is 0.908 versus 0.990) and no significant difference in overall accuracy (measured in AUC). Given the strong adverse impact of PU on patients and high cost for treating PU compared to taking prevent-ive measures, high sensitivity of the model is preferred, be-cause patients likely to contract PUs are likely to be predicted positive.
In summary, we demonstrate that Bayesian network method is a powerful tool in inferring predictive models for syndromes such as PU from complex clinical data. Not only can it lead to high sensitivity models, but it also en-ables development of new hypotheses on potential risk factors.
Methods
Dataset
The settings of this study are three adult ICUs at The Ohio State University Wexner Medical Center (OSUWMC). OSUWMC serves as a major referral center for patients from the entire state of Ohio and throughout the Midwest. The ICUs include 83 beds in total, admitting approximately 3,800 patients annually.
Essentris©is the commercial system used for documtation in all ICUs at the medical center. Patient data en-tered into Essentris© are eventually transferred to the information warehouse (IW). The IW compiles EHR data
from the various electronic records systems throughout OSUWMC, namely, an administrative system (ADT©), a laboratory system, a computerized provider order entry (CPOE) system, and a billing system. Figure 1 shows the study procedure. Specific details will be described in the following sections.
Data extraction
Patients (age≥18) admitted to ICUs between January 1, 2007 and December 31, 2010 comprise the sample set. Institutional Review Board (IRB) approval was obtained in 2010 for the data extraction. Data were de-identified and supplied by IW staff. Patients developing a PU are identified by reviewing discharge diagnoses appropriately coded with the International Classification of Diseases (ICD)-9 codes [25] as one of the fields in EHR system. For instance, if a patient had an ICD-9 code, 707.07 (Pressure ulcer, Heel), the patient is included in the PU group. On the other hand, if a patient does not have any of the ICD-9 codes indicating PUs, the patient is in-cluded in the non-PU group.
Data cleaning and preparation
Data cleaning and preparation processes include sev-eral steps. First, patients who are afflicted with a PU at the time of admission are excluded. In addition, patients whose ICU stay is shorter than 36 hours are excluded since PUs generally develop after 3 days of admission [26]. Second, if a patient had multiple hos-pitalizations during the study period, only the first hospitalization record is included. Similarly, if a pa-tient has more than one ICU admission record during the hospitalization, only the first ICU admission rec-ord is included for analysis. This is because our ob-jective is to find risk factors of patients who have the first incidence of PUs during their ICU stay. Patients who suffer from the onset of PUs at the time of ad-mission are excluded as they may have previously been exposed to unknown risk factors for which we have no data. This patient selection process is con-sistent with practices in our previous studies [5, 6].
Diagnostic data in the form of ICD-9 codes are 5 digits long and are extracted from the EHR system from re-cords within ICU length of stay. The first three digits in-dicate a main disease type and the last two provide additional information about the disease. Discharge diag-nostic ICD-9 codes are used to identify patients with maladies during ICU hospitalization. Subsequently, ICD-9 codes are truncated into 3 digits in order to analyze the primary conditions. Most of the 707 ICD-9 codes are considered PUs except for 707.1 (ulcer of lower limb), 707.8 (chronic ulcer of other specified sites), and 707.9 (chronic ulcer of unspecified site). Those codes are labeled as 707-nonPU.
Braden scale contains 6 subscales that measure sen-sory perception, moisture, activity, mobility, nutrition, and friction & shear. A Braden total score is simply cal-culated by adding up all the subscales. We consider each subscale separately to see which subscales are more re-lated to PU incidence in ICU settings. Moreover, most of the subscales have significant association with PU inci-dence, in addition to the summed Braden scale (Braden total subscale). We include these for consistency with previous work [27, 28].
Variable selection
In order to eliminate ill-defined, non-salient, and“noise” variables irrelevant to PUs, we select a set of medica-tions and diagnoses highly associated with the PU condi-tion. To achieve this aim, univariate analysis is first carried out to determine what medication categories and diagnoses (variables) are highly associated with PUs. For each variable, one of the following two statistical tests is used. A χ2 -test, being sensitive to small expected fre-quencies, is used only where expected frequencies are large enough (> = 20), otherwise Fisher’s Exact Test (FET) is applied. In the midst of this screening process, we do not apply multiple test compensation in order to be more inclusive.
Medication categories that appear to be significantly associated with PUs are retained. Likewise, diagnoses that appear to be highly associated with PUs (which we call having a strong “comorbidity association”) are retained. The retained medication categories, retained diagnoses, and all Braden features are used as variables (nodes) for Bayesian networks.
Bayesian network modeling
A Bayesian network model is introduced to model clin-ical data which is high dimensional in nature and char-acterized by variables of heterogeneous data types. Bayesian network models are graphs in which nodes rep-resent random variables, and the lack of edges reprep-resent conditional independence. Formally, Bayesian networks are defined as follows:
LetU= {x1,…,xn},n≥1 be a set of random variables. A Bayesian network B over U is a network structureBs in the form of a directed acyclic graph (DAG) overUand a set of probability assertions Bp= {Pr(u|Pa(u)), u∈U} wherePa(u) is a set of parents ofuinBs.
In this work, discrete-valued Bayesian networks are used. Therefore, probability models are represented with discrete conditional probability tables. There are two steps to constructing a Bayesian network: structure learning and parameter estimation. Structure learning extracts a Bayesian networkBsfrom observed data. Par-ameter estimation constructs the conditional probability distribution setUfor each node in the network once the structure has been learned.
Structure learning
around, and therefore escape, local optima. Tabu search [30] is a variation of greedy hill climbing which keeps a list of lengthLof recently used operations such as edge addition, deletion, and reverse. For each step, it does not consider operations in the list, forcing it to explore new directions in the search space. Simulated annealing is a different hill climbing variation which starts with an initially large “temperature” parameter. When the temperature is large, the algorithm may take steps which decrease the score. As the algorithm proceeds the temperature is grad-ually reduced, and the search increasingly focuses only on moves that improve the score.
Scoring functions
A scoring function is used with a search algorithm to approximate the probability of each candidate structure given the data D. The goal is to find a highest scoring structureBs*, that is:
B
s ¼ arg max
Bs Score Bð sjDÞ
Bayesian scoring function
The premise of the Bayesian scoring function is to com-pute the posterior distribution of a network from given data. The best network is the one that maximizes the posterior probability. A widely used Bayesian scoring function is the Bayesian Dirichlet with score equivalence and uniform priors (BDeu) proposed by Buntine [31]. BDeu assigns the same score to equivalent network structures and has a uniform prior distribution assumption. Therefore, BDeu has only one necessary hyper-parameter calledequivalent sample size. The BDeu scoring function is defined as follows:
BDeu BsjDð Þ ¼ logðPr Bsð ÞÞ þX n
i
Xqi
j
log Γ N0
qi
Γ NijþN0 qi
0 @
1 A
þXri k
log Γ Nijkþ N0 riqi
Γ N0 riqi
0 @
1 A 0
@
1 A
!
whereΓ(.) is the gamma function,nis the total number of variables,ri is the number of possible values of vari-ablexi(e.g., 2 for a binary variable), andqiis the number of possible values ofPa(xi).Nijkis the number of records in the data setD having variable xiin state kfor which
Pa(xi) has its j -th value. Nij is calculated by summing over all states of a variable xi:Nij¼ Pkri¼1Nijk.N
' is the user-specified equivalent sample size, which expresses how much prior knowledge should be taken into account in the network structure.
Information-theoretic scoring function
The premise of this scoring function is a tradeoff be-tween how well the network structure fits the data and how complex the network is. This can be viewed as a log-likelihood (LL) function along with a penalty factor to address the over-fitting problem. The log-likelihood function is the log probability of DgivenBs and can be calculated as:
LL Dð jBsÞ ¼ logðPr Dð jBsÞÞ
There are several well-known information-theoretic scoring functions. In this study, we consider minimum description length (MDL) (equivalent to Bayesian in-formation criterion (BIC) for Bayesian networks [29]) as it has been shown that it can outperform Akaike’s information criterion (AIC), Bayesian Dirichlet equiva-lence score (BDeu), and factorized normalized max-imum likelihood (fNML) [29]. MDL scoring function is defined as follows:
MDL Bsð ;DÞ ¼LL Dð jBsÞ−logN 2 j jBs
where |Bs| is the number of independent parameters in network Bs. The penalty factor can be viewed as the number of bits required to encode the model.
Parameter estimation
The conditional probability table for each variable in the network is created once the structure learning has been carried out. Direct estimates of the conditional probabil-ities are calculated for each node in the network struc-ture as follows:
Prðx¼kjPa xð Þ ¼jÞ ¼Nijk þN
0
ijk
NijþN0
ij
whereN'ijkis a parameter used for estimating the prob-ability tables and can be interpreted as the initial count on each value. When N'ijk= 1, N'ij=ri, assigning (in-stead of 0) a small prior to values unobserved in training data. With N'ijk= 0, maximum likelihood estimates are obtained.
Markov Blanket
An important concept underlying a Bayesian network is that of a Markov blanket of a node. The Markov blanket of a node is a set of nodes that shield the node from the rest of the network. This set contains the node’s parents, the node’s children, and all other parents of its children. Formally, letNbe the set of all nodes in a network and
a Bayesian network is conditionally independent of other variables not included in its Markov blanket. On the other hand, when the Markov blanket of a certain vari-able x is known, adding knowledge of other variables outside the Markov blanket leaves the probability of x unchanged [32]. This property is noteworthy since only variables in the Markov blanket are required to predict the behavior of the outcome variable. From this prop-erty, we can reduce the size of the model significantly.
Results
Patient demographics
A total of 7,717 ICU patients are included in the analysis. The number of patients in PU group is 590, while the number of patients in non-PU group is 7,127. Patient demographics are summarized in Table 1. In the patient cohort, 57.4% are male and 82.2% are ethnically classified as White. The mean age of the patients is 57.7 years and the mean length of ICU stay is 10.1 days.
Table 1 shows that gender and length of ICU stay are statistically significant factors influencing PU develop-ment. However, clinicians are already attuned to the re-lationship between length of ICU stay or hospitalization and PU incidence. Consequently, we are looking for non-obvious relationships that could be related to PU occurrence such as medications and diagnoses.
Medication variable selection
Medications that are used for patients in PU and non-PU groups during the ICU stay are listed. In total, 828 unique medications are administered to the patients in our study. Our research team including a registered nurse, two ICU clinical nurse specialists, and a dietician, reviewed all of the 828 medications. Through the afore-mentioned man-ual review, medications are grouped into 72 categories. From the list of medications, categories whose frequency is less than 10 are removed as they are not considered significant for the univariate analysis. Additionally,
“Electrolytes”,“IV Fluid”,“Research Drugs”, and “ Miscel-laneous”categories are removed as they do not appear to be clinically meaningful. As a result, 49 categories are retained and used for univariate analysis. In general, the association of individual medication category with PU is
not strong; only 18 medication categories are found to be significantly associated with PUs at a significance level of 90% (i.e.,α= 0.1). We applied a relatively loose threshold for α without multiple test compensation in order to be more inclusive in the initial screening stage.
Comorbidity association
There are 832 main discharge diagnoses after collapsing the ICD-9 codes to three digits. We construct the co-morbidity association in the same manner as the medi-cation variables are selected by removing diagnoses whose frequency is less than 10. Retained conditions are qualified by χ2statistic greater than 20 (i.e., significance level α= 0.001), resulting in 61 comorbid conditions highly associated with PUs.
Bayesian networks
We conducted experiments to compare the performance of four search algorithms: greedy hill climbing, repeated hill climbing, Tabu search, and simulated annealing; two scoring functions: BDeu and MDL; two structure initiali-zations: empty network and naïve Bayes; and five sets of features: Braden (B), medication (M), diagnosis (D), Braden & diagnosis (BD), and Braden & medication & diagnosis (BMD). All features except Braden are binary. Sensitivity (SENS), Specificity (SPEC), and Area Under the Curve (AUC) are used as metrics for purposes of comparison. We performed 100 trials of each experi-ment and report the average and standard deviation of SENS, SPEC, and AUC. In terms of the search al-gorithms, Tabu search outperforms most of results from greedy hill climbing, repeated hill climbing, and simulated annealing. The running time of repeated hill climbing is often long and yields poor results. Among scoring functions, BDeu performs better than MDL in hill climbing and repeated hill climbing algo-rithms, but both scoring functions are comparable in performance when used with Tabu search. In general, BDeu is very sensitive to the equivalent sample size parameter, and selecting an appropriate value can be challenging [29, 33]. We found that BDeu with a lar-ger equivalent sample size parameter performs better than with the smaller one. Regardless of the search
Table 1Demographics of ICU patients (N= 7717)
Variable Total PU group (N= 590) Non-PU group (N= 7127) Statistic pvalue
Gender, freq (%) Male 4426 378 (64.1%) 4048 (56.8%) x2¼1:9 <.001
Female 3291 212 (35.9%) 3079 (43.2%)
Race/Ethnicity, freq (%) White 6345 469 (79.5%) 5876 (82.4%) x2¼3:15 .076
Non-white 1372 121 (20.5%) 1251 (17.6%)
Age (years), mean (SD) 57.7 (15.9) 59.0 (15.5) 57.6 (16) t = 4.52 .034
Length of ICU stay (days), mean (SD) 10.1 (10) 13.4 (14.3) 9.8 (9.6) t = 70.56 <.001
algorithms and scoring functions, using naïve Bayes to create the initial outperforms the performance of the Bayesian networks initialized with empty net-works. In terms of feature sets, Braden & diagnosis gives the best average AUC, which is consistent with our previous study [6].
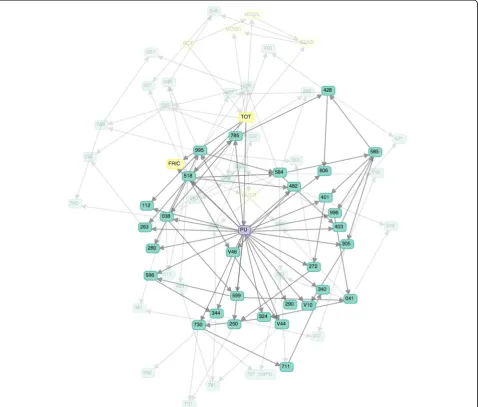
Figure 2 shows a representative Bayesian network of Braden & diagnosis feature set from the 100 trials. The learned network consists of 69 nodes, each of which cor-responds to a Braden subscale or diagnosis feature. The middle node labeled “PU” is a pressure ulcer diagnosis. The 32 highlighted nodes are the Markov blanket of PU (see Section Methods). In the Markov blanket of PU, there are 2 Braden subscales: total score and friction & shear. The other nodes represent diagnoses in form of ICD9 codes.
Evaluation
A natural way to measure Bayesian network perform-ance is to predict unobserved data. The data were ran-domly split into 2 sets: training (67%) and validating (33%) sets for 100 trials. The Bayesian network structure is learned from each training dataset. Sensitivity (SENS), Specificity (SPEC), Positive Predictive Value (PPV), Negative Predictive Value (NPV), and Area Under the Curve (AUC) are computed for each trial. Table 2 shows average predictive performance of each measure (row), where for each feature set (column) we use the best per-forming (as measured by AUC) combination of search algorithm, scoring function, and structure initialization, as reported below. The M feature set gives the lowest average AUC, 0.619 i.e., lower than the baseline (B). The D and BMD feature sets give fairly good average AUC,
0.810 and 0.819, respectively. The highest average AUC, 0.827, is from the BD feature set.
We observed similar results in our previous study [6] in which the same sets of performance measures and fea-tures were evaluated on six different machine learning algorithms: linear regression, naïve Bayes, decision tree,
k-nearest neighbor, random forest, and support vector machine.
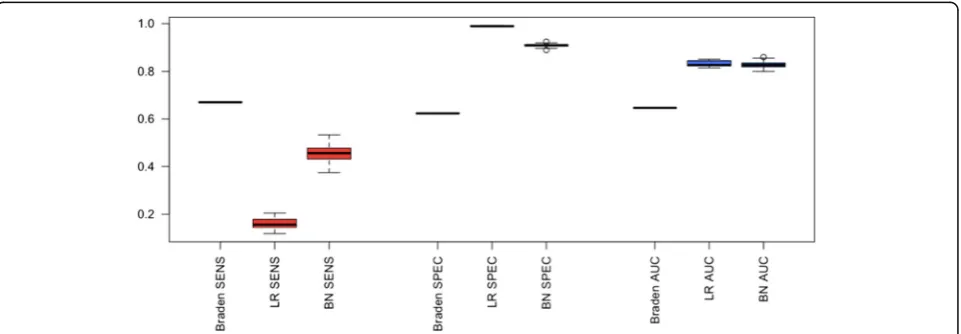
We next study how our Bayesian network modeling per-forms against logistic regression (LR). We compare to LR because in our previous work [6], LR performed best among six machine learning models including SVM and random forest, and is simpler to tune. Three performance measures are used: sensitivity, specificity, and AUC. We compare 3 experiments: 1) a baseline method (“Braden”) which, mimicking a standard clinical assessment tool, thresholds a single Braden total subscale at 13, which maximizes AUC [5]; 2) Logistic regression (“LR”) on BD features; and 3) Bayesian network (“BN”) on BD features. We use BD features for the latter two because it gave the best AUC in our earlier performance study.
Figure 3 shows a box plot of our performance mea-sures for these 3 experiments. The Braden baseline gives balanced, almost equal, sensitivity and specificity (0.670 and 0.623, respectively). While it maximizes AUC, it
does so based solely on the single Braden total subscale feature. As a result, its AUC (0.647) is much lower than the other two, more complex models, demonstrating the limitations of using only one feature. For the other two experiments, in terms of AUC our Bayesian network model gives comparable performance to logistic regres-sion (0.827 vs. 0.830). While Bayesian network has a slightly lower specificity (0.908 vs. 0.990), it also has almost three times the sensitivity (0.455 vs. 0.160). In other words, our Bayesian network model nearly triples the sensitivity at the cost of a slightly lower –although still high in absolute terms - specificity, while overall performance (AUC) remains comparable. We find this result promising because treating PU incidence is very costly while preventive measures are not. From the per-spective of cost and patient quality of life, it is important to have high sensitivity to predict the patients who may develop a PU.
Lastly, we evaluate the scalability of Bayesian network learning, in terms of both number of features and number of records (patients). We took the best performing feature set, Braden and diagnosis (BD features) and created a lar-ger 136 feature dataset from it by duplicating each of BD’s 68 features, and an even larger 204 feature dataset by triplicating BD’s features. Figure 4 shows the runtime of
Table 2Performance measures: mean (standard deviation) of Bayesian networks in five different feature sets: Braden (B), Medication (M), Diagnosis (D), Braden & Diagnosis (BD), and Braden & Medication & Diagnosis (BMD)
Ba Ma Da BDb BMDb
SENS 0.021 (0.034) 0.002 (0.003) 0.315 (0.027) 0.455 (0.034) 0.478 (0.025)
SPEC 0.996 (0.006) 0.999 (0.001) 0.939 (0.005) 0.908 (0.006) 0.895 (0.007)
PPV 0.146 (0.201) 0.238 (0.385) 0.301 (0.022) 0.292 (0.184) 0.274 (0.015)
NPV 0.924 (0.002) 0.923 (0.001) 0.943 (0.002) 0.953 (0.003) 0.954 (0.002)
AUC 0.731 (0.018) 0.619 (0.016) 0.810 (0.012) 0.827 (0.011) 0.819 (0.011)
a
MDL scoring function, Tabu search and naïve Bayes prior structure
b
MDL/BDeu scoring functions give the same result, Tabu search, and naïve Bayes prior structure
Bayesian network learning using greedy hill climbing and Tabu search algorithms. The runtime increases more sig-nificantly in larger number of features, which reinforces the importance of feature selection in our framework. To evaluate the scalability in terms of number of records, starting with BD, we created a 15,434 record dataset by duplicating each patient in BD, and an even larger 23,151 record dataset by triplicating each patient in BD. Figure 5 shows that the runtime for both greedy hill climbing and Tabu search increases only slightly more than linearly with the number of records. This suggests that Bayesian net-work learning can handle datasets with a moderate to large number of patients.
Discussion
Four years of ICU EHR data are extracted from the in-formation warehouse. We focus on patients who contracted PUs during their first ICU stay. Specifically, we select only the first hospitalization and filter out later hospitalizations to make sure that there is no impact from the previous PU incidence on the current hospitalization. Medications, diagnoses, and Braden features are used to de-velop predictive models, and univariate statistical analyses are carried out to reduce the number of model variables. A Bayesian network modeling approach is employed and we
evaluate combinations of different scoring functions, search algorithms, and structure initialization methods for Bayesian networks. Compared to the best of a number of classical machine learning algorithms, the resulting Bayesian network model nearly triples model sensitivity at only a slight cost to specificity, while overall performance (AUC) remains high. High sensitivity is important in posi-tively predicting patients who may develop a PU, as early intervention can be far less costly than treatment. The Bayesian network approach also provides an interpretable structure, allowing clinicians to understand, discuss, valid-ate, and explain the logic behind the model. We select the risk factors highly associated with PUs using the Markov blanket property of the PU node. This approach reduces the number of PU risk factors and provides a more concise set of strong factors to clinicians for validation.
Our clinician collaborators identified many of the rela-tionships depicted in Fig. 2 consistent with domain know-ledge and clinical observations. For instance, it was obvious to them that ICD-9 main code 250 (Diabetes mel-litus) is strongly related to PU incidence due to vascular circulation issues and (frequent) obesity associated with Diabetes. They also confirmed that many of the patients afflicted with disease code ICD-9 main code 806 (spinal cord injury) are very likely to contract PUs. The ICD-9 main code 995 (adverse effects) appearing as a child node of PU required more thought on their part. They realized that 995 appears as a child of PU because most PU patients in our data suffer from specific adverse effects of Sepsis (995.91) and Systemic Inflammatory Response Syndrome (SIRS, 995.9). In other words, non-obvious relationships in the data are gleaned from the Bayesian network.
Figure 2 can also be used to help confirm suspected associations. For instance, several studies show that PUs in diabetic patients often occur on extremities [34, 35]. Figure 2 shows an edge from PU to 250 (Diabetes melli-tus). Other Fig. 2 associations include between PU and maladies of kidney (codes 403, 584, and 585), and car-diovascular issues (codes 428 and 785). Once again, both observations are consistent with findings from previous studies [28, 36]. Septicemia or sepsis (995 and 038) and respiratory failure (528 and 482) have been identified earlier as risk factors [37]. Further, we confirm that spinal cord injury (806), infection of the bone (324 and 730), and dementias (290) are also some of the risk factors of PUs as identified elsewhere [38–40].
Of the six Braden subscales, Braden total score and friction & shear appearing in the Markov blanket of the PU node indicate that they are the two most significant. Other Braden subscales i.e., activity, nutrition, mobility, sensory perception, and moisture are not as useful since they are more likely to have similar values for most ICU patients. ICU patients are likely to be sedate and in bed Fig. 4Scalability: Number of features
rest. Unsurprisingly, most diagnoses highly associated with PU incidence involve patients’immobility including paralytic syndromes, spinal cord injuries, machine or de-vice dependence, infections including sepsis and urinary tract infection, or imperceptions including dementias. In short, clinicians can benefit from the predictive model which helps them better understand the risk factors, leading to allocation of preventive measures and evidence-based risk assessment.
There are limitations pertaining to our study. The data are from a single institution; thus, interpretation of the finding is limited. The predictive models are constructed based solely on the data from EHRs and our data do not contain APACHE-II score, a severity of disease classifica-tion system. Consequently, we are unable to adjust for se-verity of illness, nor is sese-verity of illness used as a predictor or PUs. The predictive models do not consider longitudinal analysis since temporal modeling would sig-nificantly complicate both the learning process and inter-pretation. We did not directly evaluate the robustness of learned Bayesian networks, for instance using different network similarity measures, parameter combinations, and perturbation models. As each of these variations de-serves careful attention, we leave a comprehensive evalu-ation of the robustness of learned Bayesian networks as future work. Finally, the predictive power and risk factors of pressure ulcer incidence in this study are only based upon Braden scale, discharge diagnoses, and medication data.
Conclusions
In this work we develop predictive models to help clinicians improve patient care. Motivated to assist clinicians, necessi-tating the use of an intuitive and interpretable model, we select Bayesian networks to serve our purpose. We present a three-step framework for predictive analysis of patient clinical data, consisting of data preprocessing, feature selec-tion, and model construction. We apply our framework specifically to pressure ulcers in ICU settings, where we consider 86 diagnosis, medication, and Braden scale fea-tures extracted from a dataset of 7,717 patient EHRs.
We evaluate all combinations of Bayesian network models from four search algorithms, two prior structure initializations, two scoring functions, and five sets of fea-tures. Our model gives comparable overall performance to the best of classical machine learning algorithms, while nearly tripling sensitivity at only a slight cost to specificity with no sacrifice on high overall accuracy. We consider this promising since high sensitivity can better facilitate preventive care in patients likely to contract PU, which is less costly than treatment. From a qualita-tive standpoint, our clinician collaborators identified strong relationships between risk factors widely recog-nized as associated with pressure ulcers. These include
cardiovascular, kidney, lung, spinal cord, bladder, bone issues or infections, dementias, diabetes, malnutrition, sepsis, friction & shear, and Braden total score. Identify-ing accurate risk factors of PUs is a key to comprehend disease burden and to improve pressure ulcer care. Our clinical collaborators found the Bayesian model useful in identifying dependencies between pressure ulcers and risk factors consistent with their own experience.
Abbreviations
ADT©:Administrative System; AIC: Akaike’s Information Criterion; AUC: Area Under the Curve (Receiver operating characteristic); B: Braden feature; BD: Braden & diagnosis feature set; BDeu: Bayesian Dirichlet with score equivalence and uniform priors; BIC: Bayesian Information Criterion; BMD: Braden & Medication & Diagnosis feature set; BN: Bayesian Network; CPOE: Computerized Provider Order Entry; D: Diagnosis feature set; EHRs: Electronic Health Records; FET: Fisher’s Exact Test; fNML: factorized Normalized Maximum Likelihood; ICU: Intensive Care Unit; IW: Information Warehouse; LR: Logistic Regression; M: Medication feature set;
MDL: Minimum Description Length; NPV: Negative Positive Value; OSUWMC: The Ohio State University Wexner Medical Center; PPV: Predictive Positive Value; PU: Pressure Ulcer; SD: Standard Deviation; SENS: Sensitivity; SNP: Single Nucleotide Polymorphism; SPEC: Specificity
Acknowledgements
We would like to thank Tara Payne, Marcia Belcher, and Information Warehouse staff for their assistance with data extraction.
Funding
This work was supported by grant UL1RR025755 from the National Center For Research Resources. The publication costs are being covered by startup fund for KH from Department of Biomedical Informatics and discretionary fund for RM from Department of Computer Science and Engineering at The Ohio State University.
Availability of data and materials
The authors do not wish to make the data available as it contains information that could identify specific individuals.
Authors’contributions
RM and KH contributed to the study’s conception and design, revision of manuscript, and accordance of final approval. PK contributed to the study’s conception, conducted data cleaning and various experiments, and drafted the manuscript. CN and BV contributed to data cleaning and interpretation, and interpretation of results. SH provided the study’s conception and contributed to manuscript revision. All the authors read and approved the final version on the manuscript.
Competing interests
The authors declare that they have no competing interests.
Consent for publication Not applicable.
Ethics approval and consent to participate
Approval for the data extraction was obtained from the institutional review board of The Ohio State University.
About this supplement
Publisher’s Note
Springer Nature remains neutral with regard to jurisdictional claims in published maps and institutional affiliations.
Author details
1Department of Computer Science and Engineering, The Ohio State University, Columbus, Ohio, USA.2Department of Critical Care Nursing, The Ohio State University Wexner Medical Center, Columbus, Ohio, USA.3College of Nursing, The Ohio State University, Columbus, Ohio, USA.4Department of Health Services Nursing Education, The Ohio State University Wexner Medical Center, Columbus, Ohio, USA.5College of Nursing, Pusan National University, Busan, South Korea.6Department of Biomedical Informatics, The Ohio State University, Columbus, Ohio, USA.
Published: 5 July 2017
References
1. European Pressure Ulcer Advisory Panel and National Pressure Ulcer Advisory Panel. Prevention and treatment of pressure ulcers: quick reference guide 2009. http://www.npuap.org/. Accessed 29 Nov 2016.
2. VanGilder C, Amlung S, Harrison P, Meyer S. Results of the 2008–2009 international pressure ulcer prevalence survey and a 3-year, acute care, unit-specific analysis. Ostomy Wound Manage. 2009;55(11):39–45.
3. Reddy M, Gill SS, Kalkar SR, Wu W, Anderson PJ, Rochon PA. Treatment of pressure ulcers: a systematic review. JAMA. 2008;300(22):2647–62. 4. Berman A, Snyder S. Kozier & Erb’s Fundamentals of Nursing: Concepts,
Process, and Practice. 8th ed. Upper Saddle Riveer: Pearson Education; 2008. p. 905–7.
5. Hyun S, Vermillion B, Newton C, Fall M, Li X, Kaewprag P, Moffatt-Bruce S, Lenz ER. Predictive validity of the Braden scale for patients in intensive care units. AJCC. 2013;22(6):514–20.
6. Kaewprag P, Newton C, Vermillion B, Hyun S, Huang K, Machiraju R. Predictive modeling for pressure ulcers from intensive care unit electronic health records. AMIA Jt Summits Transl Sci Proc. 2015;2015:82–86. 7. Alderden J, Whitney JD, Taylor SM, Zaratkiewicz S. Risk profile characteristics
associated with outcomes of hospital-acquired pressure ulcers: a retrospective review. Crit Care Nurse. 2011;31(4):30–43.
8. Frankel H, Sperry J, Kaplan L. Risk factors for pressure ulcer development in a best practice surgical intensive care unit. Am Surg. 2007;73(12):1215–7. 9. Slowikowski GC, Funk M. Factors associated with pressure ulcers in patients
in a surgical intensive care unit. J Wound Ostomy Continence Nurs. 2010; 37(6):619–26.
10. Kaitani T, Tokunaga K, Matsui N, Sanada H. Risk factors related to the development of pressure ulcers in the critical care setting. J Clin Nurs. 2010; 19(3–4):414–21.
11. Eachempati SR, Hydo LJ, Barie PS. Factors influencing the development of decubitus ulcers in critically ill surgical patients. Crit Care Med. 2001;29(9): 1678–82.
12. Liu P, He W, Chen HL. Diabetes mellitus as a risk factor for surgery-related pressure ulcers. J Wound Ostomy Cont Nurs. 2012;39(5):495–9. 13. Guihan M, Bombardier CH. Potentially modifiable risk factors among
veterans with spinal cord injury hospitalized for severe pressure ulcers: a descriptive study. J Spinal Cord Med. 2012;35(4):240–50.
14. Price MC, Whitney JD, King CA, Doughty D. Development of a risk assessment tool for intraoperative pressure ulcers. J Wound Ostomy Cont Nurs. 2005;32(1):19–30. quiz 31–2.
15. Whittington KT, Briones R. National prevalence and incidence study: 6-year sequential acute care data. Adv Skin Wound Care. 2004;17(9):490–4. 16. Michele Cossalter, Ole J. Mengshoel, and Ted Selker. Visualizing and
understanding large-scale Bayesian networks. The AAAI-11 Workshop on Scalable Integration of Analytics and Visualization. 2011;WS-11-17:12–21. 17. Zheng H, Kang B, Kim H. An ontology-based bayesian network approach for
representing uncertainty in clinical practice guidelines. Uncertain Reasoning Seman Web. 2008;5327:161–73.
18. Strobl R, Stucki G, Grill E, Muller M, Mansmann U. Graphical models illustrated complex associations between variables describing human functioning. J Clin Epidemiol. 2009;62(9):922–33.
19. Kalisch M, Fellinghauer BAG, Grill E, Maathuis MH, Mansmann U, Bühlmann P, et al. Understanding human functioning using graphical models. BMC Med Res Methodol. 2010;10:14.
20. Cai X, Perez-Concha O, Coiera E, Martin-Sanchez F, Day R, Roffe D, Gallego B. Real-time prediction of mortality, readmission, and length of stay using electronic health record data. J Am Med Inform Assoc. 2016;23(3):553–61. 21. Judea P. Probabilistic reasoning in intelligent systems: networks of plausible
inference. Representation and Reasoning Series. San Mateo: Morgan Kaufmann; 1988.
22. Kunkel BW, Yoo C, Roy D. Reverse Engineering of Modified Genes by Bayesian Network Analysis Defines Molecular Determinants Critical to the Development of Glioblastoma. PLoS One. 2013;8(5):e64140.
23. Sherif FF, Zayed N, Fakhr M. Discovering alzheimer genetic biomarkers using bayesian networks. Adv Bioinformatics. 2015;2015:639367.
24. Hsieh NC, Hung LP, Shih CC, Keh HC, Chan CH. Intelligent Postoperative Morbidity Prediction of Heart Disease Using Artificial Intelligence Techniques. J Med Syst. 2012;36(3):1809–20.
25. Searchable online version of the 2009 ICD-9-CM. http://icd9.chrisendres.com/. Accessed 29 Nov 2016.
26. Carlson VE, Kemp GM, Shott S. Predicting the risk of pressure ulcers in critically ill patients. AJCC. 1999;8(4):262–9.
27. Cox J. Predictors of pressure ulcers in adult critical care patients. Am J Crit Care. 2011;20(5):364–75.
28. Bours GJ, De Laat E, Halfens RJ, Lubbers M. Prevalence, risk factors and prevention of pressure ulcers in Dutch intensive care units. Results of a cross-sectional survey. Intensive Care Med. 2001;27(10):1599–605. 29. Liu Z, Malone B, Yuan C. Empirical evaluation of scoring functions for
Bayesian network model selection. BMC Bioinf. 2012;13 Suppl 15:S14. 30. Teyssier M, Koller D. Ordering-based search: a simple and effective
algorithm for learning Bayesian networks. UAI, 2005:584–590 31. Buntine W. Theory refinement on Bayesian networks. UAI. 1991:52–60 32. Korb KB, Nicholson AE. Bayesian Artificial Intelligence. 2nd ed. Boca Raton:
CRC Press, Taylor & Francis Group; 2004;365.
33. Heckerman D, Geiger D, Chickering DM. Learning Bayesian networks: The combination of knowledge and statistical data. Mach Learn. 1995;20(3):197–243. 34. Brem H, Jacobs T, Vileikyte L, Weinberger S, Gibber M, Gill K, Tarnovskaya A,
Entero H, Boultion AJ. Woundhealing protocols for diabetic foot and pressure ulcers. Surg Technol Int. 2003;11:85–92.
35. Sumpio BE. Contemporary evaluation and management of the diabetic foot. Scientifica. 2012;2012:435487. doi:10.6064/2012/435487.
36. Tayyib N, Coyer F, Lewis P. Saudi Arabian adult intensive care unit pressure ulcer incidence and risk factors: a prospective cohort study. Int Wound J. 2016; 13(5):912–9.
37. Delmore B, Cox J, Rolnitzky L, Chu A, Stolfi A. Differentiating a pressure ulcer from acute skin failure in the adult critical care patient. Adv Skin Wound Care. 2015;28(11):514–24.
38. Krishnan S, Karg P, Boninger M, Vodovotz Y, Constantine G, Sowa G, Brienza D. Early detection of pressure ulcer development following traumatic spinal cord injury using inflammatory mediators. Arch Phys Med Rehabil. 2016; 97(10):1656–62.
39. Jugun K, Richard JC, Lipsky BA, Kressmann B, Pittet-Cuenod B, Suvà D, Modarressi A, Uçkay I. Factors associated with treatment failure of infected pressure sores. Ann Surg. 2016;264(2):399–403.
40. Woo KY, Sears K, Almost J, Wilson R, Whitehead M, VanDenKerkhof EG. Exploration of pressure ulcer and related skin problems across the spectrum of health care settings in Ontario using administrative data. Int Wound J. 2017; 14(1):24–30.
• We accept pre-submission inquiries
• Our selector tool helps you to find the most relevant journal
• We provide round the clock customer support
• Convenient online submission
• Thorough peer review
• Inclusion in PubMed and all major indexing services
• Maximum visibility for your research
Submit your manuscript at www.biomedcentral.com/submit