R E S E A R C H A R T I C L E
Open Access
Construct validation of patient global impression
of severity (PGI-S) and improvement (PGI-I)
questionnaires in the treatment of men with
lower urinary tract symptoms secondary to
benign prostatic hyperplasia
Lars Viktrup
*†, Risa P Hayes
†, Ping Wang
†and Wei Shen
Abstract
Background:Lower urinary tract symptoms (LUTS) in aging men are often associated with benign prostatic hyperplasia (BPH). While regulatory evaluations of treatment benefit require an assessment of specific symptoms, a simpler approach to measuring patients’ perceptions of severity and symptom change may be particularly useful for clinical practice. The aim of this study was to provide evidence of the validity of the 1-item Patient Global Impression of Severity (PGI-S) and Improvement (PGI-I) questionnaires for use as outcome measures in the treatment of BPH-LUTS.
Methods:This was a secondary analysis of data from 4 randomized placebo-controlled 12-week trials evaluating tadalafil for the treatment of BPH-LUTS (N=1694). Visit 2 (V2 [beginning of a 4-week placebo lead-in period]) and endpoint assessments included International Prostate Symptom Score (IPSS), IPSS Quality of Life Index (IPSS-QoL), BPH Impact Index (BII), and peak urine flow (Qmax). PGI-S was only administered at V2 and PGI-I only at endpoint. Associations between the PGI-S or the PGI-I and the other assessments were analyzed by calculating Spearman rank correlation coefficients and performing analysis of variance (ANOVA).
Results:Spearman correlation coefficients were 0.43, 0.43, 0.53, and−0.09, between the PGI-S and IPSS, IPSS-QoL, BII, and Qmax baseline results (all P<0.001). Similar results were seen across race, ethnicity, and baseline severity (moderate LUTS versus severe LUTS). IPSS, IPSS-QoL, BII baseline scores (P <0.001) and Qmax values (P=0.003) were significantly different among the 4 PGI-S severity levels. Spearman correlation coefficients were 0.56, 0.53, 0.47 and −0.15 between the PGI-I and change in IPSS, IPSS-QoL, BII scores, and Qmax values from baseline to endpoint (all P<0.001). Similar results were seen across race, ethnicity, and baseline severity. Change in IPSS, IPSS-QoL, BII scores, and Qmax values (P<0.001) were significantly different among the PGI-I levels (i.e., patient perception of change in urinary symptoms).
Conclusions:This study demonstrated patients’overall perceptions of their severity and change in BPH-LUTS can be captured in a way that is simple, valid, and easily administered in a research setting or clinical practice. Clinical parameters are weakly associated with patients’perception of urinary symptoms, emphasizing the importance of a patient-reported assessment in the evaluation of BPH-LUTS treatment benefit.
Keywords:Patient global impression scale, Lower urinary tract symptoms, Construct validity
* Correspondence:[email protected]
†Equal contributors
Lilly Research Laboratories, Eli Lilly and Company, Indianapolis, IN 46285, USA
Background
Lower urinary tract symptoms (LUTS), often associated with benign prostatic hyperplasia (BPH), are common in aging men worldwide with a severity that seems to be similar across countries [1]. Symptoms may belong to 1 of 3 domains: voiding (obstructive) symptoms which in-clude slow stream, splitting/spraying of stream, intermit-tency, hesitancy, straining, and terminal dribble; storage (irritative) symptoms which include frequency, nocturia, urgency, and incontinence; and postmicturition symp-toms which include feeling of incomplete emptying and postmicturition dribble [2]).
Several validated questionnaires have been developed in collaboration with The American Urology Association (AUA) to assess the severity and treatment effect in men with BPH-LUTS. One such instrument is the International Prostate Symptom Score (IPSS) which is commonly used to assess therapeutic efficacy of BPH therapy [3,4] and has been translated into multiple languages. The IPSS QoL Index is an additional question usually included at the end of the IPSS questionnaire, though not part of the total IPSS score [5]. The AUA committee also developed the BPH Impact Index (BII) to assess the impact of LUTS sug-gestive of BPH on patient health and functioning [4]. The BII has recently been further validated based on several tadalafil clinical studies [6,7]. While the IPSS question-naire is accepted as a critical component in BPH-LUTS research, the IPSS-QoL and BII (assessments of symptom burden and impact) are less frequently used.
In light of the need for a simple and easy-to-use vali-dated questionnaire to assess patients’ overall perception of their condition, the Patient’s Global Impressions of Se-verity (PGI-S) and Patient’s Global Impressions of Improve-ment (PGI-I) questionnaires were included in several tadalafil BPH-LUTS clinical studies conducted worldwide. The PGI-S and PGI-I respectively are 1-item questionnaires that ask an individual patient to rate the severity of a spe-cific condition (single-state scales) at baseline and or to rate at endpoint the perceived change in his/her condition in response to therapy (transition scales) [8,9]. These types of measures have been implemented and/or validated in clinical studies of patients with stress incontinence [9], urogenital prolapse [10] and other non-urological diseases [11]. The aim of this study was to provide evidence that supports the validity of these two 1-item questionnaires for LUTS suggestive of BPH by correlating them with other subjective and objective measures of symptom severity or changes in severity in tadalafil placebo-controlled studies.
Methods
Study design and participants
This was a secondary analysis of data from 4 clinical trials. Details of the study designs and populations have previously been published [12-15].
Study 1 (LVHJ) was a randomized, double-blind, pla-cebo-controlled, parallel-design multinational study to evaluate the efficacy and safety of daily tadalafil 5 mg once daily for 12 weeks. Study participants were men with LUTS secondary to BPH (BPH-LUTS) residing in Argentina, Germany, Italy, Mexico, or the United States (Clinicaltrials.gov: NCT00827242 [12]).
Study 2 (LVHR) was a randomized, double-blind, 3-group, placebo-controlled, parallel-design, multinational study to evaluate the efficacy and safety of tadalafil 2.5-and 5-mg once-daily dosing for 12 weeks for the treat-ment of erectile dysfunction (ED) and BPH-LUTS. Study participants were men with both ED and BPH-LUTS re-siding in Canada, France, Germany, Greece, Italy, Mexico, Portugal, Russia, and the United States (Clinicaltrials.gov: NCT00855582 [13]).
Study 3 (LVHB) was a randomized, double-blind, 4-group, placebo and tamsulosin 0.2 mg controlled, paral-lel design, multinational study to evaluate the efficacy and safety of tadalafil 2.5 mg and 5 mg once-a-day dosing for 12 weeks in men with BPH-LUTS residing in Japan, Korea, and Taiwan (Clinicaltrials.gov: NCT00861757 [14]).
Study 4 (LVHT) was a randomized, double-blind, 3-group, placebo-controlled, parallel-design, pilot study to evaluate the efficacy and safety of tadalafil 5 mg and tamsulosin 0.2 mg once-a-day dosing for 12 weeks in men with BPH-LUTS residing in Korea (Clinicaltrials. gov: NCT00540124 [15]).
Men who were at least 45 years of age, with moderate to severe LUTS due to BPH and evidence of bladder obstruc-tion, were eligible to participate in all 4 studies. ED was an entry criterion only in Study 2 (LVHR). The 4 studies were in compliance with the Helsinki Declaration.
In each study, participants were screened at V1. In all 4 studies, there was a 2- (Study 3, LVHB) or 4-week screening/washout period (V1-V2), a 4-week placebo lead-in period (V2-V3), and a 12-week double-blinded treatment period (V3 to last visit). At V2, participants in all studies were required to have an IPSS≥13 and a uro-flowmetry measure of urinary peak flow rate (Qmax)≥4 to≤15 ml/second on a voided volume of 125 mL to con-tinue in the study. One study (Study 3, LVHB) also re-quired a minimum total prostate volume of 20 mL. V3 (randomization) initiated the double-blind active-treat-ment placebo-controlled 12-week period. Patient charac-teristics were assessed at V2.
Clinical measures
Qmax included in this validation were based on assess-ment at V2 and at endpoint.
Patient-reported measures
The change in IPSS from randomization (V3) to endpoint was the primary objective in all the studies; changes in IPSS-QoL, BII and Qmax from V3 to endpoint were secondary objectives. Changes in these patient-reported outcomes included in this validation were based on as-sessment at V2 and at endpoint.
The PGI-I also was a secondary objective, with 1 assess-ment at endpoint. PGI-S assessed participants’perception of symptom severity at V2 and was an exploratory par-ameter. The Korean pilot study (Study 4) did not assess BII at V2 and the BII scores could therefore not be used from this study to correlate with PGI-S.
The IPSS is a self-administered 7-item urinary symp-tom severity scale about sympsymp-toms occurring over the past month (Additional file 1; International Prostate Symptom Score). The urinary symptoms can be categor-ized into voiding, storage and post-micturition symp-toms. Item scores are summed for a total IPSS score that ranges from 0 to 35 with a higher score indicating more severe symptoms.
The IPSS-QoL is a single question: “If you were to spend the rest of your life with your urinary condition just the way it is now, how would you feel about that?” with responses scored as follows:“delighted”(0),“pleased” (1), “mostly satisfied” (2), “mixed about equally satisfied and dissatisfied” (3), “mostly dissatisfied” (4), “unhappy” (5), and “terrible” (6) (Additional file 1; International Prostate Symptom Score).
The BII is a self-administered validated questionnaire with 4 questions about urinary problems during the past month regarding physical discomfort, worry about health, how bothersome symptoms are, and whether the symptoms are interfering with doing usual activities (Additional file 2; BPH Impact Index). The first 3 ques-tions are scored from 0 to 3, while the fourth is scored from 0 to 4. Item scores are summed for a BII total score that ranges from 0 to 13, with higher scores indi-cating more bother or problems associated with urinary symptoms within the previous month.
PGI-I is a 1-item questionnaire designed to assess the patient’s impression of changes in urinary symptoms. The PGI-I asks the patient to best describe how his urin-ary symptoms are now, compared with how they were before he began taking medication in the study. (“Check the one number that best describes how your urinary symptoms are now, compared with how they were be-fore you began taking medication in this study”). The patient enters his answer on a 7-point scale scored as: (1) “very much better,”(2)“much better,”(3)“a little better,” (4)“no change,”(5)“a little worse,”(6)“much worse,”or
(7) “very much worse.” Examples of urinary symptoms were provided based on the symptoms in the IPSS ques-tionnaire [3] with the addition of terminal dribble and ac-cidental urinary leakage [16]:“Urinary symptoms include difficulties in postponing urination, having to push or strain to begin urination, a weak urinary stream, stopping and restarting urination several times when attempting to urinate, prolonged urination with the end of urine flow slowing to a trickle (terminal dribble), the feeling that you haven’t emptied your bladder after you have fin-ished urinating, having to urinate again less than 2 hours after the last time you finished urinating, accidental uri-nary leakage, or having to get up at night to urinate”. The PGI-I was administered once at the end-of-study visit (Week 12 or the last visit).
PGI-S is a 1-item questionnaire designed to assess patient’s impression of disease severity. The PGI-S item asks the respondent to best describe how his urinary symptoms are now (“Check the one number that best describes how your urinary symptoms are now”) on a 4-point scale scored as:“normal”(1),“mild”(2),“ moder-ate” (3), or“severe” (4) . Examples of urinary symptoms similar to the PGI-I were provided. The PGI-S was ad-ministered once at the beginning of the placebo lead-in period (V2).
All patient-reported measures were originally de-veloped in English for the United States. Therefore, lin-guistic validations that included forward and backward translations, review/reconciliation, and cognitive debrief-ing with targeted patients were conducted for primary languages spoken in the countries participating in the 4 trials. In addition, for most linguistic validations, har-monization, a meeting in which all translations and the original are compared to ensure cross-cultural equiva-lence of concepts and the use of colloquial language, was performed.
Statistical analysis
The study results for tadalafil efficacy versus placebo are reported elsewhere [12-15].
In the current paper, because the aim of the analysis was not to make conclusions about tadalafil efficacy, but rather to establish construct validity of the PGI-S and the PGI-I, tadalafil and placebo data from the 4 clinical studies were pooled (N=1694) and analyzed. Further-more, an evaluation of tadalafil efficacy versus placebo would be based on changes from randomization (V3) to endpoint, while the validation of the PGI-I per its ques-tion ( see above) was based on changes from treatment onset at V2 (initiating with single-blind placebo therapy) to endpoint.
be expected to capture not only symptom burden but also impact of that symptom burden on the patient’s life. Therefore, we hypothesized that the PGI-S and PGI-I scores would be significantly and meaningfully asso-ciated with the IPSS, IPSS-QoL, and BII scores. In ad-dition, we explored the relationship with Qmax, the only clinical measure consistently assessed at V2 in the 4 clinical studies.
The associations between PGI-S response at V2 and other patient-reported and clinical measures at V2 (IPSS, IPSS-QoL, BII, and Qmax) were evaluated using 2 types of analyses. First, Spearman rank correlation coefficients were calculated between PGI-S and the other measures. Spearman correlation coefficient is a nonparametric ana-lysis which assesses how well the relationship between 2 variables can be described using a monotonic function [17]; for example, whether patients’perception of greater severity, as measured by the PGI-S, is associated with greater symptom burden as measured by IPSS. Correla-tion coefficients range from−1.0 to 1.0. Using a criterion suggested by Guilford and Fruchter [18], a significant correlation coefficient≤−0.30 or≥0.30 between the PGI-S and the V2 assessment of other patient-reported or clinical measures (i.e., supportive of the validity of the PGI-S).
The second type of analysis, unadjusted one-way ana-lysis of variance (ANOVA), was performed to evaluate the differences of these measures among the 4 PGI-S categories and pair-wise comparisons were made. Identi-cal ANOVA analyses, adjusted for covariates (e.g., age, prior alpha blocker use, country, baseline LUTs severity) were performed to confirm results. For all analyses, the a priori hypotheses were that patients perceiving more severe disease measured by PGI-S would have higher (worse) IPSS, IPSS-QoL, and BII scores and lower (worse) peak urine flow rate at V2.
The associations between PGI-I response at last visit and change in IPSS, IPSS-QoL, BII, and Qmax values from V2 to the last visit were evaluated using the same 2 types of analysis as performed with the PGI-S. For all analyses, the a priori hypotheses were that patients who reported change in their urinary symptoms would have better or worse IPSS, IPSS-QoL, and BII scores or Qmax values consistent with the direction of their perceived change in symptoms as measured by the PGI-I.
To further provide support for the validity of the PGI-S and PGI-I, the correlation analyses were repeated across 6 racial, ethnic, and severity subgroups: Asians versus Caucasians, Hispanic Caucasians versus non-Hispanic Caucasians, and LUTS severity at V2 (per IPSS classifica-tion of moderate versus severe). Assessment of race and ethnic subgroups was restricted within the relevant regions: Asians were only from Asian studies;
Cauca-sians, including both Hispanic and non-Hispanic
Caucasians, were only from non-Asian studies). It should be noted that these analyses were conducted to support the validity of the PGI-S and PGI-I and not to explore whether ethnic/racial groups differ in perception of se-verity or response to treatment. For all analyses, partici-pants were included regardless of what type of treatment they received.
Results
Participant characteristics
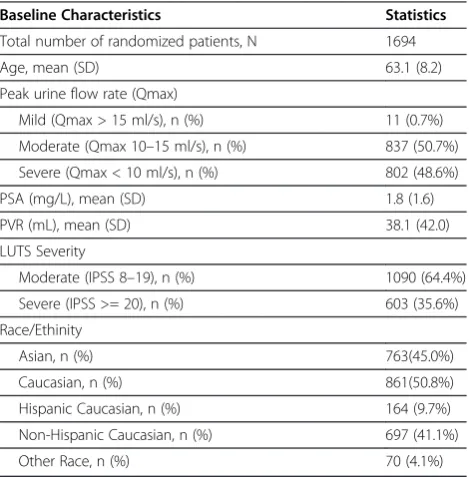
A total of 1694 men were enrolled and subsequently randomized in the 4 studies; mean age was 63.1 years (SD = 8.2, range from 45 to 87). A total of 35.6% had se-vere symptoms of BPH-LUTS per IPSS and 48.6% had severe outlet obstruction per urinary peak flow rate (Qmax) (Table 1). Participant characteristics obtained at V2 were generally similar across studies; although in Study 2 (LVHR), more patients had severe outlet ob-struction per Qmax, whereas in Study 4 (LVHT), more patients and their clinicians reported severe symptoms (data not shown).
A total of 1692 men completed the PGI-S at V2 (be-fore the placebo run-in period) and 1628 men completed the PGI-I at last visit. Participants’self-reported ratings of urinary symptom severity using the PGI-S were 1.1% normal, 22.2% mildly abnormal, 61.4% moderately ab-normal, and 15.3% severely abnormal. The mean symp-tom scores for all participants for IPSS, IPSS-QoL, BII
Table 1 Baseline Characteristics and Demographics
Baseline Characteristics Statistics
Total number of randomized patients, N 1694
Age, mean (SD) 63.1 (8.2)
Peak urine flow rate (Qmax)
Mild (Qmax > 15 ml/s), n (%) 11 (0.7%)
Moderate (Qmax 10–15 ml/s), n (%) 837 (50.7%)
Severe (Qmax < 10 ml/s), n (%) 802 (48.6%)
PSA (mg/L), mean (SD) 1.8 (1.6)
PVR (mL), mean (SD) 38.1 (42.0)
LUTS Severity
Moderate (IPSS 8–19), n (%) 1090 (64.4%)
Severe (IPSS >= 20), n (%) 603 (35.6%)
Race/Ethinity
Asian, n (%) 763(45.0%)
Caucasian, n (%) 861(50.8%)
Hispanic Caucasian, n (%) 164 (9.7%)
Non-Hispanic Caucasian, n (%) 697 (41.1%)
Other Race, n (%) 70 (4.1%)
(calculated using only data from Study 1, 2, and 3) at V2 were 19.8, 4.1 and 6.3, respectively. The mean V2 Qmax value was 10.0 ml/s.
Construct validity of the PGI-S
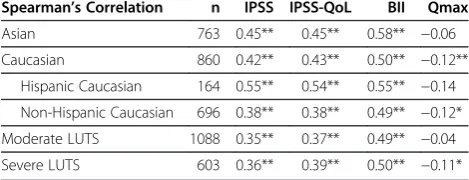
Spearman correlation coefficients calculated between PGI-S and all variables were statistically significant (P<0.001) and in the direction hypothesized (Table 2). However, the correlation coefficient calculated between PGI-S and Qmax did not reach the criterion of ≤−0.30 designated a priori as supportive of validity (Table 2). Similar trends of correlations were observed across eth-nicity, race and baseline severity (Table 3).
Overall comparisons among PGI-S severity responses showed significant differences across all variables regard-less of whether the ANOVA model was unadjusted or adjusted for covariates. The mean IPSS score for the par-ticipants who responded “moderate” (19.8) or “severe” (24.2) on the PGI-S were significantly different (P<0.001)
from the mean scores for all other responses with greater perceived severity corresponding to higher self-reported symptom burden. However, the mean IPSS scores for participants who responded“normal”(14.9) or “mild” (16.8) were significantly different from the mean scores for “moderate” and “severe” but not from each other. Mean IPSS-QoL and BII scores for the PGI-S cat-egories were all significantly different from one another (P<0.001) with greater perceived severity corresponding to perception of worse quality of life and greater disease impact. Qmax values were not significantly different be-tween participants who responded “normal” and those who responded“mild”, or“moderate”, or“severe”on the PGI-S, nor were they significantly different between the participants who responded “moderate” and those who responded“severe”. Only the Qmax values for those par-ticipants who responded“mild” were significantly differ-ent from the values for those who responded“moderate” or“severe”.
Construct validity of the PGI-I
Spearman correlation coefficients calculated between PGI-I and all variables were statistically significant (P<0.001) and in the direction hypothesized (Table 4). However, as with the PGI-S, the correlation coefficient calculated between PGI-I and Qmax change did not reach the criterion of≤−0.30 designated a priori as sup-portive of validity (Table 4). Similar trends of correla-tions were observed across ethnicity, race and V2 severity (Table 5).
Overall comparisons among PGI-I responses showed significant differences for all variables regardless of wheth-er the ANOVA model was unadjusted or adjusted for the covariates. However, to conduct pairwise comparisons,
Table 2 Correlation between PGI-S and other baseline BPH Measures in all patients
PGI-S (baseline visit) n (%) Mean IPSS (SD) Mean IPSS-QoL (SD) Mean BII (SD) Mean Qmax (SD)
Normal 18 (1.1%) 14.9 (2.9) 2.4 (0.6) 1.1 (1.4) 10.4 (2.4)
Mild 376 (22.2%) 16.8 (3.9) 3.5 (1.1) 4.0 (2.4) 10.4 (2.7)
Moderate 1039 (61.4%) 19.8 (4.7) 4.1 (1.0) 6.7 (2.5) 9.9 (2.8)
Severe 259 (15.3%) 24.2 (5.5) 5.0 (0.9) 9.1 (2.6) 9.6 (2.9)
Overall comparison p-value <0.001 <0.001 <0.001 0.003
Pairwise comparison p-value
Normal vs. Mild 0.092 <0.001 <0.001 0.993
Normal vs. Moderate <0.001 <0.001 <0.001 0.461
Normal vs. Severe <0.001 <0.001 <0.001 0.273
Mild vs. Moderate <0.001 <0.001 <0.001 0.002
Mild vs. Severe <0.001 <0.001 <0.001 <0.001
Moderate vs. Severe <0.001 <0.001 <0.001 0.171
Spearman’s Correlation 0.43** 0.43** 0.53** −0.09**
PGI-S: Patient Global Impression of Severity; IPSS: International Prostate Symptom Scores; IPSS QoL: IPSS-Quality of Life (QoL), BII - Benign Prostatic Hyperplasia Impact Index; Qmax: peak urine flow rate; n: number of patients; SD: Standard Deviation. Overall and pairwise comparison p-values are from analysis of variance without adjusting for covariates. **: p<0.001.
Table 3 Correlation between PGI-S and other baseline BPH Measures across race, ethnicity and baseline severity
Spearman’s Correlation n IPSS IPSS-QoL BII Qmax
Asian 763 0.45** 0.45** 0.58** −0.06
Caucasian 860 0.42** 0.43** 0.50** −0.12**
Hispanic Caucasian 164 0.55** 0.54** 0.55** −0.14
Non-Hispanic Caucasian 696 0.38** 0.38** 0.49** −0.12*
Moderate LUTS 1088 0.35** 0.37** 0.49** −0.04
Severe LUTS 603 0.36** 0.39** 0.50** −0.11*
Asian: from the 2 studies conducted in Asia; Caucasian: from the 2 studies conducted outside Asia.
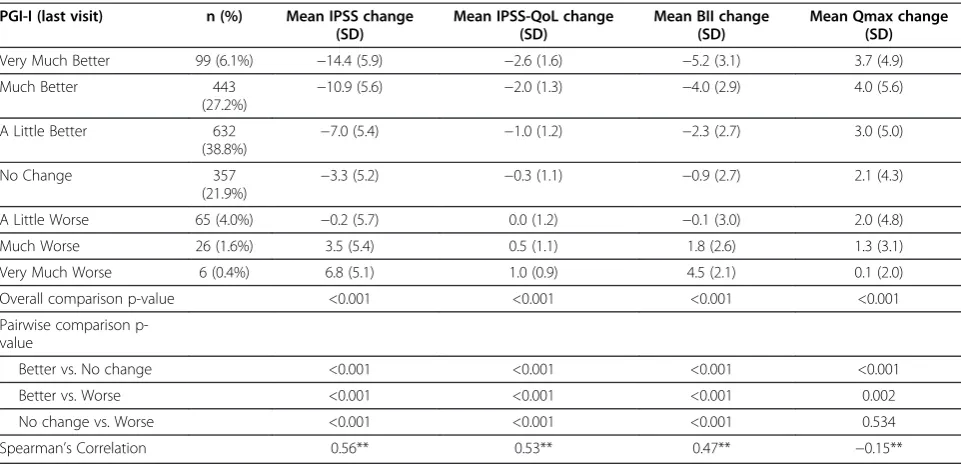
the small numbers for some responses (e.g.,“Very much worse” N=6) necessitated the collapsing of the 3 PGI-I response categories representing improvement (“a little better,” “much better,” and “very much better”) and the corresponding response categories representing worsen-ing into 1 category each, “Better” and“Worse,” respect-ively. Mean IPSS, IPSS-QoL and BII change scores were significantly different (P<0.001) among all 3 response cat-egories with improvement in symptoms, perceived QoL, and BPH impact corresponding to PGI-I “Better” re-sponses, and worsening in symptoms, perceived QoL, and BPH impact corresponding to PGI-I “Worse” re-sponses. Mean change in Qmax values for participants who responded on the PGI-I as improved or“Better”were
significantly higher than those for participants who re-sponded as “No Change” or classified as responding “Worse”. However, there were no significant differences between those who responded “No Change” and those who responded“Worse”.
Discussion
In men participating in clinical trials evaluating treat-ment for LUTS, evidence for the validity of the PGI-S and PGI-I was provided through the associations ob-served with other symptom and quality of life assess-ments, but not with peak flow rate severity or changes. The validation of these 2 questionnaires supports their utility as simple tools in research or for clinicians who treat patients with BPH- LUTS.
Symptom severity at V2 as assessed by PGI-S and changes in symptoms as assessed by PGI-I at endpoint were moderately to highly correlated with scores from other BPH patient-reported measures. Further support for the validity of the PGI-S and PGI-I was provided when similar associations were observed across ethnicity and V2 severity (as categorized by IPSS scores). (Tables 3 and 5).
The association with the clinical parameter, peakflow (Qmax), was weak both at V2 and endpoint (Tables 2 and 4). The weak correlation between subjective scores such as PGI-S and PGI-I and Qmax or Qmax change is not surprising. When Qmax was evaluated in the re-cently updated AUA BPH treatment guidelines 2010, the AUA panel concluded that Qmax correlates poorly with
Table 4 Correlation between PGI-I and other BPH Measures (change from baseline) in all patients
PGI-I (last visit) n (%) Mean IPSS change (SD)
Mean IPSS-QoL change (SD)
Mean BII change (SD)
Mean Qmax change (SD)
Very Much Better 99 (6.1%) −14.4 (5.9) −2.6 (1.6) −5.2 (3.1) 3.7 (4.9)
Much Better 443
(27.2%) −
10.9 (5.6) −2.0 (1.3) −4.0 (2.9) 4.0 (5.6)
A Little Better 632
(38.8%)
−7.0 (5.4) −1.0 (1.2) −2.3 (2.7) 3.0 (5.0)
No Change 357
(21.9%)
−3.3 (5.2) −0.3 (1.1) −0.9 (2.7) 2.1 (4.3)
A Little Worse 65 (4.0%) −0.2 (5.7) 0.0 (1.2) −0.1 (3.0) 2.0 (4.8)
Much Worse 26 (1.6%) 3.5 (5.4) 0.5 (1.1) 1.8 (2.6) 1.3 (3.1)
Very Much Worse 6 (0.4%) 6.8 (5.1) 1.0 (0.9) 4.5 (2.1) 0.1 (2.0)
Overall comparison p-value <0.001 <0.001 <0.001 <0.001
Pairwise comparison p-value
Better vs. No change <0.001 <0.001 <0.001 <0.001
Better vs. Worse <0.001 <0.001 <0.001 0.002
No change vs. Worse <0.001 <0.001 <0.001 0.534
Spearman’s Correlation 0.56** 0.53** 0.47** −0.15**
PGI-I: Patient Global Impression of Improvement; IPSS: International Prostate Symptom Scores; IPSS QoL: IPSS-Quality of Life (QoL), BII - Benign Prostatic Hyperplasia Impact Index; Qmax: peak urine flow rate; n: number of patients; SD: Standard Deviation. Overall and pairwise comparison p-values are from analysis of variance without adjusting for covariates. **: p<0.001.
Table 5 Correlation between PGI-I and other BPH Measures (change from baseline) across race, ethnicity and baseline severity
Spearman’s Correlation n IPSS IPSS-QoL BII Qmax
Asian 747 0.55** 0.52** 0.43** −0.15**
Caucasian 816 0.57** 0.54** 0.49** −0.13**
Hispanic Caucasian 158 0.65** 0.45** 0.49** −0.15
Non-Hispanic Caucasian 658 0.55** 0.54** 0.49** −0.14*
Moderate LUTS 1050 0.53** 0.52** 0.44** −0.12**
Severe LUTS 577 0.62** 0.54** 0.51** −0.19**
Asian: from the 2 studies conducted in Asia; Caucasian: from the 2 studies conducted outside Asia.
subjective symptoms, PVR and prostate size, and is a weak, patient-oriented outcome in that the patient only marginally experiences flow rate differences. The AUA panel also found that Qmax is not particularly useful from a diagnostic point of view [4]. A high correlation between symptoms scores but a weak correlation with objective parameters (including Qmax) has been re-ported before in studies within the same BPH disease area as well as in other areas such as female stress in-continence. When Angalakuditi and coauthors validated the BII instrument against IPSS, IPSS-QoL, PVR and Qmax in 12-week placebo-controlled studies, they found a high correlation with patient-reported symptoms and a poor correlation with objective parameters [6]. Yalcin and Bump examined the construct validity of PGI-S and PGI-I against stress incontinence episodes (assessed with weekly diaries), the Incontinence Quality of Life Ques-tionnaire (I-QoL) measures, and leakage during physical exertion (per pad test), and identified weak correlation with the objective pad test in contrast to the higher cor-relation with the other instruments [9]. It is interesting to note that across different lower urinary tract condi-tions, objective parameters do not seem to sufficiently capture patient-reported symptoms. These findings con-firm the need to include a patient-reported assessment in the evaluation of urological treatment benefit.
As in this study, moderate to high correlations (0.4 to 0.6) have been shown between patient global assess-ments and symptom measures in other therapeutic areas. It may be expected that a global assessment of symptom severity or change in symptom burden would correlate more highly (e.g., >0.70) with a symptom meas-ure; for example, the association between PGI-S and PGI-I and the IPSS would be stronger than reported if it adequately captured symptom burden. However, there are factors that potentially affect the strength of the as-sociation. One factor is the recall period for the mea-sures. The IPSS has a month recall period in which respondents are to recall and purportedly average their symptom severity over that month, whereas the PGI-S asks respondents to report current severity. At endpoint, the IPSS asks the respondent to recall only the past month and this is statistically compared to the respon-dent’s recall of the month prior to V2 (in which they may have been receiving treatment for BPH-LUTS, erectile dysfuncion, overactive bladder, etc.), while the PGI-I asks the respondent to remember how their symptoms were before they believed they were receiving treatment medi-cation and compare that to how their symptoms are cur-rently. Without asking the participants what timeframe they were considering when completing these instru-ments, it is difficult to estimate the effect that the differ-ence in recall periods has upon the strength of the associations between the IPSS and the global assessments.
Another factor that may affect the magnitude of the correlation is that the urinary symptoms that the partici-pants are asked to consider are not completely identical for each questionnaire. The IPSS does not include all urinary symptoms that could be affecting a patient with BPH-LUTS. While in the global impression scales im-plemented in the tadalafil clinical studies and validated here, examples of urinary symptoms were provided based on the symptoms in the IPSS questionnaire [3], in ad-dition to a few other symptoms. In PGI-I and PGI-S, ter-minal dribble was included as an example of urinary symptoms because it has been identified as a prevalent LUTS in many men [16] and may be associated with BPH. Postmicturition dribble defined as urine leakage al-most immediately after finishing urinating and walking away from the toilet was omitted as an example of urin-ary symptom in the PGI-S and PGI-I, since accidental urinary leakage was already included. Dysuria was also omitted as an example of urinary symptoms since the ex-clusion criteria in the tadalafil studies typically would eliminate patients with such presentation. Overall, the different urinary symptoms provided as examples in the PGI-S and PGI-I were not meant to be exhaustive of all urinary symptoms or restrictive to BPH, but aimed at providing the patient with examples of common urinary symptoms he could experience. In contrast, the global impression scale tested by Yalcin and Bump did not pro-vide any examples or explanation of the urinary condi-tion tested [9].
Despite the inherent differences between the global assessments and the IPSS, as well as the other patient-reported measures, the relationships observed in this study were in the direction hypothesized and showed the greatest changes in self-reported symptoms, quality of life, and BPH impact for those who perceived them-selves as improved (i.e., getting better).
A slightly different patient global assessment of improve-ment has been included before in a placebo-controlled 1-year study assessing changes to mono-therapy or combination-therapy with an alpha-blocker and/or 5 alpha-reductase-inhibitor in men with BPH-LUTS [19]. The authors concluded that the global assessments of improvement attested to the clinical significance of the difference in other outcome measures [19]. While the construct valid-ity demonstrated in the analysis presented in our paper is applicable to a population of men with BPH-LUTS, the validity of the PGI-S and PGI-I for men with other lower urinary tract symptoms has not been established.
Conclusions
Evidence of the construct validity of the PGI-S and PGI-I for men with BPH-LUTS provided in this study indicates that the 2 instruments could be a valuable and useful tool for clinical studies and practice. While the regulatory evaluation of treatment benefit in clinical trials may re-quire multi-item instruments to fully describe the impact of treatment on various symptoms [20], the PGI-S and PGI-I can provide an overall appraisal of a patients’ con-dition and is more practical for clinical use by its simpli-city in administration and interpretability.
Additional files
Additional file 1:International Prostate Symptom Score (IPSS).
Additional file 2:BPH Impact Index (BII).
Competing interests
All the authors are employees of Eli Lilly and Company, the manufacturer of CialisW, a PDE5-inhibitor, which is approved in USA, EU and other
geographies around the world for the treatment of ED, BPH-LUTS (signs and symptoms of BPH) and ED/BPH-LUTS.
Authors’contributions
LV was responsible for conception and study design, data interpretation, manuscript writing, critical review of the final manuscript and overall project management; WS and PW were responsible for study design, data analysis, manuscript writing and critical review of the final manuscript; RH was responsible for study design, data interpretation, manuscript writing and critical review of the final manuscript. All authors read and approved the final manuscript.
Acknowledgements
This study was funded by Eli Lilly and Company.
Received: 8 August 2012 Accepted: 29 October 2012 Published: 7 November 2012
References
1. Homma Y, Kawabe K, Tsukamoto T, Yamanaka H, Okada K, Okajima E, Yoshida O, Kumazawa J, Fang-Liu G, Lee C, Hsu T, Cruz RC, Tantiwang A, Lim PH, Sheikh MA, Bapat SD, Marshall VR, Tajima K, Aso Y:Epidemiologic survey of lower urinary tract symptoms in Asia and Australia using the international prostate symptom score.Int J Urol1997,4:40–46. 2. Abrams P, Cardozo L, Fall M, Griffiths D, Rosier P, Ulmsten U, van
Kerrebroeck P, Victor A, Wein A:Standardisation Sub-committee of the International Continence Society. The standardisation of terminology of lower urinary tract function: report from the Standardisation
Sub-committee of the International Continence Society.Neurourol Urodyn
2002,21(2):167–178.
3. Barry MJ, Fowler FJ Jr, O'Leary MP, Bruskewitz RC, Holtgrewe HL, Mebust WK, Cockett AT:The American Urological Association symptom index for benign prostatic hyperplasia. The Measurement Committee of the American Urological Association.J Urol1992,148(5):1549–1557. 4. [AUA] American Urological Association Web site:Guideline on the
management of benign prostatic hyperplasia (BPH); 2012. http://www.auanet. org/content/guidelines-and-quality-care/clinical-guidelines/main-reports/ bph-management/chap_1_GuidelineManagementof(BPH).pdf.
5. Barry MJ:Evaluation of symptoms and quality of life in men with benign prostatic hyperplasia.Urology2001,58(6 Suppl 1):25–32.
6. Angalakuditi M, Seifert RF, Hayes RP, O'Leary MP, Viktrup L:Measurement properties of the benign prostatic hyperplasia impact index in tadalafil studies.Health Qual Life Outcomes2010,8:131.
7. Kingery L, Martin ML, Naegeli AN, Khan S, Viktrup L:Content validity of the Benign Prostatic Hyperplasia Impact Index (BII); a measure of how
urinary trouble and problems associated with BPH may impact the patient.Int J Clin Pract2012,66(9):883–890.
8. Guy W:ECDEU Assessment Manual for Psychopharmacology. Rockville (MD): National Institute of Mental Health; 1976:217–222. 313–331.
9. Yalcin I, Bump RC:Validation of two global impression questionnaires for incontinence.Am J Obstet Gynecol2003,189:98–101.
10. Srikrishna S, Robinson D, Cardozo L:Validation of the Patient Global Impression of Improvement (PGI-I) for urogenital prolapse.Int Urogynecol J2010,21(5):523–528.
11. Arnold LM, Clauw D, Wang F, Ahl J, Gaynor PJ, Wohlreich MM:Flexible dosed duloxetine in the treatment of fibromyalgia: a randomized, double-blind, placebo-controlled trial.J Rheumatol2010,37(12):2578–2586. 12. Porst H, Kim ED, Casabé AR, Mir V, Secrest RJ, Xu L, Sundin DP, Viktrup L,
LVHJ study team:Efficacy and safety of tadalafil once daily in the treatment of men with lower urinary tract symptoms suggestive of benign prostatic hyperplasia: results of an international randomized, double-blind, placebo-controlled trial.Eur Urol2011,60(5):1105–1113. 13. Egerdie RB, Auerbach S, Roehrborn CG, Costa P, Garza MS, Esler AL,
Wong DG, Secrest RJ:Tadalafil 2.5 or 5 mg Administered Once Daily for 12 Weeks in Men with Both Erectile Dysfunction and Signs and Symptoms of Benign Prostatic Hyperplasia: Results of a Randomized, Placebo-Controlled, Double-Blind Study.J Sex Med2012,9(1):271–281. 14. Yokoyama O, Yoshida M, Kim SC, Wang C-J, Imaoka T, Morisaki Y, Viktrup L:
Efficacy and safety of tadalafil in Asian men with lower urinary tract symptoms suggestive of benign prostatic hyperplasia: A phase III randomized controlled study.Int J Urol2012, Epub ahead of print. 15. Kim SC, Park JK, Kim SW, Lee SW, Ahn TY, Kim JJ, Paick JS, Park NC, Park K,
Min KS, Kraus SR, Secrest RJ, Elion-Mboussa A, Viktrup L:Tadalafil administered once daily for treatment of lower urinary tract symptoms in Korean men with benign prostatic hyperplasia: Results from a placebo-controlled pilot study using tamsulosin as an active control. LUTS2011,3(2):86–93.
16. Irwin DE, Milsom I, Hunskaar S, Reilly K, Kopp Z, Herschorn S, Coyne K, Kelleher C, Hampel C, Artibani W, Abrams P:Population-based survey of urinary incontinence, overactive bladder, and other lower urinary tract symptoms in five countries: results of the EPIC study.Eur Urol2006,
50(6):1306–1315.
17. Spearman CE:The proof and measurement of association between two things.Am J Psychol1904,15:72–101.
18. Guilford JP, Fruchter B:Fundamental Statistics in Psychology and Education. New York: McGraw-Hill; 1973.
19. Lepor H, Williford WO, Barry MJ, Haakenson C, Jones K:The impact of medical therapy on bother due to symptoms, quality of life and global outcome, and factors predicting response. Veterans Affairs Cooperative Studies Benign Prostatic Hyperplasia Study Group.J Urol1998,
160(4):1358–1367.
20. FDA Guidance:Guidance for Industry. Patient-Reported Outcome Measures: Use in Medical Product Development to Support Labeling Claims; 2012. http://www.fda.gov/downloads/Drugs/GuidanceComplianceRegulatory Information/Guidances/UCM193282.pdf.
doi:10.1186/1471-2490-12-30