https://doi.org/10.5194/jsss-7-421-2018
© Author(s) 2018. This work is distributed under the Creative Commons Attribution 4.0 License.
Study of different magneto-optic materials for
current sensing applications
Sarita Kumari and Sarbani Chakraborty
Electrical and Electronics Engineering Department, Birla Institute of Technology, Mesra, Ranchi – 835215, Jharkhand, India
Correspondence:Sarita Kumari ([email protected])
Received: 14 August 2017 – Revised: 20 December 2017 – Accepted: 15 May 2018 – Published: 13 June 2018
Abstract. This article discusses the properties of different diamagnetic and paramagnetic materials for a basic current/magnetic field sensor system set up with different relative orientations of analyzers and polarizers. The paper analyzes linearity ranges of different materials and their sensitivity for different wavelengths. Terbium doped glass (TDG), terbium gallium garnet (TGG), doped TGG and dense flint glass materials are used for analysis based on Faraday’s rotation principle. TGG shows high Faraday rotation, temperature stability and high optical quality. Three ranges of the magnetic field have been chosen for performance analysis. The study reveals that doping of praseodymium (Pr3+) on TGG exhibits a better response at 532 nm as well as 1064 nm wavelengths than TGG. At 632.8 nm wavelength, cerium (Ce3+) doped terbium aluminum garnet (TAG) ceramic exhibits better resolution than others. The study has been done for performance analysis of different MO sensors applicable for measurement of various process parameters like current, displacement, and magnetic field.
1 Introduction
This article is based on analysis of linearity and sensitivity of different magneto-optic (MO) materials. The applications of magnetic materials are gaining importance in wide fields like industry, defense, astronomy and materials. More research is being carried out in developing new material. Magnetic materials are important media for data handling like data processing, saving and retrieving. Smart card and magnetic strip scanning systems are the most commonly and vastly used applications of the MO effect in our day-to-day life. Various magnetic materials are available, such as diamag-netic, paramagdiamag-netic, ferromagnetic and ferrimagnetic. Mag-netic materials can be made optically sensitive by doping them with rare earth ions. There are 17 types of rare earth ele-ments available on earth, but the most commonly used are yt-trium (Y), neodymium (Nd), gadolinium (Gd), terbium (Tb) and dysprosium (Dy). Chen et al. (2016a, b), Villaverde et al. (1978), and Booth and White (1984) have used rare earth garnets for their study.
In 1845, Faraday found that if a glass block is kept un-der a strong magnetic field, it becomes optically active (as reported in Jenkins and White, 1976). Optically active
mate-rial changes the plane of polarization of a linearly polarized light when placed in a magnetic field. This property can be utilized in designing various sensors if the change in mag-netic field can be associated with any physical variable. It of-fers non-contact sensing techniques for measurement of any parameter like current, displacement, and magnetic field. It has gained so much popularity because of many advantages over traditional sensing techniques like its immunity to elec-tromagnetic interference, stray capacitance as well as envi-ronmental effect. The sensor is highly reliable with a quick response. Transmitting and receiving optical data have min-imum loss and are least affected by noise compared to other means of measurement. The Faraday effect can be used for solid, liquid as well as gaseous media. MO materials must have high Verdet constants and high optical transparency for effective performance. The magneto-optical sensor provides a new perspective in sensor designing and testing.
den-sityB and total optical path lengthL.Vverdet is the
propor-tionality constant and is called a Verdet constant. Materials which have paramagnetic ions show a high Verdet constant, whereas it usually is very small for most of the materials. One example of material consisting of paramagnetic ions is terbium, which includes terbium doped glass (TDG) and ter-bium gallium garnet (TGG) as MO materials. The Faraday rotation changes with variation in wavelength of any MO ma-terial.
Many scientists have reported various properties of MO materials such as change in Verdet constant with wavelength, temperature dependency and size scalability. Verdet con-stants of various diamagnetic materials such as fused sil-ica (Dynasil 1001), borosilsil-icate (BK-7) glass and undoped yttrium aluminum garnet (YAG) crystal were calculated by Munin et al. (1992) for different wavelengths in the visible region. It was found that YAG shows a higher Verdet con-stant than BK-7 and Dynasil at 632.8 nm wavelength. Us-ing the Czochralski (Cz) method, Chen et al. (2016a, b) have fabricated Dy3+doped TGG material and Tm3+doped TGG material. The Verdet constant and magneto-optical character-istics of the materials can be enhanced remarkably by adding rare earth ions. The doped (Ce3+, Pr3+, Dy3+and Nd3+ dop-ing) TGG shows a 20–30 % higher Verdet constant value than pure TGG. Different techniques have been used to measure a Verdet constant of MO materials like pulsed magnetic fields for TGG by Villaverde et al. (1978), the Faraday effect in dia-magnetic glass by Thamaphat et al. (2006), and the ellipsom-etry technique in different media such as flint glass and water by Suchat et al. (2011). Faraday rotation of rare earth garnet material is usually inversely proportional to the wavelength of light, except for yttrium iron garnet (YIG), where the Verdet constant increases above 1300 nm wavelength (Booth and White, 1984). Analysis (Chen et al., 2016a, b) shows that YIG has a poor transparency below 1100 nm. For visible and near-infra-red wavelengths rare earth garnets are imple-mented for better performance. In 800–1700 nm wavelength, Zhao (2001) found higher rotation and low temperature de-pendency of YbBi:YIG material. It exhibits higher linearity, sensitivity and accuracy than pure YIG. At 1550 nm wave-length, Huang and Zhang (2002) doped yttrium (Y3+) and ytterbium (Yb3+) ions in bismuth substituted iron garnet to achieve large rotation and high temperature stability. Koerdt et al. (2003) found the Faraday effect in photonic crystals filled with transparent liquid at 573 nm. Characterization of MO properties of various MO materials is explained by Do-nati et al. (1988) for a wide range of Vis-NIR wavelengths. In the visible region, Chakraborty and Bera (2008) devel-oped a current sensor based on a null detection technique and Chakraborty and Kumari (2015) designed a magnetic field sensor using a TDG crystal as an MO sensor. A low-cost optical current sensor was designed and demonstrated by Zubia et al. (2013). The characterization of applied ten-sile stress is studied with in situ magnetic domain imaging and their dynamic behaviors by using magneto-optical Kerr
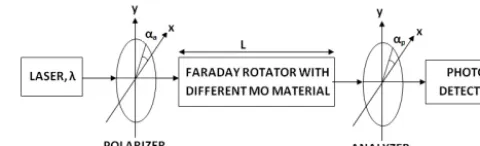
Figure 1.Schematic diagram of the basic magneto-optic measure-ment system.
effect (MOKE) microscopy assisted with magneto-optical in-dicator film (MOIF) (Qiu et al., 2017). Kalska et al. (2008) found a shift in the magneto-optic hysteresis curves due to exchange bias in the temperature-dependent magneto-optic hysteresis curve of “quasi-two-dimensional” arrays. Deeter et al. (1990, 1994), Deeter (1995) and Wolfe et al. (1992) designed a YIG-based magnetic field sensor.
Based on a literature survey it is found that MO sen-sors are being used in many industrial applications, such as measurement of displacement (Bera and Chakraborty, 2011), magnetic field (Wolfe et al., 1992; Chakraborty and Ku-mari, 2015), current (Chakraborty and Bera, 2008; Zubia et al., 2013), temperature, and vibration. Several studies are reporting on MO material development and its properties (Munin et al., 1992; Chen et al., 2016a, b; Booth and White, 1984; Chakraborty and Bera, 2008; Chakraborty and Ku-mari, 2015).
In this context, analysis of sensitivity can be regarded as one of the important performance criteria in sensor design. It shows how the material behaves with the change in partic-ular parameters. Since terbium doped materials exhibit very high rotation, these are very popular and widely used in sen-sor designing. In this paper we are focusing on various MO materials at different wavelengths and analyzing the sensi-tivity of a basic magneto-optic setup under different relative orientations of polarizer and analyzer.
2 Theory
Figure 1 shows the basic block diagram of a magneto-optic measurement setup. For analysis, the basic current measure-ment setup has been used (Chakraborty and Bera, 2008; Bera and Chakraborty, 2011). It consists of a laser source, polarizer, Faraday rotator, analyzer, and photo-detector to detect the change in plane of polarization. An unpolarized monochromatic light beam coming from the laser source be-comes polarized after passing through the polarizer. A lin-early polarized monochromatic light beam passes through the magneto-optic material under the influence of a strong magnetic field, and after passing through the analyzer, the beam is received by the photo-detector.
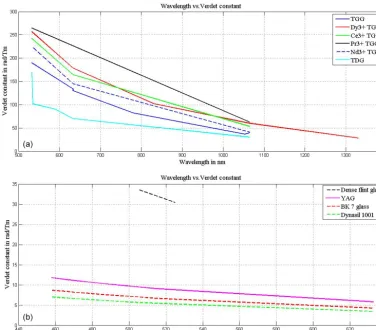
po-Figure 2.Verdet constant (rad Tm−1) versus wavelength (nm) plot for(a)paramagnetic and(b)diamagnetic materials.
larization of light by a Poincare sphere. In this article, the Mueller matrix approach has been considered for the calcu-lation. As written in Eq. (1), the output intensity (Iout) of a
light beam can be expressed in terms of the Mueller matrix of a Faraday rotator (Mrot), the Mueller matrix of an analyzer
(Mana) and the Stokes vector (Sin) of the linearly polarized
input beam (I0).
Iout=I0ManaMrotSin (1)
Mana=
1 2
1 cos 2αa sin 2αa 0
cos 2αa cos22αa cos 2αasin 2αa 0
sin 2αa cos 2αa sin 2αasin22αa 0
0 0 0 0
(2)
Mrot=
1 0 0 0
0 cos 2θ −sin 2θ 0 0 sin 2θ cos 2θ 0
0 0 0 1
(3)
Sin=
1 cos 2αp
sin 2αp
0
(4)
The transmission angle of the analyzer and polarizer are de-noted asαa andαp, respectively. The input beam is
consid-ered to be a linearly horizontally polarized monochromatic beam. Hence the transmission angle of the polarizer becomes zero. From Eqs. (1) to (4), the expression of the normalized detected intensity of the output beam can be written as in Eq. (5).
Inorm=
h
cos2(θ−αa)
i
(5)
θ=VverdetBL (6)
Equation (6) gives the relationship of Faraday rotation (θ) with magnetic flux density (B) and total optical path trav-elled (L) by the light beam (Wenbo, 2000; Koerdt et al., 2003; Thamaphat et al., 2006; Suchat et al., 2011; Aerssens et al., 2011). Faraday rotation is directly proportional to mag-netic flux density (B), total optical path length (L) and the Verdet constant (Vverdet) of material which is the function of
Figure 3.Variation of detected intensity (Iout) with magnetic field (mT) at the 532 nm wavelength of TGG, Dy3+doped TGG, Ce3+doped
TGG, Pr3+doped TGG and Nd3+doped TGG for analyzer angles 48, 47, 50, 47 and 42◦, respectively (Table 3).
Figure 4.Variation of detected intensity (Iout) with magnetic field (B) wavelength of TGG, Dy3+doped TGG, Ce3+doped TGG, Pr3+
doped TGG and Nd3+doped TGG at 1064 nm for analyzer angles 42, 50, 50, 50 and 42◦, respectively (Table 4).
(Chakraborty and Bera, 2008).
Vverdet= −
eλ 2mc
dn
dλ (7)
The MO sensor (Martinez et al., 2005) is becoming popular because of many advantages over traditional sensors. Much work has been done on material analysis and properties. Lin-earity and sensitivity analysis of the material is a very impor-tant aspect of sensor designing. This study focuses on the re-sponse of detected intensity which is dependent on magnetic field, wavelength and total optical path length. Here fixed op-tical path length is considered and analysis has been done for different materials with corresponding Verdet constants for different wavelengths. The response is non-linear: as a re-sult it becomes necessary to study the sensitivity for the en-tire magnetic field range, which is not constant throughout. In order to analyze this, piecewise linearization needs to be considered about a certain operating point. For our linearity analysis, a linear region was calculated for a magnetic field ranging from 0 to 10 mT. Observed response curves shown in
Figs. 3–5 are for 0 to 10 mT magnetic flux density where the linear region was evaluated. For this analysis, 5 mT operating points were considered about which the sensitivity has been calculated.
Sensitivity=
dInorm
dB
(8)
Sensitivity is derived from Eq. (8) and can be written as shown in Eq. (9).
Sensitivity=[−2 sin 2 (VverdetBL−αa)×V L] (9)
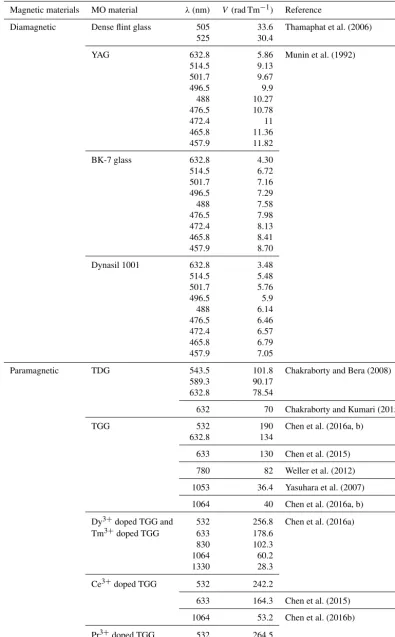
Table 1.Verdet constants of various MO materials.
Magnetic materials MO material λ(nm) V(rad Tm−1) Reference
Diamagnetic Dense flint glass 505 33.6 Thamaphat et al. (2006)
525 30.4
YAG 632.8 5.86 Munin et al. (1992)
514.5 9.13
501.7 9.67
496.5 9.9
488 10.27
476.5 10.78
472.4 11
465.8 11.36 457.9 11.82
BK-7 glass 632.8 4.30
514.5 6.72
501.7 7.16
496.5 7.29
488 7.58
476.5 7.98
472.4 8.13
465.8 8.41
457.9 8.70
Dynasil 1001 632.8 3.48
514.5 5.48
501.7 5.76
496.5 5.9
488 6.14
476.5 6.46
472.4 6.57
465.8 6.79
457.9 7.05
Paramagnetic TDG 543.5 101.8 Chakraborty and Bera (2008) 589.3 90.17
632.8 78.54
632 70 Chakraborty and Kumari (2015)
TGG 532 190 Chen et al. (2016a, b)
632.8 134
633 130 Chen et al. (2015)
780 82 Weller et al. (2012)
1053 36.4 Yasuhara et al. (2007)
1064 40 Chen et al. (2016a, b)
Dy3+doped TGG and 532 256.8 Chen et al. (2016a) Tm3+doped TGG 633 178.6
830 102.3
1064 60.2
1330 28.3
Ce3+doped TGG 532 242.2
633 164.3 Chen et al. (2015)
1064 53.2 Chen et al. (2016b)
Pr3+doped TGG 532 264.5
Table 1.Continued.
Magnetic materials MO material λ(nm) V (rad Tm−1) Reference Paramagnetic Nd3+doped TGG 532 225 Chen et al. (2016a)
633 145 Wang et al. (2015)
1064 41 Chen et al. (2016a)
Ce3+doped TAG ceramic 632.8 199.55
Ferrimagnetic YIG 780 380 Weller et al. (2012)
1310 2200 Chen et al. (2016a)
Bi doped YIG 1550 1700
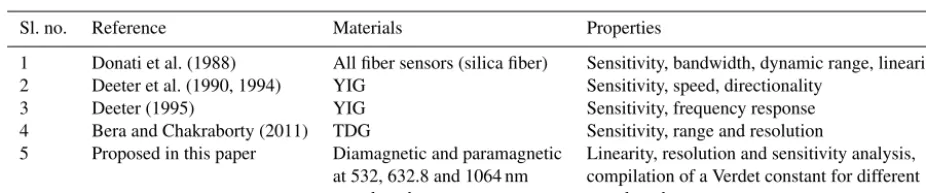
Table 2.Work done by various researchers.
Sl. no. Reference Materials Properties
1 Donati et al. (1988) All fiber sensors (silica fiber) Sensitivity, bandwidth, dynamic range, linearity 2 Deeter et al. (1990, 1994) YIG Sensitivity, speed, directionality
3 Deeter (1995) YIG Sensitivity, frequency response 4 Bera and Chakraborty (2011) TDG Sensitivity, range and resolution
5 Proposed in this paper Diamagnetic and paramagnetic Linearity, resolution and sensitivity analysis, at 532, 632.8 and 1064 nm compilation of a Verdet constant for different wavelengths wavelengths
In this paper, we have compiled the Verdet constant of different MO materials at various wavelengths. For analy-sis several observations of the detected intensity have been made with variation in magnetic flux density. Sensitivity and resolution have been found, corresponding to each material. Table 2 shows the performance characteristics done by vari-ous researchers for different MO materials.
3 Result
Figure 2a shows the Verdet constant (rad Tm−1) versus
wave-length (nm) plot of various paramagnetic MO materials such as TDG, pure TGG and doped TGG (Dy3+, Ce3+, Pr3+and Nd3+ doping). It is observed that the Faraday rotation in-creases by approximately 20–25 % when TGG is doped with rare earth ions. Pr3+doped TGG gives the highest Faraday rotation of any other rare earth doping. In Fig. 2b the Verdet constant is plotted with change in wavelength for diamag-netic materials. Chen et al. (2016a and b) have found that more than one single paramagnetic ion in garnets can re-markably enhance the Faraday rotation of magneto-optic ma-terial. The cubic symmetry of garnet crystals plays an im-portant role in the properties of MO materials. Rare earth (RE) garnets are complex oxides with chemical formula X3Y2Z3O12(X=RE3+,Y andZ=Ga3+, Al3+ions).
Ce3+doped TAG has quantum based super-exchange in-teraction between Tb3+ and other paramagnetic RE3+ ions which results in an improved Verdet constant.
In this analysis, the range of the magnetic field considered is from 0 to 10 mT and the total optical path length is 30 mm. Equation (5) is used to plot detected intensity with variation in magnetic field as shown in Figs. 3–5.
The detected intensity responses with variation in mag-netic field density have been plotted using MATLAB 8.0 software. The linearly fit curve equation used wasf(x)= p1×x+p2. Here we have considered different relative
ori-entations between analyzer and polarizer angle. In this analy-sis, a linearly horizontally polarized (αp=0) monochromatic
beam is considered as the input beam and the analyzer angle is varied between 40 and 50◦with a change of 1◦. In the ba-sic Faraday magneto-optic system, when the polarizer angle is in the horizontal direction and the analyzer angle is in the region of 45◦, a linear response is usually observed. Various plots were achieved and analyzed for diamagnetic and para-magnetic materials at different wavelengths, i.e., 532, 632.8 and 1064 nm.
Figure 5.Detected intensity versus magnetic field curve at 632.8 nm wavelength of YAG, BK-7 glass, fused glass, TGG, TDG and Ce3+ doped TAG ceramic for analyzer angles 49, 48, 48, 47, 49 and 48◦, respectively (Table 5).
Figure 6.Variation in detected intensity with an analyzer angle from 40 to 50◦of TGG at operating point 5 mT.
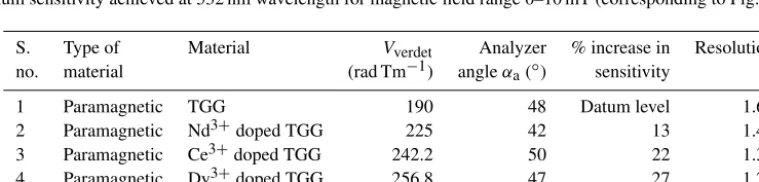
Table 3.Maximum sensitivity achieved at 532 nm wavelength for magnetic field range 0–10 mT (corresponding to Fig. 3).
S. Type of Material Vverdet Analyzer % increase in Resolution
no. material (rad Tm−1) angleαa(◦) sensitivity
1 Paramagnetic TGG 190 48 Datum level 1.64
2 Paramagnetic Nd3+doped TGG 225 42 13 1.45
Table 4.Maximum sensitivity achieved at 1064 nm wavelength for magnetic field range 0–10 mT (corresponding to Fig. 4).
S. Type of Material Vverdet Analyzer % increase in Resolution
no. material (rad Tm−1) angleαa(◦) sensitivity
1 Paramagnetic TGG 40 42 Datum level 7.30
2 Paramagnetic Nd3+doped TGG 41 42 03 7.12
3 Paramagnetic Ce3+doped TGG 53.2 50 32 5.54
4 Paramagnetic Dy3+doped TGG 60.2 50 50 4.86
5 Paramagnetic Pr3+doped TGG 62.7 50 57 1.16
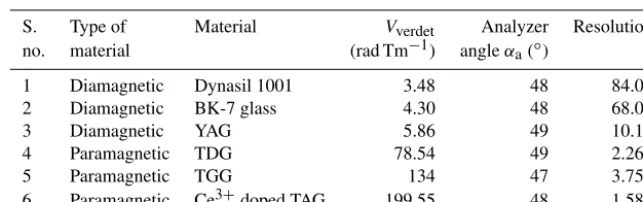
Table 5.Maximum sensitivity achieved at 632.8 nm wavelength for magnetic field range 0–10 mT (corresponding to Fig. 5).
S. Type of Material Vverdet Analyzer Resolution
no. material (rad Tm−1) angleαa(◦)
1 Diamagnetic Dynasil 1001 3.48 48 84.03
2 Diamagnetic BK-7 glass 4.30 48 68.02
3 Diamagnetic YAG 5.86 49 10.17
4 Paramagnetic TDG 78.54 49 2.266
5 Paramagnetic TGG 134 47 3.750
6 Paramagnetic Ce3+doped TAG 199.55 48 1.587
Nd3+doped TGG at 1064 nm wavelength for analyzer angles 42, 50, 50, 50 and 42◦. Figure 5 shows the response of de-tected intensity with the change in magnetic field density for YAG, BK-7 glass, fused glass, TGG, TDG and Ce3+doped TAG ceramic at 632.8 nm wavelength for analyzer angles 49, 48, 48, 47, 49 and 48◦.
From experimental curves of Figs. 3–5, the sensitivity was expressed in terms of slope for analyzer angle. The results are listed in Tables 3–5 for all the observations achieved for different MO materials.
Figure 6 shows a sample of variation in detected intensity with an analyzer angle from 40 to 50◦of TGG at operating point 5 mT. Maximum sensitivity was calculated from this plot for TGG at 532 nm wavelength. The same method was followed to analyze the sensitivity of other materials for dif-ferent wavelengths.
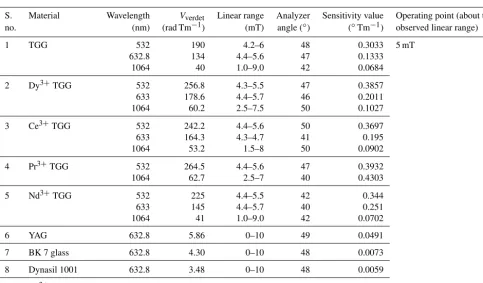
Based on the slope plotted for detected intensity with vari-ation in magnetic flux density, a linear range of MO materi-als was observed from 4 to 6 mT as mentioned in Table 6 for pure TGG. To find the linear range, a curve fitting toolbox of MATLAB 8.0 has been used. Corresponding to this, sen-sitivity of the MO materials was analyzed at 5 mT operating point. Further, Table 7 shows the consolidated linear range and sensitivity value of various other MO materials at differ-ent wavelengths as available from the literatures mdiffer-entioned in Table 1.
4 Discussion
Tables 3–5 show different MO materials with their corre-sponding material types, Verdet constant, analyzer angle αa
(◦), percentage increase in sensitivity and resolution with re-spect to pure TGG. The analysis was done for 532, 1064 and 632.8 nm, respectively, and magnetic flux density in the range of 0 to 10 mT.
Doping of pure TGG with different rare earth ions is re-sponsible for the higher Verdet constant. It is observed from Tables 3 and 4 that the sensitivity of the material increases with the Verdet constant. Table 3 shows that at 532 nm wave-length and 47◦angle, Pr3+doped TGG material gives max-imum sensitivity as compared to any other doped TGG ma-terial, which is 30 % higher than pure TGG. At a 50◦angle and at 1064 nm wavelength, Pr3+ doped TGG material ex-hibits 57 % higher sensitivity than pure TGG, as shown in Table 4. Amongst diamagnetic and paramagnetic materials, YAG and Ce3+doped TAG ceramic show maximum sensitiv-ity at 49 and 48◦angles, respectively, at 632.8 nm wavelength as shown in Table 5.
Table 6.Analyzing linear regions of TGG over a magnetic field range of 0–10 mT at 532 nm wavelength (sample data).
S. Material Analyzer Linear range SSE (sum of Operating point (about the no. angle (◦) (mT) square of error) observed linear range)
1 TGG 40 4.4–5.7 0.039935 5 mT
2 41 4.4–5.6 0.15164
3 42 4.4–5.6 0.091376
4 43 4.5–5.6 0.078071
5 44 4.4–5.6 0.15391
6 45 4.3–5.5 0.054256
7 46 4.4–5.6 0.11167
8 47 4.4–5.6 0.14408
9 48 4.2–6.0 0.019899
10 49 4.4–5.6 0.13685
11 50 4.4–5.6 0.12299
Table 7.Analyzing linear regions of various MO materials over a magnetic field range of 0–10 mT.
S. Material Wavelength Vverdet Linear range Analyzer Sensitivity value Operating point (about the no. (nm) (rad Tm−1) (mT) angle (◦) (◦Tm−1) observed linear range)
1 TGG 532 190 4.2–6 48 0.3033 5 mT
632.8 134 4.4–5.6 47 0.1333
1064 40 1.0–9.0 42 0.0684
2 Dy3+TGG 532 256.8 4.3–5.5 47 0.3857
633 178.6 4.4–5.7 46 0.2011
1064 60.2 2.5–7.5 50 0.1027
3 Ce3+TGG 532 242.2 4.4–5.6 50 0.3697
633 164.3 4.3–4.7 41 0.195
1064 53.2 1.5–8 50 0.0902
4 Pr3+TGG 532 264.5 4.4–5.6 47 0.3932
1064 62.7 2.5–7 40 0.4303
5 Nd3+TGG 532 225 4.4–5.5 42 0.344
633 145 4.4–5.7 40 0.251
1064 41 1.0–9.0 42 0.0702
6 YAG 632.8 5.86 0–10 49 0.0491
7 BK 7 glass 632.8 4.30 0–10 48 0.0073
8 Dynasil 1001 632.8 3.48 0–10 48 0.0059
9 Ce3+doped TAG 632.8 199.55 4.5–5.7 48 0.3149
In the visible region, YAG material can be used for de-signing the optical isolator due to its high optical quality (Munin et al., 1992). Dy3+ doped TGG is highly transpar-ent MO material and can be used as isolators and for ad-vanced optical communication applications in the visible and near-infrared regions. Also, YIG and Bi doped YIG can be used in the VIS-NIR region as below 1100 nm wavelength they show poor transparency (Chen et al., 2016a, b). Dy3+ doped and Tm3+doped TGG show paramagnetic properties below 10 K and between the 10 and 300 K temperature range, respectively (Chen et al., 2016a and b). Tm3+doped TGG
also finds applications in the VIS-NIR region. Ferrimagnetic materials such as iron, nickel and gadolinium show a non-linear response, though they exhibit high Faraday rotation (Chakraborty and Kumari, 2015). Bismuth added iron gar-net also proves a larger Faraday rotation than iron gargar-net in 0.8–1.7 µm. YIG are mainly used in microwave communi-cation as well as designing of optically based devices like rotators (Chen et al., 2016a, b, 2005). It shows high stability for temperature variation.
conductiv-ity. The TDG sensor has been used for measurement of cur-rent, displacement, magnetic field, high-pulse energy lasers, and so on. Size scalability is poor in TDG, whereas it is not a problem for TGG. Yasuhara et al. (2007) have reported that TGG can be used for high-power applications due to ex-cellent thermal conductivity (4.5–7.4 W mK−1). Large-size TGG can be developed by different techniques.
5 Conclusion
TGG and doped TGG are studied extensively for two wave-lengths 532 and 1064 nm. Different sensitivities are obtained corresponding to doping of different rare earth ions. Analy-sis shows that Pr3+doped TGG gives maximum sensitivity over pure TGG as well as any other doped TGG material. At 532 nm wavelength, a 30 % increase in sensitivity can be achieved with doping of a Pr3+rare earth ion on TGG. It is observed that a 57 % increase in sensitivity can be achieved with doping of a Pr3+ rare earth ion on TGG at 1064 nm wavelength. This difference in increase can be justified by the higher value of the Verdet constant of the material at the two different wavelengths, which in turn reflects higher ro-tation. Diamagnetic materials show a linear range but low sensitivity from 0 to 10 mT. TGG crystal is useful in sensor application, due to its size scalability. Paramagnetic materials can be used for the visible and NIR regions. However, ferri-magnetic materials are useful for the IR region because poor transparency is observed below 1100 nm. It is used for mea-surement of various parameters like current, magnetic field, and displacement. Any variable which can be expressed in terms of magnetic field (current) or displacement can be used for measurement using the MO sensor setup. The magneto-optic materials are extensively used in micro-magneto-optic devices such as switches, optical/Faraday isolators, modulators, and deflectors for fiber-optic devices.
Data availability. The underlying measurement data are not pub-licly available and can be requested from the authors if required.
Competing interests. The authors declare that they have no con-flict of interest.
Acknowledgements. The authors gratefully acknowledge the support of the Electrical and Electronics Engineering Department of the Birla Institute of Technology (BIT), Mesra, Ranchi, and are also grateful to the reviewers of Journal of Sensors and Sensor Systemsfor improving the manuscript.
Edited by: Ryutaro Maeda
Reviewed by: three anonymous referees
References
Aerssens, M., Gusarov, A., Brichard, B., Massaut, V., Mégret, P., and Wuilpart, M.: Faraday effect based optical fiber current sen-sor for tokamaks, 2nd International Conference on Advance-ments in Nuclear Instrumentation Measurement Methods and their Applications (ANIMMA), 6–9 June 2011, Ghent, Belgium, 1–6, IEEE, 2011.
Bera, S. C. and Chakraborty, S.: Study of magneto-optic element as a displacement sensor, Measurement, 44, 1747–1752, 2011. Booth, R. C. and White, E. A. D.: Magneto-optic properties of rare
earth iron Garnet crystals in the wavelength range 1.1–1.7 µm and their use in device fabrication, J. Phys. D Appl. Phys., 17, 579–587, https://doi.org/10.1088/0022-3727/17/3/015, 1984. Chakraborty, S. and Bera, S. C.: Magneto-optic over-current
detec-tion with null optical tuning, Sensors & Transducers Journal, 87, 52–62, 2008.
Chakraborty, S. and Kumari, S.: Design and development of a magneto-optic sensor for magnetic field measurements, Sensors & Transducers, 184, 153–158, 2015.
Chen, G. J., Lee, H. M., Chang, Y. S., Lin, Y. J., and Chai, Y. L.: Preparation and properties of yttrium iron Garnet microcrystal in P2O5–MgO glass, J. Alloy. Compd., 388, 297–302, 2005.
Chen, Z., Yang, L., Hang, Y., and Wang, X.: Preparation and char-acterization of highly transparent Ce3+doped terbium gallium Garnet single crystal, Opt. Mater., 47, 39–43, 2015.
Chen, Z., Yang, L., Hang, Y., and Wang, X.: Faraday effect improve-ment by Dy3+doping of terbium gallium Garnet single crystal, J. Solid State Chem., 233, 277–281, 2016a.
Chen, Z., Yang, L., Hang, Y., and Wang, X.: Improving characteris-tic of Faraday effect based on the Tm3+doped terbium gallium Garnet single crystal, J. Alloy. Compd., 661, 62–65, 2016b. Deeter, M. N.: High sensitivity fiber-optic magnetic field sensors
based on iron Garnets, IEEE T. Instrum. Meas., 44, 464–467, 1995.
Deeter, M. N., Rose, A. H., and Day, G. W.: Fast, sensitive magnetic-field sensors based on the Faraday effect in YIG, J. Lightwave Technol., 8, 1838–1842, 1990.
Deeter, M. N., Bon, S. M., Day, G. W., Diercks, G., and Samuel-son, S.: Novel bulk iron Garnets for magneto-optic magnetic field sensing, IEEE T. Magn., 30, 4464–4466, 1994.
Donati, S., Annovazzi-Lodi, V., and Tambosso, T.: Magneto-optical fibre sensors for electrical industry: analysis of performances, IEE Proceedings J. (Optoelectronics), 135, 372–382, 1988. Hecht, E.: Optics, 2nd edn., Low price edition, Addison-Wesley
Publishing Company, Boston, USA, 1987.
Huang, M. and Zhang, S.: Growth and characterization of rare-earth iron Garnet single crystals modified by bismuth and ytterbium substituted for yttrium, Mater. Chem. Phys., 73, 314–317, 2002. Jenkins, F. A. and White, H. E.: Fundamental of Optics, 4th edn.,
McGraw – Hill International Edition, New York, USA, 1976. Kalska, B., Fumagalli, P., Hilgendorff, M., and Giersig, M.:
Co/CoO core–shell nanoparticles – Temperature-dependent magneto-optic studies, Mater. Chem. Phys., 112, 1129–1132, 2008.
Martinez, L., Cecelja, F., and Rakowski, R.: A novel magneto-optic ferrofluid material for sensor applications, Sensor. Actuat. A-Phys., 123, 438–443, 2005.
Munin, E., Roversi, J. A., and Villaverde, A. B.: Faraday effect and energy gap in optical materials, J. Phys. D Appl. Phys., 25, 1635– 1639, https://doi.org/10.1088/0022-3727/25/11/011, 1992. Qiu, F., Ren, W., Tian, G. Y., and Gao, B.: Characterization of
ap-plied tensile stress using domain wall dynamic behavior of grain-oriented electrical steel, J. Magn. Magn. Mater., 432, 250–259, 2017.
Shurcliff, W. A.: Polarized Light Production And Use, Harvard Uni-versity Press, Cambridge, Massachusetts, USA, 1962.
Suchat, S., Viriyavathana, P., Jaideaw, P., Haisirikul, N., Kerd-sang, W., and Petcharavut, S.: Measurement of the Verdet con-stant in different mediums by using ellipsometry technique, Progress In Electromagnetics Research Symposium Proceedings, 12–16 September 2011, Suzhou, China, Session 2P7, p. 436, 2011.
Thamaphat, K., Bharmanee, P., and Limsuwan, P.: Measurement of Verdet constant in diamagnetic glass using Faraday effect, Edito-rial Board: Natural Sciences Social Sciences, Kasetsart Univer-sity, Bangkok, Thailand, p. 18, 2006.
Villaverde, A. B., Donatti, D. A., and Bozinis, D. G.: Ter-bium gallium Garnet Verdet constant measurements with pulsed magnetic field, J. Phys. C Solid State, 11, 495–498, https://doi.org/10.1088/0022-3719/11/12/004, 1978.
Wang, X., Yang, L., Chen, Z., Wang, J., Hong, J., Wang, Y., Shi, C., Zhang, P., Zhang, L., and Hang, Y.: Growth and Faraday rotation characteristics of Tb3−xNdxGa5O12single crystal, Opt. Mater.,
47, 157–160, 2015.
Weller, L., Kleinbach, K. S., Zentile, M. A., Knappe, S., Hughes, I. G., and Adams, C. S.: Optical isolator using an atomic vapor in the hyperfine Paschen–Back regime, Opt. Lett., 37, 3405–3407, 2012.
Wenbo, F. E. I.: Highly sensitive fiber-optic Faraday-effect magnetic field sensor based on yttrium iron Garnet, J. Mater. Sci. Technol., 16, 205–206, 2000.
Wolfe, R., Gyorgy, E. M., Lieberman, R. A., Fratello, V. J., Licht, S. J., Deeter, M. N., and Day, G. W.: High frequency magnetic field sensors based on the Faraday effect in Garnet thick films, Appl. Phys. Lett., 60, 2048–2050, 1992.
Yasuhara, R., Tokita, S., Kawanaka, J., Kawashima, T., Kan, H., Yagi, H., Nozawa, H., Yanagitani, T., Fujimoto, Y., Yoshida, H., and Nakatsuka, M.: Cryogenic temperature characteristics of Verdet constant on terbium gallium Garnet ceramics, Opt. Ex-press, 15, 11255–11261, 2007.