R E S E A R C H A R T I C L E
Open Access
A visual tool for accessibility study of pipeline
maintenance during design
Chu-Hsuan Lee
1, Meng-Han Tsai
2and Shih-Chung Kang
3*Abstract
Background:Pipeline maintenance is becoming an important issue in modern construction and building information model (BIM) research. An understanding of pipeline accessibility considerations in terms of operation and maintenance is essential for planning and management. Previous studies have highlighted the complexity of multi-pipes including mechanical, electrical and plumbing (MEP) pipelines and the importance of information visualization, but few have proposed a way to consider accessibility problems during operation and maintenance.
Methods:Therefore, this study develops a systematic method to evaluate accessibility with respect to pipeline maintenance. We first divided pipeline accessibility into three categories: (1) visual accessibility—the visibility for an inspector to view; (2) approachable accessibility—the difficulty for an inspector to approach; and (3) operational accessibility—the pipeline that can be operated by the inspectors. We created mathematical models and discussed the ergonomic details about each category. We then developed a user interface, VAO Checker, in which V, A and O stand for visual, approachable and operational respectively, to display visual information about pipeline accessibility. Through instantaneous analysis, the system visualizes the accessibility of the pipelines. We visually represent the intersection and union of these three categories to illustrate the varying accessibility of pipe elements.
Results:A usability test was conducted to validate the system’s effectiveness. The results of the usability analysis show that users have higher correctness when using VAO Checker than 2D plan drawing and 3D model, and they evaluate the performance of this tool better than 2D plan drawing.
Conclusion:Pipeline designers can benefit by using this tool to sketch a suitable traffic flow for engineers to investigate. Furthermore, the substantial amount of information saved in the layout database could be referenced for future optimization.
Keywords:Pipeline maintenance; Building information model (BIM); Pipeline accessibility; Mechanical; Electrical; and Plumbing (MEP); Information Visualization
Background
Pipeline design has become increasingly important in modern construction. Operation and maintenance re-quires consideration of accessibility in the design of the layout of plant pipelines. Previous research has noted that piping accounts for 20% of costs for the industry as a whole (Calixto et al. 2009) and over 50% of the total detail-design labor hours (Park and Storch 2002). All other activities of following detail design depend on pip-ing and massive savpip-ings are achievable by utilizpip-ing good layout design and engineering practices.
Mechanical, electrical, and plumbing (MEP) pipes used to be supplemental facilities in construction. However, they have become necessary facilities, especially in non-residential construction, such as hospitals, fire stations, and plants. Coordinating a MEP system is a tremendous challenge in engineering fields such as advanced technol-ogy, health care, and biochemistry industries (Khanzode et al. 2008). Knowing how to arrange MEP systems appro-priately is one of the most crucial aspects of the design phase (Riley et al. 2005).
Maintenance is a crucial phase in these types of con-struction. Based on a statistics on expenses in a typical water treatment plant in year-2008, maintenance takes 15% possession of the expenses (Biehl and Inman 2010). * Correspondence:[email protected]
3Department of Civil Engineering, National Taiwan University, Taipei, Taiwan Full list of author information is available at the end of the article
Moreover, based on some European and U.S. case study, maintenance has remarkable impact on at least one of the environmental aspects (Junnila et al. 2006). A poorly designed pipeline layout design wastes space and mate-rials. Moreover, it can cause difficulty or even danger during manipulation and management.
Literature review
The literature reviewed for this study included findings and recommendations related to piping that can be cate-gorized into three main groups: a pipe-routing algorithm, the integration of multi-pipes, and the visualization of pipeline design.
Pipe-routing algorithms
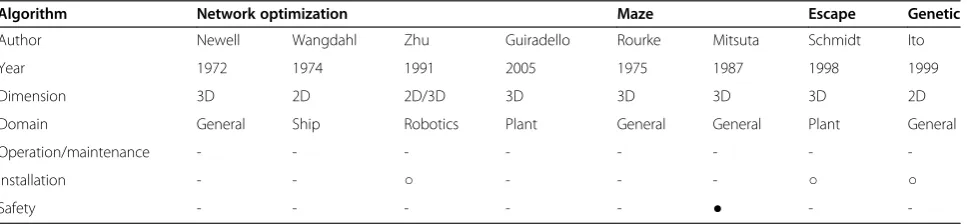
Pipe-routing design is a subset of assembly design that conceives collision-free routes for pipes. A survey by Qian et al. (2008) categorized it into four fields: indus-trial plant pipeline layout design, circuit layout design, aircraft design, and ship piping system design (Qian et al. 2008). Several studies have been devoted to routing algorithms, and mainly focus on physical constraints that connect the terminals of given locations and avoid all obstacles. They then use economic constraints to minimize the length of pipes and the number of pipe turns, which leads to an optimal specification. However, few, if any, solutions have considered pipeline accessibil-ity in relation to operation and maintenance. Table 1 shows previous studies have disregarded some important constraints (Guirardello and Swaney 2005; Ito 1999; Mitsuta et al. 1987; Newell 1972; Park and Storch 2002; Rourke 1975; Schmidt-Traub et al. 1998; Wangdahl et al. 1974; Zhu and Latombe 1991). Zhou and Yin (2010) emphasized that practical constraints, such as maintenance requirements and manufacturability, are not well recognized, and how humans still play an im-portant role in guiding the computer to finish the de-sign (Zhou and Yin 2010).
Integration of multi-pipes
An industrial plant typically has more than one kind of pipeline. Feng et al. (2012) indicated a large number of
pipelines, multifarious design constraints, and numerous obstacles in layout complicate the design of a pipeline system (Feng et al. 2012). Recently, engineers have mainly used existing CAD software for design assistance, which has increased the problems associated with ex-perts, such as complex operation, a long design cycle, and low efficiency. Some researchers advocated a new layout space model to reduce high complexity and de-sign interference in the automated dede-sign of pipeline systems (Deliang and Huibiao 2009; Feng et al. 2012). Kimet al.(1996) found the range and complexity of the constraints limits the possibility of automatic pipe route design, and demonstrated a more natural and effective representation for route optimization (Kim et al. 1996). Previous studies recognized the complexity in pipeline arrangement and proposed some methods to reduce it (Biehl and Inman 2010; Guirardello and Swaney 2005). However, in many instances the pipeline layout cannot be simplified, so the complexity should be taken into account.
Visualization regarding pipeline accessibility
Some researchers have begun noticing the utility of in-formation visualization for construction purposes as a means of improving the data-rich, but information-poor, problems of the construction industry (Songer et al. 2004; Tsai et al. 2010; Tsai et al. 2013). Previous research focused on the visualization of construction data, noting how it can help identify potential causal relationships among construction data (Korde et al. 2005; Kuo et al. 2011; Russell et al. 2009). Gao et al.(2006) investigated colored construction drawing, which can increase the efficiency and accuracy of communication between de-signers and contractors (Grootjans 2009a). Chang et al. (2009) and Chen et al. (2013) suggested a systematic procedure to determine the most suitable colors for ef-fectively presenting the construction information (Chang et al. 2009; Chen et al. 2013). This procedure includes the selection, evaluation, and testing of colors to ensure they match the meaning of the construction information with the cognition of the users. Wang (2011) used the conception of visualization to develop an approach for
Table 1 Earlier studies of pipe routing
Algorithm Network optimization Maze Escape Genetic
Author Newell Wangdahl Zhu Guiradello Rourke Mitsuta Schmidt Ito
Year 1972 1974 1991 2005 1975 1987 1998 1999
Dimension 3D 2D 2D/3D 3D 3D 3D 3D 2D
Domain General Ship Robotics Plant General General Plant General
Operation/maintenance - - -
-Installation - - ○ - - - ○ ○
Safety - - - ● -
assessing reachability of wheelchair users (Wang 2011). With reference to pipeline arrangement, Deliang and Huibiao (2009) pointed out that visualization can help handle the detection and response to collisions between pipes and obstacles (Deliang and Huibiao 2009).
Expert interviews
During the early stage of this research, we interviewed six experts to determine the requirements of pipeline de-sign. They are all in the field of plant pipeline design, in-cluding three engineers from a construction company, two managers from a microelectronics corporation, and one executive officer from the Building Information Modeling (BIM) research center. After combining the opinion of experts with previous literature review, we mainly focused our research on pipeline accessibility during operation and maintenance, which is rarely dis-cussed in previous studies.
Needs analysis
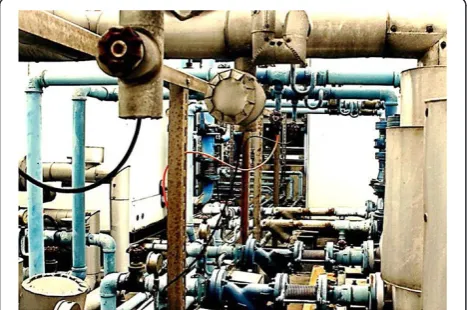
We determined from the interviews that there are four main considerations in pipeline design: (1) the manufac-turing process, (2) operation and maintenance, (3) cost, and (4) aesthetics. In a typical plant engine room, as depicted in Figure 1, the engineers first have to deliber-ate how the pipelines go according to the manufacturing process, which will influence productivity and efficiency. They then contemplate how the workers will handle the equipment, meters, and valves during the operation and maintenance phase. Cost and aesthetics are aspects used to optimize the consequences of designs. Previous stud-ies have proposed many algorithms by considering the cost factor, but maintenance is rarely discussed.
We mainly focused on operation and maintenance. Pipeline accessibility is the key factor to effective main-tenance as it determines how easily the engineers can stretch to the accessories related to pipelines, including equipment, meters, and valves. Engineers can sometimes
see pipelines from a distance, but cannot approach them due to the obstacles in the way of the pipelines. In other cases, engineers cannot read the meters in detail or op-erate the valves without difficulty, because these parts are mounted too high. We seek an easy way to illustrate pipeline accessibility with a view to engineers benefiting from this intuitive tool during the construction cycle (i.e., design, operation, and maintenance).
Objective and scope
The aim of this study is to develop a method to assist decisions about pipeline maintenance. One major chal-lenge of coordinating MEP multi-pipes is identifying the spatial conflicts between systems. Through instantan-eous analysis, the system automatically produces visual information indicating how much pipe access the engi-neers can have. This tool allows users to view, explore, and interact with the pipeline information via a direct manipulation interface in order to identify the spatial accessibility in a more intuitive manner. The user can thus obtain a comprehensive understanding of pipeline maintenance.
Methods
We use a Venn diagrama, a diagram that shows all pos-sible logical relations between different sets, to differen-tiate three categories of pipeline accessibility. We then apply each section of the diagram to different scenarios. We further develop mathematical models and discuss the ergonomic details about each different category.
Overall procedure of pipeline accessibility
We proposed three categories,visual,approachable, and
operational to present the extent to which the pipe
elements are accessible. As shown in Figure 2, we use the intersection and union of these three categories to discuss different scenarios as follows:
Visual (V): determines how much of the pipe is dir-ectly visible for inspection.
Approachable (A): determines how far maintenance engineers can walk along the pipes.
Operational (O): checks how much of the pipes can be reached in order to operate valves or check surfaces.
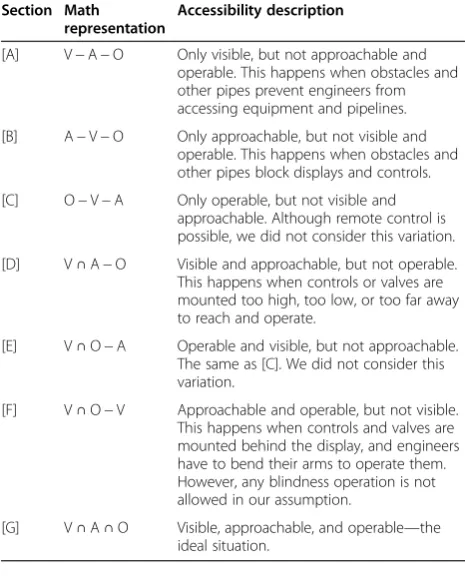
In the Venn diagram, there are seven sections among the three circles. Each one is a variation of intersection and union. As listed in Table 2, we give the accessibility description of each variation from Figure 2.
These three categories are expressed in a visual con-ception of information. We adopted the anthropometric data from the American Bureau of Shipping (The American Bureau of Shipping 2003) to build the model for accessibility analysis. We made some modifications by considering the physical differences between Americans and Taiwanese, because the first case would be a semicon-ductor fabrication plant in Taiwan.
Approachable accessibility
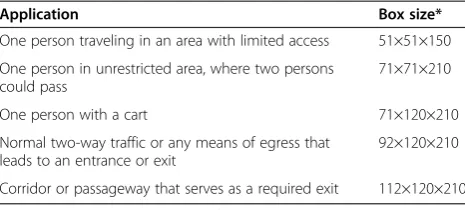
This level determines how far people can walk along the pipes. Walkways should have 2.1 m minimum clearance above the walking surface for the full length and width of the walkway. The analysis and mathematical model of approachable accessibility is different from the other two because it is a dynamic process. As shown in Figure 3 and Table 3, we first use a bounding cylinder to represent a
Table 2 Seven variations of intersection and union
Section Math representation
Accessibility description
[A] V−A−O Only visible, but not approachable and operable. This happens when obstacles and other pipes prevent engineers from accessing equipment and pipelines.
[B] A−V−O Only approachable, but not visible and operable. This happens when obstacles and other pipes block displays and controls.
[C] O−V−A Only operable, but not visible and approachable. Although remote control is possible, we did not consider this variation.
[D] V∩A−O Visible and approachable, but not operable. This happens when controls or valves are mounted too high, too low, or too far away to reach and operate.
[E] V∩O−A Operable and visible, but not approachable. The same as [C]. We did not consider this variation.
[F] V∩O−V Approachable and operable, but not visible. This happens when controls and valves are mounted behind the display, and engineers have to bend their arms to operate them. However, any blindness operation is not allowed in our assumption.
[G] V∩A∩O Visible, approachable, and operable—the ideal situation.
person, and bounding boxes in different sizes to represent a cart in different applications. If obstacles or other pipes block the box, it cannot go farther along the pipes.
The mathematical model of visual accessibility is then constructed as the equation:
A¼ðH;r;PÞ ð1Þ
As denoted in Figure 4, r¼Max W;Dð2 Þ; and we used a cylinder with radius r and height H to simplify the bounding box.Smeans the start point, andTmeans the target point.Pis the path fromStoT:
P¼ S;p1;p2;…;pn;pnþ1;…T
h i
; where the cylinder is not blocked.
Visual accessibility
This level determines how much of the pipe is directly visible for inspection. We further divide it into two levels: visible and legible. The former includes those used for normal operations and those not requiring ac-curate readings, whereas the latter includes those used frequently, for obtaining precise readings, and in emer-gencies. The mathematical model of visual accessibility is constructed as the following equation. Figure 5 indi-cates the parameters.
V¼ S;oH;oL
min;oLmax;θ;oHvmin;HvmaxÞ
ð2Þ
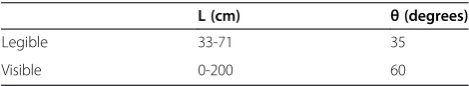
Figure 6 indicates people’s field-of-view. The two pa-rameters regarding it are the distance from eyes (L) and
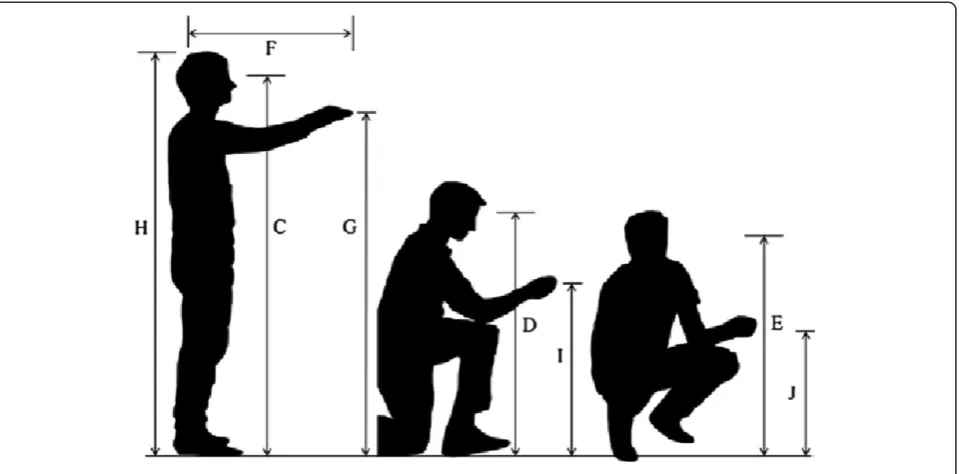
the viewing angle from the central line (θ). Based on ABS research, as shown in Table 4, people can see the details of pipes at distances between 33 cm and 71 cm, and a viewing angle within 35 degrees, where the legible level should be located (provided obstacles or other pipes do not block the pipes and displays). The distance for the visible level can be up to 200 cm, with the viewing angle up to 60 degrees. Figure 7 illustrates the visual heights (Hv) for displays in different postures: standing (C), kneel-ing (D), and squattkneel-ing (E). Table 5 shows the maximum and minimum heights for the legible and visible levels, based on personal height (H). Because the range of these three postures overlapped, we integrated the data. The legible level should be located within the multiple 0.4261-0.9375, but the visible level can be broader, 0.2955-1.0114.
Operational accessibility
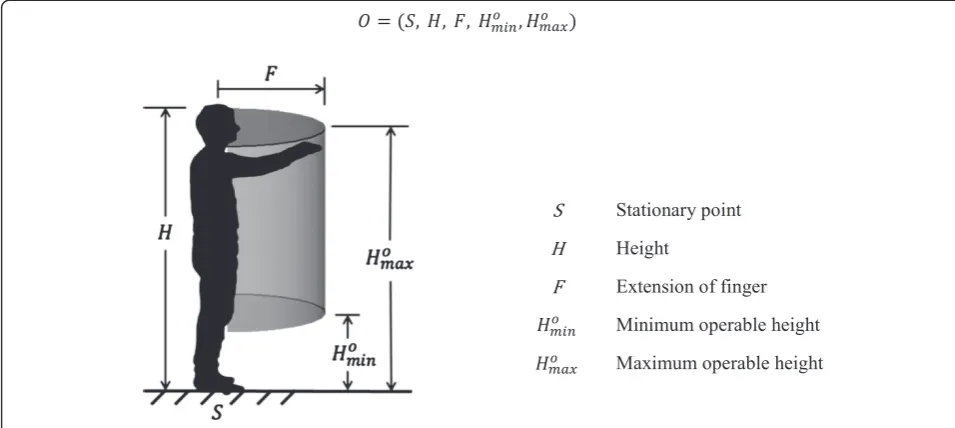
To facilitate the operation of valves or the checking of surfaces, this level checks the accessibility of pipes. It is derived from the arrival accessibility level, and shows the ease with which people can operate within the pipe lay-out. We further divided it into two levels: general con-trol and precise concon-trol. The former includes those used for normal operations and those not requiring accurate manipulation, whereas the latter includes those used frequently, for obtaining precise performance, or in emergencies. The mathematical model of operational ac-cessibility is constructed as the following equation. Figure 8 indicates the parameters.
O¼ S;oH;oF;oHo
min;HomaxÞ
ð3Þ
People’s forward functional reach from behind the shoul-der to the tip of the extended finger (F) and the operable heights (H0)for controls in different postures are illustrated in Figure 7: standing (G), kneeling (I), and squatting (J). Table 6 shows the maximum and minimum forward func-tional reach and heights for precise and general controls, based on personal height (H). Frequently used controls should be located within a radius of multiple 0.2614 from the operator’s centerline, whereas less frequently used con-trols should be located within a radius of multiple 0.4545
Table 3 Bounding box size for recommended walkway dimensions
Application Box size*
One person traveling in an area with limited access 51×51×150
One person in unrestricted area, where two persons could pass
71×71×210
One person with a cart 71×120×210
Normal two-way traffic or any means of egress that leads to an entrance or exit
92×120×210
Corridor or passageway that serves as a required exit 112×120×210
*Size representation: W (cm) × (D + d) (cm) × H (cm).
from the operator’s centerline. Because the range of these three postures overlapped, we integrated the data. Precise control should be located within the multiple 0.2273-0.7670, but general control can be broader, 0.2045-1.0966.
Implementation
This study developed a system, VAO Checker, which in-tegrated the user interface and visualization information as a tool, to implement the proposed methodology. The
following sections describe the software used for the de-velopment environment and the system design.
Programming platform
This study used Microsoft Windows Presentation Foun-dation (WPF) for the display of the user interface. WPF was chosen because it allows programmers to easily unify multimedia data, and change the appearance or the function of display controls for customization. Fur-thermore, the WPF application functions by off-loading to graphics processing units (GPUs) rather than central processing units (CPUs), which facilitates smoother graphics and better performance (Nathan 2006).
Graphics engine
The framework developed for the visualization informa-tion was based on the Microsoft XNA Game Studio 4.0. This tool assists the development of video games and the improvement of software management. XNA has ample performance for the development of 2D and 3D games. It offers users the capability to build the operat-ing system and visual images with ease (Grootjans 2009; Miller and Johnson 2010).
System design
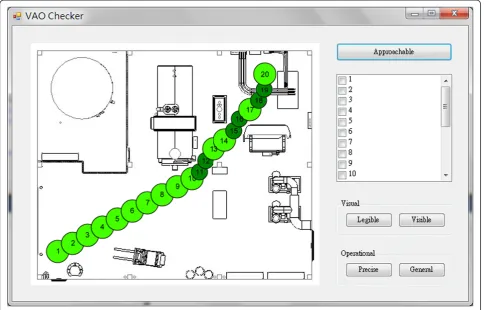
The proposed tool called VAO Checker was built for this study to consider the three categories of pipeline accessi-bility. As shown in Figure 9, the operation interface Figure 5Mathematical model of visual accessibility.
Figure 6Field-of-view.
Table 4 Suitable range of field-of-view
L (cm) θ(degrees)
Legible 33-71 35
displays a plan view of the space, including the equip-ment and pipelines. The user can use this tool to find a collision-free path through the space and to examine the different levels of visual and operational accessibility.
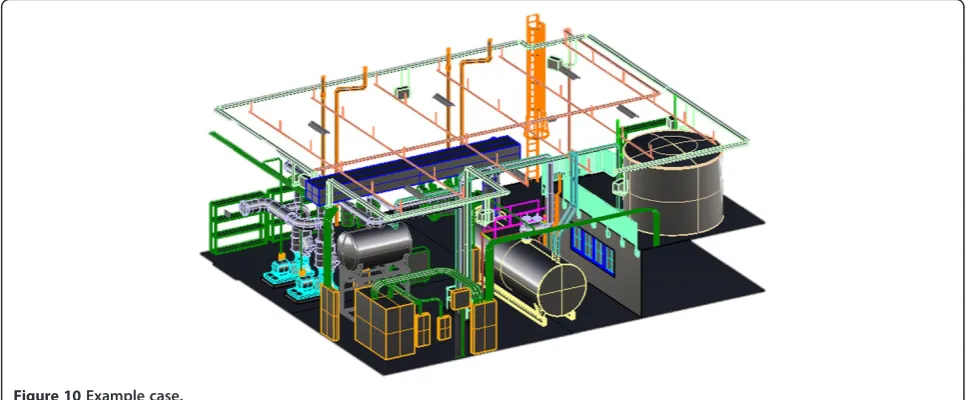
Example case
We created an example case to validate the practicality of VAO Checker. We built a virtual building project as an example case in a machinery room (Figure 10), which has some basic equipment and a pipeline arrangement.
After the start point and target point are decided, and the “Approachable” button is clicked, a collision-free path with some check points listed in the blank comes into view (Figure 11). The dot with sufficient approach-able accessibility is bigger and colored light green, and the dot with limited approachable accessibility is smaller and colored dark green.
The user can choose one of those listed points, and the chosen point will turn into a red dot (Figure 12). The user can then examine different levels of visual and
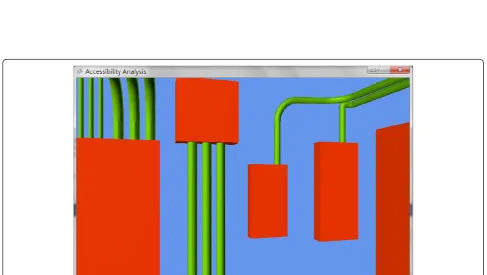
operational accessibility by clicking the four buttons at the bottom right corner. A visualization window, indicating a corresponding level of accessibility, will open (Figure 13). The user can utilize some specific keys to interact with the pipeline information, such as rotating the view direction or stepping forward or backward.
Validation
In order to verify how VAO Checker could help users explore and understand relevant accessibility informa-tion, we conducted a usability test. We also solicited expert consultation to verify the usability and how the users can interact with the pipeline accessibility information.
Test plan
Test procedure For the usability test, we built a typical machinery room project with equipment and pipelines. There were 10 accessibility problems in this case, which are categorized in Table 7 according to Figure 2 and Figure 7Related height in different postures.
Table 5 Suitable field-of-view and vision range (multiple of H) for legible and visible levels
Posture L (cm) θ(degrees) Standing (C) Kneeling (D) Squatting (E) Overall
Visible maximum 200 60 1.0114 0.8239 0.7102 1.0114
Legible maximum 71 35 0.9375 0.7500 0.5795 0.9375
Legible minimum 33 0 0.7216 0.5398 0.4261 0.4261
Table 2. All users had to identify the problems in three individual tasks, each task using different mediums, 2D plan drawing, 3D model and our system, VAO Checker. Besides, we also conducted the NASA Task Load Index (NASA-TLX) test. As shown in Figure 14, the test plan began with the NASA-TLX weight assessment, in which the user compared the factors pairwise based on their perceived importance. After the user finished the identi-fication of accessibility problems via one information medium, the user had to rate each factor of task load within a 100-points range. The final NASA-TLX score was calculated based on the weight distribution, which was decided at the initial phase.
Test participants There were 30 participants in the us-ability test, 19 male and 11 female. Their ages ranged from 20 to 37 years old. We solicited participant from non-engineering background as well, because they might pro-vide suggestion from different point of view. Among the participants, 27 participants are from a civil engineering background, 2 from a psychology background, and 1 from an economics background.
Test environment The usability test was conducted in a controlled environment that was limited to the room shown in Figure 15. In this room, each participant was asked to sit at the east side of the front table in the room. A researcher, sitting next to the participant, conducted and facilitated the test procedure and guided the partici-pants through the test.
Results and discussion
Anαlevel of 0.05 was used for all statistical tests and ana-lysis, and we calculated the p-value between groups in analysis of variance (ANOVA), wherep < 0.05means sta-tistically significant. The test results assessed how quickly and accurately participants performed the task when using different mediums. There is also an analysis of NASA-TLX score, which shows how the participants evaluated the ergonomics performance of each medium. They are summarized as follows:
Correctness: VAO≧3D > 2D
The box-and-whisker plot, a visual display of the five number summary, of success rate of each medium is
shown in Figure16. Table8presents means and
Figure 8Mathematical model of operational accessibility.
Table 6 Suitable forward functional reach and heights (multiple of H) for precise and general controls
Posture Forward (F) Standing (G) Kneeling (I) Squatting (J) Overall
General maximum 0.4545 1.0966 0.8239 0.7102 1.0966
Precise maximum 0.2614 0.7670 0.6136 0.4545 0.7670
Precise minimum 0 0.4886 0.3068 0.2273 0.2273
standard deviations of success rate of each medium, and the p-value shows the data between 2D and VAO Checker is statistically significant. As the data indicates, the success rate of VAO Checker (64.3%) is 1.6 times higher than 2D plan drawing (40.1%) and 1.14 times higher than 3D model (56.4%).
Performance: 3D > VAO > 2D
The box-and-whisker plot of NASA-TLX score of each
medium is shown in Figure17. Table9presents means
and standard deviations of NASA-TLX score of each medium, and the p-value shows the data between each pair of these three groups is statistically significant. The Figure 9Operation interface of VAO Checker.
score of 2D plan drawing is the lowest (36.0), whereas the score of 3D model is the highest (53.8). The score of VAO Checker (48.0) is 1.33 times higher than 2D plan drawing.
Findings from the result
Most of the participants have a background of civil engineering, and they can get on track quickly when they check 2D plan drawing or 3D model. Based on the observation during the usability test, participants would spend some time to get used to the user interface of VAO Checker, because it is a new tool for them. As a result, the average problem identifica-tion time of VAO Checker is longer than 2D plan drawing and 3D model.
However, in the analysis of correctness, the success rate of VAO Checker is the highest. This means, al-though users might spend more time when they first contact with the user interface of VAO Checker, they still can achieve the goal of high correctness. Some participants advised that in addition to the three cat-egories of accessibility, VAO Checker should take more safety factors into consideration. They indicated that the
section where steam is generated should be prohibited to pass through. Then, the path should bypass those areas.
In the analysis of performance, the NASA-TLX score of 3D model is slightly higher than VAO Checker. We also interviewed the participants about their feeling when they manipulated VAO Checker. Many of them pointed out that the manipulation of VAO Checker had a sense of reality, unlike 2D plan drawing. They could look around the environment, and perceive the size of equipment and pipelines. The visual effects made it like playing a game. However, because the viewing angle of VAO Checker is set as first person, they sometimes got confused with the direction in the virtual environment. On the contrary, the viewing angle of 3D model is set as third person, and they can identify the direction easily. That is the reason some participants evaluated the NASA-TLX score of 3D model higher.
Figure 12Chosen check point turns into a red dot.
errors. They suggested that VAO Checker is suitable for planning a more complex environment, such as chiller machinery room. The sizes of pipelines are big-ger, and there are more relevant systems. Formerly only experienced designers could plan a pipeline layout which is acceptable enough. Through VAO Checker, designers could save a lot of time in analyzing and planning.
Owing to the booming BIM industry, some partici-pants supposed VAO Checker would be developed into an application-programming interface (API) of BIM re-lated software. Construction companies or corporations are increasingly using BIM as a tool to integrate infor-mation from the fields of architecture, structural engin-eering, and MEP systems. If VAO Checker can be developed into an API, more pipeline designers and en-gineers can benefit by saving time and effort.
Despite the participants needed some time to be familiar with the manipulation interface of VAO Checker, they all agreed that they could identify the ac-cessibility problems very easily via this tool, because it provided sufficient information for them to judge the level of pipeline accessibility. They expected the path generated from analysis of approachable accessibility could be used for inspection or judgment, and the en-gineers would have a certain understanding of pipeline maintenance of the entire environment if they could move along this path.
Contribution
Unlike previous studies, in which few solutions have been offered to propose a way to consider pipeline accessibility through maintenance, our research emphasizes the import-ance of pipeline accessibility and makes efforts on the fol-lowing sections:
A useful tool for pipeline designers and engineers
We have shown that VAO Checker serves as a useful system for pipeline designers and engineers during op-eration and maintenance. Designers can benefit by sketching a suitable traffic flow for the users’ investiga-tion. Engineers can obtain a comprehensive understand-ing of the pipeline maintenance with the aid of the interface and can identify spatial accessibility in a more intuitive manner.
Considering pipeline accessibility
Unlike previous studies, in which few, if any, solutions have been offered to propose a way to consider pipeline accessibility through operation and maintenance, our re-search emphasizes its importance.
Integration of information from multi-pipes
With regard to the complexity of multi-pipes, different kinds of pipes might have to be considered in terms of different levels of accessibility. We developed mathemat-ical models about each different accessibility category and discussed the ergonomic details.
Enhancing comprehension via visualization
Given the importance of visualization for pipeline accessi-bility, we developed VAO Checker, which integrated the
Table 7 Category of 10 accessibility problems
Category [A] [B] [C] [D] [E] [F] [G] Total
Amount 3 2 - 3 - 2 - 10
user interface and visualization information as a tool to provide users with complete information about pipeline accessibility.
Future work
Even though this research has made efforts on the pipe-line accessibility, there are still some possibilities can be worked on in the future:
Number of levels divided for each accessibility category Operational accessibility, for example, has more than one kind of controls, such as toggle switches, pushbut-tons, and rotary controls. Each demands a different level of sophistication, and might need a different de-scription for the mathematical model of operational accessibility. From the standpoint of plan amendments, VAO Checker could be much more practical tool if the Figure 15The test environment.
analysis result can show the segmented and numerical degree of accessibility.
Optimization via operators
The system we propose uses computation to suggest a suitable path by considering approachable accessibility. It might become much more usable if the pipeline’s de-signer can improve results through specific operators based on the designer’s experience. Furthermore, the tre-mendous amount of information saved in the layout database might be referenced for future optimization.
Development of pipe assembly planning
The pipe-routing design still relies on designer’s experience. We hope this system can be extended to pipe assembly planning areas for efficient implementation, which might lead to a process of automatic pipe routing. The pipeline ar-rangement will only become more complex in the future, and pipe assembly planning will help increase the effective-ness and efficiency of routing design.
Conclusion
This research developed a systematic method to evaluate the accessibility of pipeline maintenance. During the
early stage of this research, we interviewed six experts to determine the requirements of pipeline design. After combining the opinion of experts with a literature re-view, we mainly focused our research on pipeline accessi-bility during operation and maintenance, which is rarely discussed in previous studies. We first divided pipeline ac-cessibility into three categories, developed mathematical models, and discussed the ergonomic details of each different category. We then developed a system called VAO Checker, which integrated the user interface and visualization information as a tool to implement the proposed methodology. VAO Checker used a simple motion-planning algorithm to find a path with acceptable approachable accessibility, and programmed the mathemat-ical models into visualization information indicating the visual and operational accessibility. We created an example case to validate the practicality of VAO Checker, and con-ducted a usability test to evaluate the effectiveness of this tool. The result showed that it is a useful system for pipe-line designers and engineers. It considered the pipepipe-line ac-cessibility within multi-pipes and enhanced the spatial comprehension. The system can be further integrated into BIM software as an API, extended to pipe assembly plan-ning areas, or even referenced for future optimization.
Table 8 Statistical analysis of correctness
Medium Mean (%) Std. Deviation (%) p-value
2D plan drawing 40.1 16.3 2D & 3D 0.002*
3D model 56.4 25.3 2D & VAO 0.000*
VAO Checker 64.3 24.5 3D & VAO 0.139
*the data is statistically significant.
Figure 17NASA-TLX score of each medium.
Table 9 Statistical analysis of performance
Medium Mean
(points)
Std. Deviation (points)
p-value
2D plan drawing 36.0 13.5 2D & 3D 0.000*
3D model 53.8 17.0 2D & VAO 0.004*
VAO Checker 48.0 17.3 3D & VAO 0.020*
Endnotes
a
Lewis, Clarence Irving and Leibniz, Gottfried Wilhelm (1918). A survey of symbolic logic, University of California Press.
Competing interests
The authors declare that they have no competing interests.
Authors’contributions
CH developed the methodology and the mathematical models,
programmed VAO Checker, carried out the usability test, analyzed the results and drafted the manuscript. MH assisted the literature review and the usability test. SC offered suggestion and guidance to the research. All authors read and approved the final manuscript.
Acknowledgement
This research was supported in part by Taiwan’s Ministry of Economic Affairs, under contract 101-EC-17-A-15-S1-223. The authors are grateful to Mr. Ching-Yang Kao and Mr. Ming-Fa Lin of United Microelectronics Corporation (UMC), Mr. Yuan-Fu Liao and Mr. Yi-Ti Tsai of CTCI Corporation, Mr. Chien-Chih Lai of L&K Engineering Corporation and Mr. Ching-Hsien Lee of Research Center for BIM, National Taiwan University for their kind support and assistance in this research. We like to express our appreciation to the interviewees of these corporations and organizations.
Author details
1Department of Civil Engineering, National Taiwan University, Taipei, Taiwan. 2Center for Weather Climate and Disaster Research, National Taiwan University, Taipei, Taiwan.3Department of Civil Engineering, National Taiwan University, Taipei, Taiwan.
Received: 30 December 2013 Accepted: 5 June 2014
References
Biehl, WH, & Inman, JA. (2010). Energy optimization for water systems.Journal of American Water Works Association, 102, 6.
Calixto, EES, Bordeira, PG, Calazans, HT, Tavares, CAC, & Rodriguez, MTD. (2009). Plant design project automation using an automatic pipe routing routine.
Computer Aided Chemical Engineering, 27, 807–812. doi: 10.1016/S1570-7946 (09)70355-4.
Chang, HS, Kang, SC, & Chen, PH. (2009). Systematic procedure of determining an ideal color scheme on 4D models.Advanced Engineering Informatics, 23(4), 463–473. doi: 10.1016/j.aei.2009.05.002.
Chen, YH, Tsai, MH, Kang, SC, & Liu, CW. (2013). Selection and evaluation of color scheme for 4D construction models.Journal of Information Technology in Construction, 18, 1–19.
Deliang, L, & Huibiao, L. (2009). Interfere-check applying to 3D automatic pipe route arrangement.Proceedings of International Conference on Computational Intelligence and Software Engineering, Wuhan,11–13. doi:10.1109/
cise.2009.5365920.
Feng, H, Fu, Y, & Li, L. (2012). Layout space modeling for automation design of pipeline system.Proceedings of 2012 International Conference on Mechatronics and Automation (ICMA), Chengdu,5–8. doi:10.1109/icma.2012.6283259. Gao, Z, Walters, RC, Jaselskis, EJ, & Wipf, TJ. (2006). Approaches to improving the
quality of construction drawings from owner's perspective.Journal of Construction Engineering and Management, 132(11), 1187–1192. doi: 10.1061/ (asce)0733-9364(2006)132:11(1187).
Grootjans, R. (2009).XNA 3.0 Game Programming Recipes: A Problem-Solution Approach. New York: Apress.
Guirardello, R, & Swaney, RE. (2005). Optimization of process plant layout with pipe routing.Computers and Chemical Engineering, 30(1), 99–114. 10.1016/j. compehemeng.2005.08.009.
Ito, T. (1999). A genetic algorithm approach to piping route path planning.
Journal of Intelligent Manufacturing, 10(1), 103–114. 10.1023/a:1008924832167. Junnila, S, Horvath, A, & Guggemos, AA. (2006). Life-cycle assessment of office
buildings in Europe and the United States.Journal of Infrastructure Systems, 12(1), 10–17. doi:10.1061/(asce)1076-0342(2006)12:1(10).
Khanzode, A, Fischer, M, & Reed, D. (2008). Benefits and lessons learned of implementing building virtual design and construction (VDC) technologies
for coordination of mechanical, electrical, and plumbing (MEP) systems on a large healthcare project.Journal of Information Technology in Construction, 13, 324–342.
Kim, D, Corne, D, & Ross, P. (1996). Industrial plant pipe-route optimisation with genetic algorithms.Lecture Notes in Computer Science, 1141, 1012–1021. Korde, T, Wang, Y, & Russell, A. (2005).Visualization Of Construction Data(pp. 2–4).
Toronto, Canada: Proceedings of 6th Construction Specialty Conference. Kuo, CH, Tsai, MH, & Kang, SC. (2011). A framework of information visualization
for multi-system construction.Automation in Construction, 20(3), 247–262. 10.1016/j.autcon.2010.10.003.
Miller, T, & Johnson, D. (2010).XNA Game Studio 4.0 Programming: Developing for Windows Phone 7 and Xbox 360. Boston: Addison-Wesley Professional. Mitsuta, T, Kobayashi, Y, Wada, Y, Kiguchi, T, & Yoshinaga, T. (1987). A
knowledge-Based Approach To Routing Problems In Industrial Plant Design. InProceedings Of 6th International Workshop on Expert Systems & Their Applications(pp. 28–30). Avignon, France.
Nathan, A. (2006).Windows Presentation Foundation Unleashed. Indianapolis: Sams Publishing.
Newell, RG. (1972).An Interactive Approach To Pipe Routing In Process Plants
(pp. 6–10). London: Proceedings of IFIP Congress 71.
Park, JH, & Storch, RL. (2002). Pipe-routing algorithm development: case study of a ship engine room design.Expert Systems with Applications, 23(3), 299–309. 10.1016/s0957-4174(02)00049-0.
Qian, X, Ren, T, & Wang, CE. (2008). A survey of pipe routing design.Proceedings of 2008 Chinese Control and Decision Conference, Yantai, Shandong,
doi:10.1109/ccdc.2008.4598081.
Riley, DR, Varadan, P, James, JS, & Thomas, HR. (2005). Benefit-cost metrics for design coordination of mechanical, electrical, and plumbing systems in multistory buildings.Journal of Construction Engineering and Management, 131(8), 877–889. doi: 10.1061/(asce)0733-9364(2005)131:8(877).
Rourke, PW. (1975).Development of a Three-Dimensional Pipe Routing Algorithm. Lehigh University: PhD Dissertation.
Russell, AD, Chiu, CY, & Korde, T. (2009). Visual representation of construction management data.Automation in Construction, 18(8), 1045–1062. 10.1016/j. autcon.2009.05.006.
Schmidt-Traub, H, Köster, M, Holtkötter, T, & Nipper, N. (1998). Conceptual plant layout.Computers & Chemical Engineering, 1, S499–S504. 10.1016/S0098-1354 (98)00093-3.
Songer, AD, Hays, B, & North, C. (2004). Multidimensional visualization of project control data.Construction Innovation: Information, Process, Management, 4(3), 173–190. 10.1108/14714170410815088.
The American Bureau of Shipping. (2003).Guidance Notes on the Application of Ergonomics to Marine Systems. Houston: American Bureau of Shipping. Tsai, MH, Kang, SC, & Hsieh, SH. (2010). A three-stage framework for introducing a
4D tool in large consulting firms.Advanced Engineering Informatics, 24(4), 476–489. 10.1016/j.aei.2010.04.002.
Tsai, MH, Kang, SC, & Hsieh, SH. (2013). Lessons learnt from customization of a BIM tool for a design-build company.Journal of the Chinese Institute of Engineers, 37(2), 189–199. 10.1080/02533839.2013.781791.
Wang, CP. (2011).An Approach for Assessing Reachability of Wheelchair Users
(Master Thesis). National Taiwan University.
Wangdahl, GE, Pollock, S, & Woodward, JB. (1974). Minimum-trajectory pipe routing.Journal of Ship Research, 18(1), 44–49.
Zhou, C, & Yin, Y. (2010). Pipe assembly planning algorithm by imitating human imaginal thinking.Assembly Automation, 30(1), 66–74. 10.1108/
01445151011016082.
Zhu, D, & Latombe, JC. (1991). Mechanization of spatial reasoning for automatic pipe layout design.Artificial Intelligence for Engineering, Design, Analysis and Manufacturing, 5(1), 1–20. 10.1017/S089006040000250X.
doi:10.1186/s40327-014-0006-y