R E S E A R C H
Open Access
Predicting the Sixteen Personality Factors
(16PF) of an individual by analyzing facial
features
Mihai Gavrilescu
*and Nicolae Vizireanu
Abstract
We propose a novel three-layered neural network-based architecture for predicting the Sixteen Personality Factors from facial features analyzed using Facial Action Coding System. The proposed architecture is built on three layers: a base layer where the facial features are extracted from each video frame using a multi-state face model and the intensity levels of 27 Action Units (AUs) are computed, an intermediary level where an AU activity map is built containing all AUs’intensity levels fetched from the base layer in a frame-by-frame manner, and a top layer consisting of 16 feed-forward neural networks trained via backpropagation which analyze the patterns in the AU activity map and compute scores from 1 to 10, predicting each of the 16 personality traits. We show that the proposed architecture predicts with an accuracy of over 80%: warmth, emotional stability, liveliness, social boldness, sensitivity, vigilance, and tension. We also show there is a significant relationship between the emotions elicited to the analyzed subjects and high prediction accuracy obtained for each of the 16 personality traits as well as notable correlations between distinct sets of AUs present at high-intensity levels and increased personality trait prediction accuracy. The system converges to a stable result in no more than 1 min, making it faster and more practical than the Sixteen Personality Factors
Questionnaire and suitable for real-time monitoring of people’s personality traits.
1 Introduction
Greek philosophers believed that the outer appearance of people, especially their face, conveys relevant informa-tion about their character and personality. The same be-lief can be found in other cultures as well. Egyptians believed that the human face proportions are closely linked to consciousness and how feelings are expressed, while in Chinese culture, the facial structure played a major role in Daoist philosophy and was thought to re-veal information about the mental and physical state of an individual [1]. Although this practice was disputed throughout the Middle Ages and up until the nineteenth century, it has regained interest in the latest years, and several recent studies showed that facial appearance is indeed linked to different psychological processes and behaviors [2–4]. Recent research showed that people’s evaluation of others is also closely related to their phys-ical appearance, as we tend to interact with other people
based on our first impression [5], and this first impres-sion is in many ways influenced by the appearance of the people we interact with [6]. Several psychological studies also showed that our unconscious judgment of the personality traits of others during first impression plays a major role in social collaboration [7], elections [8], criminal court sentences [9], economic interactions based on trust [10], or in the healthcare industry [11].
Based on these studies, research in machine learning was also conducted to analyze the facial features of in-dividuals in order to evaluate different psychological characteristics automatically. Although at first focused on predicting the emotional state of people [12, 13], as Facial Expression Recognition (FER) systems gained momentum and started achieving acceptable prediction accuracy, recent research papers have begun using facial features analysis for more complex tasks, such as tracking and predicting eye gaze [14, 15], predicting driver atten-tion for car accident prevenatten-tion [14, 16], predicting stress levels [2, 17], diagnosing depression [3], assessing the fa-cial attractiveness of individuals [18], evaluating people’s
* Correspondence:mike.gavrilescu@gmail.com
Department of Telecommunications, University“Politehnica”of Bucharest, 1-3 Iuliu Maniu Blvd, 06107 Bucharest 6, Romania
trust [19], and predicting personality traits [4, 20–23]. All these research studies showed that the face indeed con-veys information that can be analyzed to predict different psychological features of an individual.
In this work, we focus on analyzing the relationship between the personality traits evaluated using the 16 Personality Factors (16PF) model and the facial muscle activity studied by means of the Facial Action Coding System (FACS) on subjects recorded in different emo-tional states. Our research brings several contributions to the affective computing domain. Firstly, this is the first paper that studies the 16PF traits using FACS. The only similar work that uses the 16PF methodology is presented in [23]. However, it only focuses on analyzing a set of still images using a Convolutional Neural Network (CNN) and CNN features, while our research uses the FACS methodology for studying the face, as FACS is better at predicting hidden emotions [24–26], hence will provide more accuracy and reliability to the personality prediction task knowing there is a close rela-tionship between personality traits and how emotions are expressed [27, 28]. FACS [29] also offers an in-depth analysis of the facial muscle activity by studying micro expressions and, as we use video recordings of subjects’ frontal face and not still images, our paper shows signifi-cant prediction accuracy improvement compared to [23] which we detail in the next sections. Secondly, our pro-posed work also studies the relationships between the emotions induced to the subjects involved in the tests, their facial muscle activity (the activation of the Action Units (AUs) analyzed), and their personality traits, hence provides a broader picture on how these three concepts influence each other and how their analysis can be opti-mized for achieving high prediction accuracy. As we will show in the next section, this is the first paper that con-ducts such an extensive study on 16PF traits’prediction. Lastly, we propose a novel multi-state face model archi-tecture for the personality prediction task built on three layers, introducing a novel intermediary layer where the facial muscle activity is stored in a specifically designed map and then fetched to the top layer where a set of 16 neural networks assess each of the 16 personality traits in a pattern recognition task. Such novel architecture provides the opportunity to conduct more in-depth ana-lysis of personality trait prediction and to study the rela-tionships between the three concepts mentioned before (facial muscle activity, emotion, and personality trait).
The proposed system can have a large variety of uses as it computes the personality traits in less than 1 min and can be used to monitor the personality traits of an individual in real time. It could be useful in applications for career development and counseling in the human re-sources or academic areas [30, 31], adaptive e-learning systems [32], diagnosis of mental health disorders
(borderline personality disorder [33], depression [3], schizophrenia [34], eating disorder [35] or sleep disor-ders [36]), virtual psychologist applications [37], and per-sonalized health assistance [38]. It was also shown that there are links between common physical diseases (such as heart attacks, diabetes, cancer, strokes, arthritis, hypertension, and respiratory disease) and Big Five per-sonality traits [39] such that these diseases influence the age-related personality accelerating with 2.5 years de-crease for extraversion, 5 years decrease for
conscien-tiousness, 1.6 years decrease for openness, and 1.9 years
increase for emotional stability. Therefore, by monitor-ing in real time the personality traits of an individual and spotting these changes in personality traits, we could diagnose several physical diseases. It is important to mention that personality types do not alter from one moment to another rapidly, but we usually need longer periods of time to see changes; these changes are typically associated with aging, mental, or physical diseases [39].
In the following section, we describe the state-of-the-art in the area of affective computing focusing on the re-search conducted for predicting personality traits from facial features. Next, we present the two psychological frameworks employed in this study (16PF and FACS) as well as thoroughly describe the design of the proposed architecture, illustrating each of the three layers in detail: the base layer is where facial features are collected and AUs’intensity levels are determined using specific classi-fication methods, the intermediary layer is where an AU activity map is built containing the frame-by-frame changes in intensity levels for each analyzed AU, and the top layer composed of 16 Feed-Forward Neural Net-works (FFNNs) (each of them associated to one of the 16PF traits) which take as input the AU activity map and compute a score on a scale from 1 to 10 for each per-sonality trait, in accordance with 16PF methodology. The design of these neural networks, the hyperpara-meters used, and the outputs are described in detail. We also present the database we created to test the proposed architecture and show the experimental results for both intra-subject and inter-subject methodologies. We detail as well the further tests conducted to study the patterns between the emotions induced, the facial muscle activity, and the personality trait prediction accuracy, and we share the results obtained from this analysis.
1.1 Related work
research areas, FER systems and personality trait predic-tion systems, focusing on the latter as it is more relevant to our current work.
FER systems are typically divided into two categories: FER systems based on FACS and FER systems that use other methods for face analysis. FACS is the most used approach for classifying the facial muscle activity and correlating it with the emotions expressed by the ana-lyzed subject [40–44]. It was used successfully with dif-ferent architectures and difdif-ferent classification methods. Jiang et al. [40] make use of Local Phase Quantization from Three Orthogonal Planes (LPQ-TOP) to analyze the FACS AUs divided into temporal segments and clas-sified using a set of Hidden Markov Models (HMMs). The proposed approach increases the AU classification accuracy by over 7% compared with the state-of-the-art methods. Wang et al. [41] use Dynamic Bayesian Networks (DBNs) for the AU classification task in a three-layered architecture: bottom layer (where facial feature points are extracted for each facial component), middle layer (where AUs are classified using DBNs), and a top layer (where six prototypical emotions are mapped on the classified AUs). Their proposed system shows over 70% accuracy for emotion prediction. Eleftheriadis et al. [42] employ Discriminative Shared Gaussian Process Latent Variable Models (DS-GPLVM) to solve the multi-view and view-invariant classification prob-lems. They define a discriminative manifold for facial ex-pressions that is primarily learned and only after that the expression classification task is triggered. The proposed approach shows promising results for AU classification in multi-view FER systems. Happy et al. [43] suggest the use of salient patches with discriminative features and use one-against-one classification to classify pairs of expressions. The purpose of this approach is to automate the learn-free facial landmark detection and provide better execution times. Tested on the Extended Cohn-Kanade (CK+) [44] and JAFFE [45] databases, the method shows accuracy similar to that of other state-of-the-art studies but computed significantly faster.
Regarding FER systems using other face analysis methods for predicting emotions, we mention the use of Local Directional Pattern (LDP) features [12] extracted from time-sequential depth videos, augmented using op-tical flows, and classified through Generalized Discrim-inant Analysis (GDA). The resulted LDP features are then fetched to a chain of HMMs trained to predict the six basic emotions. The proposed method outperforms the state-of-the-art by up to 8% in terms of emotion pre-diction accuracy. Genetic programming can also be used for FER [46], specifically for searching and optimizing the parameters defined for determining the location, in-tensity, and type of the emotional events, and how these are linked to each emotion. Tested on the Mars-500
database, the proposed method predicts the six basic emotions with over 75% accuracy. A rather new approach is the use of slow feature analysis (SFA) for dy-namic time-varying scenarios [47] with the main advan-tage of being able to find uncorrelated projections by means of an Expectation-Maximization (EM) algorithm. Neural networks have also been used in FER systems, specifically Long Short-Term-Memory Recurrent Neural Networks (LSTM-RMM) [15]. The proposed method de-fines a set of Continuous Conditional Random Fields (CCRF) that are used to predict emotions from both en-cephalogram (EEG) signals and facial features. The re-sults show that facial features offer better accuracy for emotion prediction, but the EEG signals convey emotion-related information that could not be found when analyzing the face. Specific descriptors have also been employed [48] with a set of soft biometric algo-rithms for predicting the age, race, and gender of the subject whose facial features are analyzed, and the ap-proach offers high accuracy when tested on two publicly available databases.
As far as personality trait prediction systems are con-cerned, despite the increasing interest in this domain in recent years, it is still understudied and only a few works have taken the challenge of designing such systems. Setyadi et al. [4] propose the use of Artificial Neural Networks (ANNs) trained via backpropagation for pre-dicting the four fundamental temperaments (sanguine,
choleric, melancholic, andphlegmatic) by analyzing a set
of facial features: the dimension of the eyes, the distance between two opposite corners of the eyes, the width of the nose, mouth and eyes, and the thickness of the lower lip. An overall prediction accuracy of 42.5% is achieved, mainly because of low-personality prediction rates for choleric and phlegmatic types. Teijeiro-Mosquera et al. [20] use the Computer Expression Recognition Toolbox (CERT) in order to find relationships between facial fea-tures and the Five-Factor Model (FFM) personality traits when analyzing the faces of 281 YouTube vloggers. Their research shows that multiple facial feature cues are correlated with the FFM personality traits, and extra-version can be predicted with 65% accuracy. Chin et al. [16] propose an exaggeration mapping (EM) method that transforms the facial motions in exaggerated motions and use them to predict the Myers-Briggs Type Indicator (MBTI) personality traits with an overall prediction accuracy of 60%.
Regarding research papers that use FACS for analyzing the face and predicting the personality type of an indi-vidual, the only such research is conducted in [21] where FFNNs are used to study the AU activity and predict the FFM personality traits. The proposed method offers over 75% prediction accuracy forneuroticism,openness to
less than 4 min. 16PF traits’correlation to facial features has also been understudied, the only such research being proposed by Zhang et al. [23]. An end-to-end CNN is built to predict the 16PF traits and intelligence. Tested on a custom-made database comprising frontal face im-ages, the method shows satisfactory prediction accuracy and reliability for only rule-consciousness and tension, while other personality traits, as well as intelligence, could not be successfully predicted. Compared to the previously described works, the current research con-ducts a more extensive study of the 16PF traits’ predic-tion by using FACS which has not been approached in any of the previous research papers. It also provides an analysis of the relationship between the emotions in-duced to the subjects involved in the tests, their facial muscle activity and their personality traits, hence offers a broader picture of the links between these three con-cepts which has not been studied before. The use of video recordings for this study is also a novelty in this area. Most research studies abovementioned make use of only still images. Video recordings provide more infor-mation about the facial activity which, analyzed using FACS, will result in better personality type prediction ac-curacy, as we show in the next sections. The three-layered architecture proposed in this paper where an AU activity map is built and fetched to a set of 16 FFNNs that predict the 16PF traits in a pattern recognition task is also a novel approach which has not been used in any other previous research paper.
2 Methods
2.1 Theoretical model
As previously mentioned, the two psychological frame-works that we employ in the current work are 16PF and FACS. We detail each of these instruments in the follow-ing subsections.
2.1.1 16PF
16PF is a psychometric self-report personality question-naire developed by R. B. Cattell and A. D. Mead [49] and is generally used by psychologists for diagnosing mental disorders and planning therapies for individuals (as 16PF offers the ability to measure anxiety and psychological problems), for career counseling and vocational guidance [50, 51], operational selection [50], predicting couple com-patibility [51], or studying academic performance of stu-dents [50]. We have chosen 16PF in our research because it was thoroughly tested and is highly utilized by clini-cians, being translated in over 30 languages and dialects and used internationally [49].
16PF originates from the five primary traits, similar to FFM, but the main difference is that 16PF extends the scoring on the second-order traits as well, providing multi-leveled information describing the personality
profile of the human subject [49]. Cattell mentions that at the basis of 16PF stand the individual differences in cognitive abilities, the transitory emotional states, the normal and abnormal personality traits, and the dynamic motivational traits [52]. Because of this, the 16PF ques-tionnaire asks routine, concrete questions instead of ask-ing the respondents to self-assess their personality, therefore removing the subjectivity and self-awareness of the subject. Filling in the 16PF questionnaire usually takes between 25 and 50 min and is designed for adults at least 16 years of age [49]. The 16PF traits evaluated using this questionnaire are the following:
– Warmth(A), reserved/warm
– Reasoning(B), concrete thinking/abstract thinking
– Emotional stability(C), reactive/emotionally stable
– Dominance(E), submissive/dominant
– Liveliness(F), serious/lively
– Rule consciousness(G), expedient/rule conscious
– Social boldness(H), shy/bold
– Sensitivity(I), unsentimental/sensitive
– Vigilance(L), trusting/vigilant
– Abstractedness(M), practical/abstracted
– Privateness(N), forthright/shrewd
– Apprehension(O), self-assured/apprehensive
– Openness to change(Q1), traditional (conservative)/ open-to-change
– Self-reliance(Q2), group-dependent/self-reliant
– Perfectionism(Q3), tolerates disorder/perfectionistic
– Tension(Q4), relaxed/tense
All these traits are evaluated using a score from 1 to 10 (e.g., for traitwarmth, 1 means “reserved,” 10 means “warm,”and any score in between is a nuance within the two extreme values). The abovementioned 16PF traits can also be grouped into five factors (except for reason-ingwhich is treated separately) [49] as follows:
– Introversion/extraversion:A, F, H, N, and Q2
– Low anxiety/high anxiety:C, L, O, and Q4
– Receptivity/tough-mindedness:A, I, M, and Q1
– Accommodation/independence:E, H, L, and Q1
– Lack of restraint/self-control:F, G, M, and Q3
interpret the results while predicting the 16PF traits from facial features is done automatically and ad hoc with significantly less effort from both the subject and the psychologist’s sides.
2.1.2 FACS
To analyze the facial muscle activity in correlation with the 16PF traits, we used FACS [29], a system developed by Eckman and Friesen in 1978. FACS defines a set of AUs which are closely related to the movement of spe-cific facial muscles and are activated in different ways when the subject is expressing different emotions. We use FACS in our current work as it proved to be a reli-able model for determining real emotions (even when subjects are trying to act different ones, as the residual facial activity conveying the“real”emotions is persisting in most cases [24–26]); hence, it provides more robust-ness and ensures that we are analyzing the emotion-relevant information.
FACS is composed of 46 AUs which are typically divided into two large categories [44]:
– Additive; when the AU is activated, it determines the activation of another AU or group of AUs. All AUs involved in this activity are grouped in a structure called Action Unit Cluster (AUC).
– Non-additive; the activation of an AU is independent of the activation of any other AU.
In the latest revision of FACS 2002 [53], several AUs can also be evaluated in terms of intensity, using the fol-lowing levels: A - Trace(classification score between 15 and 30), B - Slight (classification score between 30 and
50),C - Marked and pronounced(classification score
be-tween 50 and 75), D - Severe or extreme (classification score between 75 and 85), E - Maximum (classification score over 85), andO - AU is not present (classification score below 15). Because the task of personality trait prediction is a complex one and the output of the sys-tem consists of 16 scores from 1 to 10 for each of the 16PF traits, we need to have a scaled input as well in-stead of a binary one in order to convey all the slight changes in facial muscle activity from each video frame. For this purpose, in our current research, we will analyze
only AUs for which intensity levels have been described in the latest FACS revision.
2.2 Proposed architecture
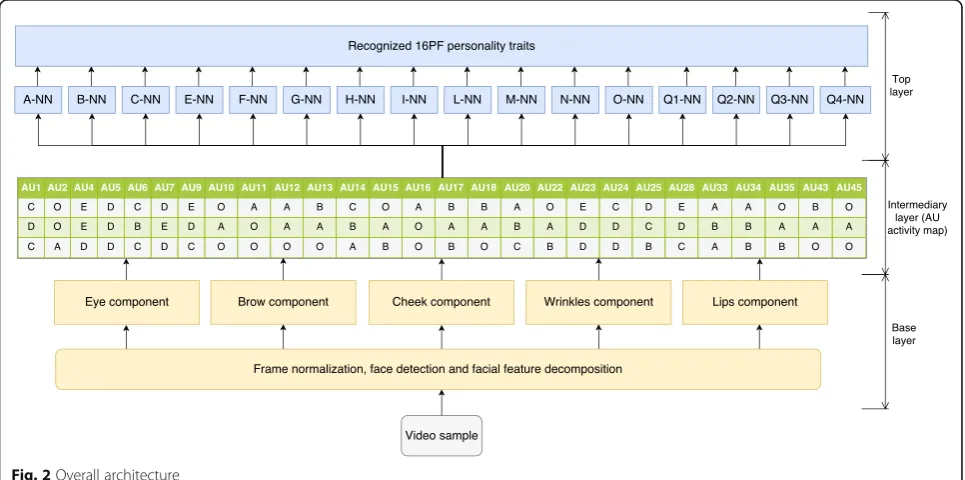
To study the relationships between the emotions in-duced in the test subject, the facial muscle activity and the personality trait prediction accuracy, we designed a neural network-based architecture on three layers:
– The base layer; facial features are extracted from each frame in the video samples, and a set of classifiers is used to compute the AU classification scores.
– The intermediary layer; an AU activity map is built containing the AU classification scores computed in the base layer for each frame from the analyzed video sample.
– The top layer; a set of FFNNs is used to predict the scores for all 16PF traits.
In the following subsections, we describe each of these layers in detail.
2.2.1 The base layer
The base layer is designed for extracting the facial features from each video frame and for translating them into AU classification scores representing the intensity level of each AU. We use a multi-state face model for facial features ex-traction and AU classification, similar to the one pre-sented in our previous work [54], dividing the face into five components: eye component, cheek component, brow component, wrinkles component, and lips component. The face segmentation is depicted in Fig. 1.
Out of the 46 AUs, only 30 AUs are anatomically re-lated to the contractions of specific facial muscles: 12 for the upper face and 18 for the lower face [44]. From these two categories in our current work, we only analyze the following AUs:
– Fromthe upper face, we analyzeAU1(inner brow raiser),AU2(outer brow raiser),AU4(brow lowerer), AU5(upper lid raiser),AU6(cheek raiser),AU7 (lid tightener),AU43(eyes closed), andAU45(blink).
– Fromthe lower face, we analyzeAU9(nose
wrinkler),AU10(upper lip raiser),AU11(nasolabial
deepener),AU12(lip corner puller),AU13
(sharp lip puller),AU14(dimpler),AU15(lip corner depressor),AU16(lower lip depressor),AU17 (chin raiser),AU18(lip pucker),AU20 (lip stretcher),AU22(lip funneler),AU23
(lip tightener),AU24(lip pressor),AU25(lips part), andAU28(lip suck).
We have excluded AU41 (lid droop), AU42 (slit), AU44 (squint), and AU46 (wink) from the upper face AUs and AU26 (jaw drop) and AU27 (mouth stretch) from the lower face AUs as these were not coded with criteria of intensity in the latest FACS revision and, as mentioned before, as the 16PF traits’ prediction is a complex task with a scaled output, we need a scaled in-put as well, to have enough information for the 16 FFNNs to predict with high accuracy the 16PF traits’ scores. Moreover, these AUs are part of the standard set used in the majority of FER systems based on FACS [40–42]. Apart from these 24 AUs, we also analyze AU33 (cheek blow), AU34 (cheek puff ), and AU35 (cheek suck) in order to have more input from the cheek component. These three AUs have been coded with cri-teria of intensity in the latest FACS revision. Note that the system can be extended and other AUs that can be described with intensity criteria could also be used, but we have limited our research to only these 27 AUs in order to avoid overcomplicating the system as well as overfitting the FFNNs. Another reason for using only this set of 27 AUs is that all can be classified with over 90% accuracy using fairly simple methods and provide the basis for reliable personality trait prediction results, while other AUs typically add either more complexity or the classification scores are lower. Also, we needed to make sure that all the AUs that we are analyzing are coded in the CK+ database which we use for AUs’ classification training and testing, hence why we settled with only these 27 AUs which are properly annotated in CK+ database.
For each of the five face components, we use specific features and classifiers to determine the presence/ab-sence as well as the intensity of every analyzed AU. The features, classification methods, and AUs analyzed in each component are detailed below:
– Eye component; Gabor jets-based features have been successfully used for analyzing the eye features providing classification rates of over 90% as well as fast convergence, surpassing other state-of-the-art methods [45,55,56]. Because of these strong points, we use them in our work as well, alongside with Support Vector Machines (SVMs) for the AU classification task. The AUs classified in the eye component areAU5,AU7,AU43, andAU45.
– Brow component; we also use Gabor jets-based features as these have been shown to offer the best performance for classifying AUs from the brow component [57,58], and we use SVMs for the AU classification task. The AUs classified in the brow component areAU1,AU2, andAU4.
– Cheek component; we use a combination of Feature Point Tracking (FPT) methods and HMMs as they provide the highest accuracy for classifying AUs from the cheek component [59]. AUs classified in the cheek component areAU6,AU11,AU14,AU33, AU34, andAU35.
– Lip component; we use Local Binary Pattern (LBP) features as they have been shown to provide the highest classification accuracy for AUs pertaining to the lip component compared to state-the-of-the-art methods [60]. LBP features also have the advantage of not needing manual initializations and can run in real time. They also do not require images with high resolution and are relatively simple from a computational point of view, which is a strong point considering that the lip component have the highest AU density. As used in [60], we employ SVMs for the AU classification task. The AUs classified in the lips component areAU10,AU12,AU13,AU15, AU16,AU17,AU18,AU20,AU22,AU23,AU24, AU25, andAU28.
– Wrinkles component; we employ the Gabor Wavelet feature extraction technique which has been shown to provide the highest classification accuracy for evaluating AUs associated with the wrinkles component [60]. The AUs analyzed in the wrinkles component are AU5,AU7, andAU9.
All these five components output the AUs’ classifica-tion scores for all 27 analyzed AUs and for each frame in the video sample. It is important to mention that we have analyzed each of the 27 AUs independently in this layer as it is complicated to predefine general AUCs that will appear in all test scenarios and for all subjects. These possible AU linear dependencies will be deter-mined through training the FFNNs and the AUs in this situation will be treated as a single input.
2.2.2 The intermediary layer
The intermediary layer is designed for collecting the AUs’ classification scores from the base layer and for constructing an AU activity map. The AU activity map is, in turn, provided as an input to the 16 FFNNs in the top layer which analyze it in a pattern recognition task and predict the 16PF traits’scores.
means thatAU1has anintensity level C. From the previ-ous subsection, it can be observed that the two AUs have been classified in both eye and wrinkle components by different classifiers (AU5, AU7) because they contain relevant information for both of these components. For these two AUs, the entry in the AU activity map is the highest intensity score obtained out of the two classifiers used. We have taken this decision in order to keep the meaningful information in the AU activity map instead of bypassing the AU or considering it less active.
2.2.3 The top layer
The top layer is designed to analyze the facial muscle ac-tivity collected in the AU acac-tivity map, in a pattern recog-nition task, and output a score from 1 to 10 for each of the 16PF traits, in accordance with the 16PF framework. To accomplish this, we have defined 16 FFNNs denoted as follows: warmth (A) - neural network (A-NN), reasoning (B) neural network (BNN), emotional stability (C) -neural network (C-NN), dominance (E) - -neural network (E-NN), liveliness (F) - neural network (F-NN), rule-consciousness (G) - neural network (G-NN), social bold-ness (H) - neural network (H-NN), sensitivity (I) - neural network (I-NN), vigilance (L) - neural network (L-NN), abstractedness (M) - neural network (M-NN), privateness (N) - neural network (P-NN), apprehension (O) - neural network (O-NN), openness to change (Q1) - neural network (Q1-NN), self-reliance (Q2) - neural network (Q2-NN), perfectionism (Q3) - neural network (Q3-NN), and tension (Q4) - neural network (Q4-NN).
Because the task to compute the 16PF traits’ scores from the AU activity map is a pattern recognition task and the architecture employed is bottom-up with no feedback loops, we use FFNNs which have been proven effective for pattern recognition [61].
All 16 FFNNs have three layers: the input layer, one hidden layer, and the output layer. The input layer con-tains 30 consecutive rows from the AU activity map. Each row in the AU activity map corresponds to a video frame, and we consider 30 consecutive rows because these pertain to 1 s (for a frame rate of 30 frames per second (fps) as the one we use) which is high enough to catch the micro expressions that last on average 500 ms as well as low enough to avoid overfitting the FFNNs. As we have 27 AUs for each of the 30 frames in the AU activity map, each FFNN has 810 input nodes. The AU intensity levels from the AU activity map are normalized in the [0,1] interval with the following rule:level A= 0.2,
level B = 0.4, level C= 0.6, level D= 0.8, level E= 0.9,
while the absence of an AU (level O) has the value 0. The output layer for each of the 16 FFNNs has only one node as it computes a score from 1 to 10 for each of the 16PF traits.
For calculating the number of hidden nodes for each FFNN, we denote xA= {xAi} , i = 1 , 2…P an N-dimensional set of input vectors for the A-NN, such as xA= [xA1, xA2…xAN]T, YA= {yAi} , i = 1 , 2…P a one-dimensional set of output vectors (as we have only one output node), WAH(matrix of weights between input and hidden nodes), WAO(matrix of weights between hidden nodes and output nodes), L the number of hidden nodes, and fA1a and fA2a activation functions. The expres-sion form can be written as below (1):
yA¼fA2a
XL
l¼0
wAOl fA1a
XN
n¼0
wAHnlxAn
" #
1
ð Þ
The same logic is applied for all 16 FFNNs.
As a training method, we use backpropagation as it is known to offer the best performance for pattern recogni-tion tasks [62]. The input data is sent to the input layer neurons and then fetched to the hidden neurons which in turn compute a weighted sum of the inputs and fetch this to the output layer through an activation function. When the output is obtained, the difference between the expected output and the one determined is computed in terms of Average Absolute Relative Error (AARE) (2) based on which the WAHand WAO weight matrices are tuned in order to minimize the AAREA:
AAREA¼1
P
XP
i¼1
yA i−yAe;i
yA e;i
!
ð Þ2
– A-NN; hidden nodes 72, learning rate 0.02, weight decay 0.001, training epochs 30,000
– B-NN; hidden nodes 76, learning rate 0.02, weight decay 0.001, training epochs 30,000
– C-NN; hidden nodes 57, learning rate 0.01, no weight decay needed, training epochs 35,000
– E-NN; hidden nodes 66, learning rate 0.015, weight decay 0.0005, training epochs 32,000
– F-NN; hidden nodes 79, learning rate 0.02, weight decay 0.001, training epochs 30,000
– G-NN; hidden nodes 68, learning rate 0.015, weight decay 0.0005, training epochs 28,000
– H-NN; hidden nodes 81, learning rate 0.02, weight decay 0.001, training epochs 33,000
– I-NN; hidden nodes 58, learning rate 0.01, no weight decay needed, training epochs 28,000
– L-NN; hidden nodes 72, learning rate 0.02, weight decay 0.001, training epochs 30,000
– M-NN; hidden nodes 68, learning rate 0.015, weight decay 0.005, training epochs 28,000
– N-NN; hidden nodes 74, learning rate 0.02, weight decay 0.001, training epochs 32,000
– O-NN; hidden nodes 69, learning rate 0.015, weight decay 0.0005, training epochs 35,000
– Q1-NN; hidden nodes 55, learning rate 0.01, no weight decay needed, training epochs 30,000
– Q2-NN; hidden nodes 66, learning rate 0.015, weight decay 0.0005, training epochs 28,000
– Q3-NN; hidden nodes 60, learning rate 0.015, weight decay 0.0005, training epochs 30,000
– Q4-NN; hidden nodes 49, learning rate 0.01, no weight decay needed, training epochs 32,000
2.2.4 Overall architecture
The platform used for implementing the above described neural network-based architecture is Scala (as program-ming language) using Spark MLib library. Implementa-tion is done on a standard Java Virtual Machine (JVM), and Eclipse is used as an Integrated Development Envir-onment (IDE). The complexity of the program is around 90,000 code lines, and training the FFNNs is done in parallel and lasts an average 3 h; the maximum time be-ing around 5 h for N-NN and F-NN trained in inter-subject methodology. The JVM is running on a system with Intel i7 processor, 8 GB of RAM memory, and using Linux Solaris 11.3 as an operating system.
2.2.4.1 16PF-FACS database As described in the previ-ous subsections, currently, there is no standard database that will relate face, emotions, and 16PF traits; hence, we built our own by recording the frontal face of 64 sub-jects in different emotional conditions. In the following section, we will refer to as controlled scenarios––the cases where the subject is recorded while watching
videos designed to elicit one of the six basic emotions
(sadness, fear, happiness, anger, surprise, disgust), and
random scenarios––the cases where the subject is
re-corded when watching neutral (non-emotion eliciting) videos. It is important to mention that these neutral vid-eos might trigger different emotions to the subjects watching them, but not in a controlled manner and similar to the randomness of emotions triggered in any non-emotion eliciting environment. Recordings are re-peated six times in 3 months and every time the subject is asked to take the 16PF questionnaire for evaluating their 16PF traits in the day their face is recorded. There-fore, for each of the 64 subjects, we have 36 frontal face video recordings where emotion is induced (six for each of the six emotions), 30 frontal face video recordings in random scenarios (no emotion is elicited), and six 16PF questionnaire results. The frame rate used for the video recordings is 30 fps. The individuals that took part in this experiment were 64 Caucasian subjects, 32 males, and 32 females, with ages between 18 and 35, participating in accordance with the Helsinki Ethical Declaration [65].
The videos employed for stimulating the subject’s emotion are collected from the LIRIS-ACCEDE data-base [66], as this is the only publicly available datadata-base that provides the induced valence and arousal axes for each video, the annotations being consistent despite the broad diversity of subjects’ cultural background. Because each video in the LIRIS-ACCEDE database has between 8 and 12 s, we combine more videos for the same emotion in a 1-min video compilation as our application needs longer recordings of the subject’s emotion for both training and testing.
2.2.4.2 Training phase The training phase can be di-vided into two stages:AU classifiers’training(base layer
training) and the16 FFNNs’training(top layer training).
of the classified AU for each frame in the video sample and fetches the result to the intermediary layer where the AU activity map is built. When 30 new rows are computed in the AU activity map pertaining to 30 con-secutive frames from the video sample, they are fetched to the 16 FFNNs in the top layer which are trained via backpropagation in order to offer the same results as the ones obtained via the 16PF questionnaire in the same day the video sample used for training was recorded. When AARE is low enough (0.01), and the training sam-ples are exhausted, the training is complete, and the sys-tem is ready to be tested. The overall architecture can be seen in Fig. 2.
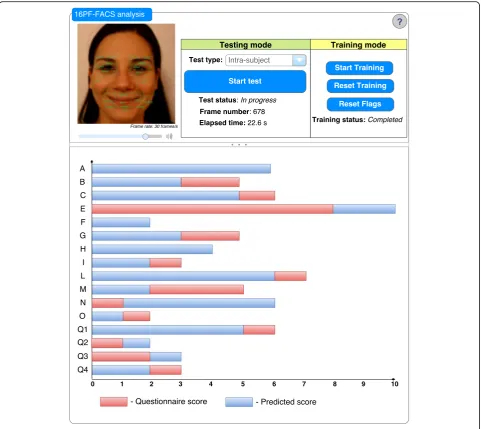
2.2.4.3 Testing phase With the AU classifiers and the FFNN trained, the system is ready to be tested. Hence, frontal face video recordings of subjects are provided as input to the base layer. The logic is similar to the one for the training phase. The video sample is first normal-ized, and then, the face and its components are detected using the Viola-Jones detection algorithm [68, 69]. The facial features are again extracted from each frame and for each face component and fetched to the AU classi-fiers which determine the intensity levels for each of the 27 AUs and fetch them to the AU activity map. When 30 new rows exist in the AU activity map, they are pro-vided as an input to each of the 16 FFNNs, and each FFNN computes a score from 1 to 10. When the score becomes stable (has the same value for 10 s––300 consecutive frames) the process stops, and the personal-ity trait prediction results are provided as an output. In Fig. 3, a screenshot of the application is shown which
depicts how, at a random video frame, the 16PF predicted traits compare with the results obtained from filling in the 16PF questionnaire.
3 Results and discussion
3.1 AU classification tests
To create the conditions for achieving high personality prediction accuracy, we need to ensure that all 27 AUs are classified with over 90% accuracy in cross-database tests. For this, we performed several cross-database tests on MMI [67], CK+ [44], and JAFFE [45] databases, and in all these tests, we obtained classification rates higher than 90%. Results are detailed in Table 1.
Lower classification rates are observed when JAFFE database is used either for testing or training, mainly be-cause the Japanese facial structure slightly differs from that of the Caucasian subjects that are present in larger numbers in the MMI and CK+ databases. Because in our case, we test the proposed architecture only on Caucasian subjects, the over 93% average AU classification rates for MMI–CK+ cross-database tests offer a solid foundation for evaluating the architecture on the far more complex task of personality traits’ prediction. Therefore, we keep the AU classifiers trained on CK+ database and continue with the 16PF traits’prediction tests.
3.2 Personality prediction tests
For testing the proposed architecture and analyzing the relationships between the emotions induced, the facial muscle activity, and the 16PF traits, we employed the 16PF-FACS database that we described in the previous section. In the next sections, we discuss the results
obtained when conducting tests using intra-subject and inter-subject methodologies.
3.2.1 Intra-subject methodology
Intra-subject methodology implies that the architecture is trained and tested with video recordings pertaining to the same subject. It is important to mention that the 16PF questionnaire results differed for the same subject over the course of 3 months; hence, our database con-tains relevant datasets to train and test the system using this methodology.
As we have 36 frontal face video recordings in con-trolled scenarios and 30 frontal face video recordings in random scenarios for each subject as well as six 16PF questionnaire results collected at intervals of 2 weeks, we can use different combinations of these recordings in
order to analyze the relationship between the emotions induced and the prediction accuracy for the 16PF traits. We first train the proposed architecture on 12 video re-cordings acquired in controlled scenarios and test it on the remaining 24 samples acquired in the same condi-tions, and we repeat this test for all combinations of such video recordings pertaining to the subject analyzed. We then increase the number of training samples to 18, making sure that we have at least three samples for each emotion, and we test the system on the remaining 18 samples, and, lastly, we train the system on 24 video samples (four samples for each emotion) and test it on the remaining 12 samples. A similar approach is used for the video recordings acquired in random scenarios. In addition to these tests done on samples that are either acquired in controlled scenarios or random scenarios,
we also perform a cross-dataset test; hence, we train the system on video recordings acquired in controlled sce-narios (where a particular emotion is elicited), and we test it on video recordings acquired in random scenarios (where no emotion is elicited) and vice-versa. All these tests are repeated for all the 64 subjects, and results are displayed in Table 2.
Analyzing the results, we observe that the highest pre-diction accuracy is obtained when the video recordings acquired in controlled scenarios are used for both train-ing and testtrain-ing, more precisely when the number of training samples is the highest. In this case, we obtain over 80% prediction accuracy for warmth, emotional
stability, liveliness, social boldness, sensitivity, and
vigilanceas well as over 75% prediction accuracy for rule
consciousness and tension while for other 16PF traits the prediction accuracy is 60–70%. When video record-ings acquired in random scenarios are used in both training and testing phases, the 16PF prediction accuracy is 4% lower. We obtain 75% prediction accuracy for
warmth, emotional stability, liveliness, social boldness, sensitivity, and vigilance and close to 70% prediction ac-curacy for rule consciousness and tension. As we have seen, a prediction accuracy increase of 4% when using the video recordings collected in controlled scenarios. This indicates that there is a relationship between the 16PF traits and the facial muscle activity elicited by the induced emotion that is adding more value to the overall 16PF traits’prediction accuracy.
When the system is trained on video recordings acquired in controlled scenarios and tested on the ones acquired in random scenarios, we also observe an improvement of up to 6% compared to the tests where the samples collected in random scenarios are used for training and the ones collected in controlled scenarios are employed for testing and only a 2% decrease com-pared to the case where video recordings acquired in controlled scenarios are used for both training and test-ing. This shows that the frontal face recordings acquired when a specific emotion was induced add more value in
Table 1AUs’classification rates for different cross-database tests
Training database MMI [67] MMI [67] CK+ [44] CK+ [44] JAFFE [45] JAFFE [45]
Test database CK+ [44] JAFFE [45] MMI [67] JAFFE [45] MMI [67] CK+ [44]
AU1(classification rate) [%] 94.31 ± 0.54 90.23 ± 0.61 91.01 ± 0.51 90.51 ± 0.81 90.31 ± 0.95 90.71 ± 1.05
AU2 (classification rate) [%] 95.41 ± 0.41 91.24 ± 0.62 93.23 ± 0.42 92.43 ± 0.62 93.22 ± 0.43 92.13 ± 0.51
AU4(classification rate) [%] 96.40 ± 0.64 91.32 ± 0.83 95.02 ± 0.63 92.33 ± 0.83 92.23 ± 0.75 91.43 ± 0.62
AU5(classification rate) [%] 97.41 ± 0.33 92.34 ± 0.44 91.33 ± 0.44 92.14 ± 0.45 91.44 ± 0.52 91.52 ± 0.75
AU6(classification rate) [%] 93.62 ± 0.32 91.46 ± 0.45 92.43 ± 0.21 91.34 ± 0.58 92.21 ± 0.65 91.11 ± 0.74
AU7(classification rate) [%] 94.42 ± 0.42 94.27 ± 0.46 92.04 ± 0.34 91.13 ± 0.33 91.11 ± 0.45 92.14 ± 0.55
AU10(classification rate) [%] 93.11 ± 0.41 91.21 ± 0.34 91.54 ± 0.32 91.31 ± 0.25 91.52 ± 0.42 91.24 ± 0.54
AU11(classification rate) [%] 95.23 ± 0.32 92.12 ± 0.63 91.13 ± 0.35 93.21 ± 0.35 92.11 ± 0.48 91.12 ± 0.65
AU12(classification rate) [%] 93.21 ± 0.24 92.12 ± 0.52 91.22 ± 0.38 93.20 ± 0.38 90.11 ± 0.44 90.41 ± 0.55
AU14(classification rate) [%] 94.24 ± 0.25 91.23 ± 0.31 91.33 ± 0.41 92.22 ± 0.35 94.53 ± 0.45 93.23 ± 0.56
AU15(classification rate) [%] 94.34 ± 0.26 92.35 ± 0.42 91.15 ± 0.47 92.20 ± 0.57 91.44 ± 0.73 93.25 ± 0.83
AU16(classification rate) [%] 94.23 ± 0.47 92.22 ± 0.63 93.22 ± 0.48 94.32 ± 0.67 92.22 ± 0.76 94.32 ± 0.82
AU17(classification rate) [%] 95.12 ± 0.33 91.23 ± 0.51 94.12 ± 0.51 90.53 ± 0.71 91.34 ± 0.6 92.01 ± 0.75
AU18(classification rate) [%] 93.21 ± 0.26 91.53 ± 0.52 92.41 ± 0.44 91.34 ± 0.52 93.27 ± 0.56 92.22 ± 0.65
AU20(classification rate) [%] 94.44 ± 0.23 93.35 ± 0.54 92.25 ± 0.44 92.53 ± 0.44 92.58 ± 0.55 92.11 ± 0.61
AU22(classification rate) [%] 95.32 ± 0.32 94.12 ± 0.62 94.43 ± 0.58 94 ± 0.78 92.26 ± 0.95 90.65 ± 0.85
AU23(classification rate) [%] 97.31 ± 0.41 93.23 ± 0.41 92.32 ± 0.42 92.34 ± 0.76 92.54 ± 0.75 92.43 ± 0.82
AU24(classification rate) [%] 94.14 ± 0.33 92.15 ± 0.52 91.33 ± 0.42 91.44 ± 0.64 90.95 ± 0.65 90.53 ± 0.73
AU25(classification rate) [%] 93.33 ± 0.45 91.32 ± 0.51 91.75 ± 0.44 92.11 ± 0.74 92.01 ± 0.75 91.32 ± 0.82
AU28(classification rate) [%] 95.32 ± 0.36 93.23 ± 0.45 93.44 ± 0.35 92.12 ± 0.78 91.22 ± 0.85 91.41 ± 0.83
AU33(classification rate) [%] 94.24 ± 0.22 92.15 ± 0.57 92.32 ± 0.47 92.33 ± 0.75 93.14 ± 0.82 92.13 ± 0.84
AU34(classification rate) [%] 94.22 ± 0.41 92.23 ± 0.55 92.31 ± 0.45 93.31 ± 0.65 91.23 ± 0.73 91.45 ± 0.78
AU35(classification rate) [%] 95.41 ± 0.34 95.24 ± 0.43 93.42 ± 0.34 95.51 ± 0.65 92.45 ± 0.72 93.22 ± 0.75
AU43(classification rate) [%] 96.24 ± 0.21 93.25 ± 0.62 92.35 ± 0.52 91.33 ± 0.85 92.46 ± 0.83 95.45 ± 0.9
the testing phase. This is a significant finding if we con-sider this system’s applicability for real-time applications where the testing is done ad hoc, as it shows that the controlled scenarios are only necessary for the training stage and, once the system is trained, it will return satis-factory results in random situations. The fact that, when video recordings collected in both controlled and ran-dom scenarios are used together for testing and training, the prediction accuracy only reduces by 1% compared to when the samples acquired in the controlled scenario are used for training, and the ones collected in random scenarios are used for testing also sustains this finding.
Regarding processing time, the highest is obtained when samples from both scenarios are used in both training and testing. In this case, the time needed to converge to a stable result is 50 s. When samples acquired in controlled scenarios are used for both phases, the average conver-gence time is 30 s, while when samples acquired in random scenarios are used for both training and testing, the convergence time increases with 10 s.
We also conduct a test to determine how the six in-duced emotions are correlated with each of the 16PF traits’ prediction accuracy. For this, we train the system on 35 samples acquired in the controlled scenario, and we test it on the remaining sample with a leave-one-out approach, repeating the test until all 36 samples are used for testing and averaging the accuracy for each of the 16PF traits. The test is repeated for all 64 subjects, and the averaged results are detailed in Table 3.
As it can be observed, several correlations can be found between some of the 16PF traits and the emotions induced:
– Inducinghappinessorangerleads to over 88% prediction accuracy forwarmth
– Inducinghappinessorsadnessleads to over 88% prediction accuracy foremotional stability
– Inducinghappinessorsurpriseleads to over 86% prediction accuracy forliveness
– Inducinghappinessorfearleads to over 88% prediction accuracy forsocial boldness
– Inducinghappinessorangerleads to over 88% accuracy forsensitivity
– Inducingfearordisgustleads to over 87% prediction accuracy forvigilance
– Inducingangerorfearleads to over 87% prediction accuracy fortension
For other 16PF traits, there is no clear relationship between the emotion elicited and high 16PF traits’ prediction accuracy.
3.2.2 Inter-subject methodology
Inter-subject methodology refers to training the pro-posed architecture on multiple subjects and testing it on a brand new subject. Similar to the intra-subject meth-odology, we train the system using a leave-one-out approach, first on 32 subjects and test it on the remaining 32, then on 48 subjects and test it on the remaining 16, and, lastly, on 63 subjects and test it on the remaining one. The tests are repeated until all com-binations of 64 subjects go through the testing phase. We use the same approach as in intra-subject method-ology, training and testing the proposed architecture on samples acquired in controlled scenarios, samples
Table 316PF traits’prediction accuracy for intra-subject tests based on test sample induced emotion
Emotion induced Happiness Anger Fear Disgust Surprise Sadness
Prediction accuracy (%) Warmth 89.51 ± 0.32 85.54 ± 0.25 76.54 ± 0.45 88.21 ± 0.26 72.12 ± 0.33 74.41 ± 0.37
Reasoning 70.13 ± 0.33 73.35 ± 0.37 74.33 ± 0.43 72.32 ± 0.45 70.23 ± 0.36 71.13 ± 0.34
Emotional stability 88.23 ± 0.21 74.45 ± 0.35 67.21 ± 0.51 65.23 ± 0.43 65.52 ± 0.46 89.02 ± 0.27
Dominance 65.28 ± 0.42 73.34 ± 0.32 73.24 ± 0.45 65.32 ± 0.42 66.21 ± 0.44 66.44 ± 0.52
Liveliness 86.27 ± 0.34 76.43 ± 0.45 74.35 ± 0.47 72.21 ± 0.45 87.02 ± 0.24 73.34 ± 0.42
Rule-consciousness 72.24 ± 0.36 72.13 ± 0.43 69.35 ± 0.35 69.22 ± 0.54 70.21 ± 0.36 70.22 ± 0.51
Social boldness 88.86 ± 0.26 79.32 ± 0.23 90.04 ± 0.22 67.43 ± 0.52 72.23 ± 0.35 71.16 ± 0.42
Sensitivity 88.95 ± 0.32 91.05 ± 0.21 78.05 ± 0.32 72.35 ± 0.38 74.44 ± 0.37 72.37 ± 0.37
Vigilance 75.53 ± 0.32 73.23 ± 0.34 87.53 ± 0.32 87.33 ± 0.28 78.45 ± 0.28 72.13 ± 0.38
Abstractedness 63.31 ± 0.42 65.54 ± 0.42 68.04 ± 0.38 70.04 ± 0.34 67.52 ± 0.43 67.42 ± 0.45
Privateness 68.57 ± 0.43 67.25 ± 0.52 66.53 ± 0.42 64.33 ± 0.52 70.04 ± 0.41 65.58 ± 0.52
Apprehension 70.35 ± 0.45 72.65 ± 0.43 68.44 ± 0.45 67.42 ± 0.46 70.22 ± 0.37 70.33 ± 0.45
Openness to change 60.24 ± 0.52 59.33 ± 0.35 65.51 ± 0.47 62.21 ± 0.45 63.23 ± 0.52 61.68 ± 0.35
Self-reliance 70.05 ± 0.45 65.24 ± 0.45 66.23 ± 0.51 67.32 ± 0.47 61.11 ± 0.54 59.33 ± 0.65
Perfectionism 59.95 ± 0.55 60.05 ± 0.34 60.05 ± 0.55 65.04 ± 0.51 62.06 ± 0.64 63.05 ± 0.55
acquired in random scenarios, and combinations of the two datasets. Results are averaged and are detailed in Table 4.
As it can be observed, we have similar results as the ones obtained in intra-subject methodology. The high-est 16PF traits’ prediction accuracy is obtained when 63 subjects are used in the training phase, and the pro-posed architecture is tested on the remaining subject, in both phases using samples acquired in controlled scenarios. In this case, we obtain 84% prediction accur-acy for sensitivity, 82.2% prediction accuraccur-acy for social boldness, 80.4% prediction accuracy for liveliness and warmth, 80.3% prediction accuracy for emotional sta-bility, and over 75% prediction accuracy for vigilance and tension. Similarly, when samples acquired in ran-dom scenarios are used for training and testing, the prediction accuracy for all 16PF traits decreases with up to 4%.
When we use samples acquired in controlled scenar-ios for training and samples acquired in random sce-narios for testing, we also observe an increase of up to 4% compared to when the samples acquired in random scenarios are used for both training and testing. The same conclusion as the one drawn in intra-subject methodology can be formulated here: the video record-ings acquired in controlled scenario add more value to the prediction accuracy if they are used in the training phase. This emphasizes the applicability of this approach in real-time applications where the 16PF traits need to be evaluated ad hoc, as the need for con-trolled scenarios is only vital when training the system, while for testing, we can use video recordings acquired in totally random scenarios. The fact that the same finding is observed in both intra-subject and inter-subject methodology shows that the proposed architec-ture is robust across different testing methodologies.
Regarding the processing time, the highest conver-gence time that the 16 FFNNs needed to compute the 16PF traits is obtained when samples acquired in both controlled and random scenarios are used for both training and testing; in this case, it reaches an average of 58 s. Similarly to the intra-subject methodology, when the samples acquired in the controlled scenario are used for both training and testing, the maximum time needed to compute the 16PF predicted traits was 33 s, while when samples acquired in random scenarios are used, the time to converge is 12 s higher. This means that every maximum of 1 min, the proposed architecture computes the predicted 16PF traits and, knowing that personality traits usually change over larger periods of time, this makes our approach suitable for real-time monitoring as well as offers the advan-tages of being faster and easier to assess the 16PF traits than the 16PF questionnaire.
We conduct the same analysis as in intra-subject methodology, evaluating the relationships between the induced emotions and each of the 16PF traits’prediction accuracy in inter-subject methodology. Results are detailed in Table 5.
We reached similar conclusions as in intra-subject tests:
– Inducinghappinessorangerleads to over 85% prediction accuracy forwarmth
– Inducinghappinessorsadnessleads to over 85% prediction accuracy foremotional stability
– Inducinghappinessorsurpriseleads to over 84% prediction accuracy forliveliness
– Inducinghappinessorfearleads to over 86% prediction accuracy forsocial boldness
– Inducinghappinessorangerleads to over 87% prediction accuracy forsensitivity
– Inducingfearordisgustleads to over 82% prediction accuracy forvigilance
– Inducingangerorfearleads to over 80% accuracy fortension
These prediction accuracies are more than 5% higher than the most successful case when samples acquired in the controlled scenario are used for both training and testing, with 63 subjects used in the training phase. This shows that eliciting emotions adds significant value to the prediction of these seven 16PF traits.
3.3 Links between FACS to MBTI personality traits
As we showed in both intra-subject and inter-subject tests, if specific emotions are induced to the subject, their facial muscle activity provides more valuable information that leads to predicting with higher accuracy than the 16PF traits. In order to determine the relationship between the facial muscle activity and the 16PF traits, we build another application that searches within all the rows added to the AU activity map during the 16PF traits prediction task and flags the AUs that are present at high levels (level E –classification score of over 85) when the prediction accuracy for each of the 16PF traits is over 85%. The results are detailed in Table 6.
3.4 Comparison with state-of-the-art
As detailed in the Section 1.1, recognizing personality traits from facial features is an understudied domain, and, currently, there is no database that is generally used in these studies, so the comparison with the state-of-the-art is made by mentioning that the databases and personality frameworks used are different. The compari-son is presented in Table 7.
Our work offers 67% prediction accuracy for the 16PF traits when trained and tested on samples acquired in
random scenarios and an average of 70–72% prediction accuracy when samples acquired in controlled scenarios are used. We obtain over 80% prediction accuracy for seven of the 16PF traits (warmth, emotional stability,
liveliness, social boldness, sensitivity, vigilance, tension).
Our current work, therefore, offers 10% better prediction accuracy compared to the one conducted by Chin et al. [22] using the MBTI instrument. Compared to the work of Setyadi et al. [4] that evaluates the four temperaments based on facial features, our system offers similar results
Table 516PF traits’prediction accuracy for inter-subject tests based on test sample induced emotion
Emotion induced Happiness Anger Fear Disgust Surprise Sadness
Prediction accuracy (%) Warmth 85.41 ± 0.25 85.63 ± 0.24 76.45 ± 0.34 69.47 ± 0.43 78.21 ± 0.28 72.14 ± 0.46
Reasoning 68.32 ± 0.43 73.32 ± 0.39 72.13 ± 0.35 73.28 ± 0.35 68.92 ± 0.37 71.02 ± 0.45
Emotional stability 86.31 ± 0.27 72.41 ± 0.38 71.32 ± 0.35 73.36 ± 0.35 71.23 ± 0.35 85.64 ± 0.23
Dominance 69.23 ± 0.42 73.26 ± 0.34 72.64 ± 0.41 69.83 ± 0.45 71.32 ± 0.35 72.12 ± 0.43
Liveliness 85.42 ± 0.21 71.26 ± 0.43 72.14 ± 0.37 71.35 ± 0.43 84.96 ± 0.22 68.34 ± 0.56
Rule consciousness 71.11 ± 0.36 72.05 ± 0.39 68.33 ± 0.45 69.33 ± 0.44 72.07 ± 0.36 70.32 ± 0.43
Social boldness 87.23 ± 0.31 72.14 ± 0.42 86.32 ± 0.28 68.36 ± 0.44 69.21 ± 0.42 72.16 ± 0.42
Sensitivity 88.05 ± 0.25 87.33 ± 0.25 71.41 ± 0.35 73.38 ± 0.38 69.13 ± 0.43 72.16 ± 0.42
Vigilance 71.16 ± 0.43 69.32 ± 0.42 82.35 ± 0.31 83.15 ± 0.32 72.14 ± 0.34 73.14 ± 0.45
Abstractedness 64.34 ± 0.46 65.27 ± 0.45 64.46 ± 0.47 68.43 ± 0.45 67.45 ± 0.46 69.23 ± 0.48
Privateness 66.33 ± 0.42 66.26 ± 0.45 65.14 ± 0.43 68.97 ± 0.45 70.13 ± 0.38 61.12 ± 0.55
Apprehension 68.91 ± 0.38 69.24 ± 0.47 67.13 ± 0.38 70.24 ± 0.39 65.42 ± 0.45 66.41 ± 0.51
Openness to change 61.14 ± 0.55 59.33 ± 0.52 62.22 ± 0.52 63.13 ± 0.44 61.24 ± 0.48 66.43 ± 0.48
Self-reliance 58.22 ± 0.55 59.35 ± 0.55 56.51 ± 0.55 62.22 ± 0.46 63.26 ± 0.45 59.42 ± 0.56
Perfectionism 59.51 ± 0.54 59.33 ± 0.55 60.16 ± 0.52 63.41 ± 0.43 66.43 ± 0.51 62.14 ± 0.55
Tension 69.43 ± 0.43 81.28 ± 0.21 80.97 ± 0.23 70.22 ± 0.34 74.32 ± 0.35 68.16 ± 0.47
Table 6Relationships between high-level AUs and high 16PF traits’prediction accuracy
16PF personality trait AUs at high levels
Warmth AU6(upper lid raiser),AU4(brow lowerer),AU5(upper lid raiser)
Reasoning AU1(inner brow raiser),AU2(outer brow raiser),AU4(brow lowerer),AU5(upper lid raiser)
Emotional stability AU6(cheek raiser),AU12(nasolabial deepener),AU15(lip corner depressor)
Dominance AU4(brow lowerer),AU5(upper lid raiser),AU23(lip tightener)
Liveliness AU1(inner brow raiser),AU2(outer brow raiser),AU26(jaw drop)
Rule consciousness AU5(upper lid raiser),AU7(lid tightener)
Social boldness AU6(cheek raiser),AU7(lid tightener),AU20(lip stretcher)
Sensitivity AU6(cheek raiser),AU12(lip corner puller),AU23(lip tightener)
Vigilance AU1(inner brow raiser),AU2(outer brow raiser),AU5(upper lid raiser),AU20(lip stretcher),AU9(nose wrinkler)
Abstractedness AU9(nose wrinkeler),AU15(lip corner depressor)
Privateness AU5(upper lid raiser),AU26(jaw drop)
Apprehension AU7(lid tightener),AU23(lip tightener)
Openness to change AU2(outer brow raiser),AU4(brow lowerer),AU7(lid tightener),AU20(lip stretcher)
Self-reliance AU6(cheek raiser),AU12(lip corner puller)
Perfectionism AU15(lip corner depressor),AU16(lower lip depressor)
but on a far more complex task. Similarly, compared to the work of Teijeiro-Mosquera et al. [20] which evaluate the FFM personality traits using CERT, our results are better with up to 5%, but lower than the results obtained in our previous work [21] where the FFM personality traits are evaluated on the same database. Our system also offers better prediction accuracy and more robust-ness compared to the results obtained by Zhang et al. [23] which only reach over 80% accuracy for only two of the 16PF traits while for other 16PF traits the results are significantly lower, while in our study, we obtain satisfac-tory prediction accuracy for almost all 16PF traits and over 80% prediction accuracy for seven of them.
4 Conclusions
We propose a novel three-layered neural network-based architecture for studying the relationships between emo-tions, facial muscle activity analyzed using FACS, and the 16PF traits. We use a specific set of features and classifiers to determine the AUs’intensity levels, and we compute an AU activity map which is in turn analyzed by a set of 16 FFNNs predicting the scores for the 16PF traits. Tested on our database, we show that using video samples acquired in controlled scenarios (when emotion is elicited) for training, the 16PF traits’prediction accur-acy increases with up to 6%. The proposed system also determines with over 85% accuracy seven of the 16PF traits, while for the other traits, the accuracy is lower. We show that there are distinct sets of induced emo-tions and specific combinaemo-tions of high-level AUs that can be used to improve the prediction accuracy for the 16PF traits even more, demonstrating that there is a re-lationship between the facial muscle activity, emotions, and the 16PF traits that can be further exploited for higher prediction accuracy and faster convergence, and
this will be the direction of our future research. Regard-ing the processRegard-ing time, the system converges to a stable result in no more than 58 s, making the approach faster and more practical than filling in the 16PF questionnaire and suitable for real-time monitoring, computing the personality traits of an individual in no more than 1 min. As a drawback, we obtain lower prediction accur-acy for several 16PF traits, and we can consider analyz-ing a broader spectrum of AUs as well as posture and gesture to increase the prediction accuracy for these traits. We can also consider other ways of stimulating emotions, knowing the fact that watching emotional vid-eos is not always sufficient to prompt expressions that would provide all the relevant information to evaluate all aspects of personality, and this is another direction which will be pursued in our future research.
Acknowledgements
There is no further acknowledgements to make.
Funding
We do not have any funding for this work.
Authors’contributions
MG has conducted the analysis of the state-of-the-art and detailed it in Section 1.1, has implemented the neural network-based testbed in Scala using Spark MLib library and has described it in Section 2, has tested the implemented architecture in both controlled and random scenarios and has analyzed the results, detailing them in Sections 3.1, 3.2, and 3.3, and has outlined the conclusions in Section 4. NV has written the Abstract, has composed the introduction (Section 1), and the section comparing the results with the state-of-the-art (Section 3.4). Both authors read and approved the final manuscript.
Competing interests
The authors declare that they have no competing interests.
Publisher’s Note
Springer Nature remains neutral with regard to jurisdictional claims in published maps and institutional affiliations.
Table 7Comparison with state-of-the-art
Work Year Method
used
Facial features used Personality type assessed
Highest prediction accuracy
Setyadi et al. [4] 2015 ANNs Distance between two corners of the eyes, high of eyes, ratio of the mouth width and nose, the width ratio of two eyes, and thickness of lower lip
four temperaments 65–68% (forsanguineand
melancholictemperaments)
Teijeiro-Mosquera et al. [20]
2015 CERT CERT—four sets of behavioral cues
FFM 60–65% (for extraversion)
Gavrilescu [21] 2015 FFNN FACS—27 AUs FFM 75% (for neuroticism, openness to experience, and extraversion)
Chin et al. [22] 2013 EM Marker-based tracking MBTI 60%
Zhang et al. [23] 2017 CNNs CNN features 16PF > 80% for rule consciousness and tension
Received: 4 April 2017 Accepted: 23 August 2017
References
1. D. McNeill,The Face: A Natural History(Back Bay Books, New York, 2000) 2. M. Pediaditis et al., Extraction of facial features as indicators of stress and
anxiety, Conference Proceedings of IEEE Engineering in Medicine and Biology Society (EMBC), August 2015, Milan, Italy. doi:10.1109/EMBC.2015. 7319199.
3. Y. Zhu et al., Automated depression diagnosis based on deep networks to encode facial appearance and dynamics, IEEE Transactions on Affective Computing, January 2017, doi:10.1109/TAFFC.2017.2650899.
4. A.D. Setyadi et al., Human character recognition application based on facial feature using face detection, 2015 International Electronics Symposium (IES), IEEE, pp. 263–267, September 2015, Surabaya, Indonesia.
5. O. Vartanian et al., Personality assessment and behavioral prediction at first impression. Personal. Individ. Differ.52(3), 250–254 (2012)
6. A. Todorov et al., Understanding evaluation of faces on social dimensions. Trends Cogn. Sci.12(12), 455–460 (2008)
7. T. Gulifoos, K.J. Kurtz, Evaluating the role of personality trait information in social dilemmas. Journal of Behavioral and Experimental Economics68, 119–129 (2017)
8. M. Koppensteiner, P. Stephan, Voting for a personality: do first impressions and self-evaluations affect voting decisions? J. Res. Pers.51, 62–68 (2014) 9. I.V. Blair et al., The influence of Afrocentric facial features in criminal
sentencing. Psychol. Sci.15(10), 674–679 (2004)
10. M. Yu et al., Developing trust: first impression and experience. J. Econ. Psychol.43, 16–19 (2014)
11. K. Mattarozzi et al., I care, even after the first impression: facial appearance-based evaluations in healthcare context. Soc. Sci. Med.182, 68–72 (2017) 12. M. Z. Uddin, Facial expression recognition using depth information and
spatiotemporal features, 2016 18th International Conference on Advanced Communication Technology (ICACT), IEEE, pp. 726–731, Febuary 2016, Pyeongchang, South Korea
13. M. Soleymani et al., Analysis of EEG signals and facial expressions for continuous emotion detection. IEEE Trans. Affect. Comput.7(1), 17–28 (2016) 14. Yafei Wang et al., Head pose-free eye gaze prediction for driver attention
study, 2017 IEEE International Conference on Big Data and Smart Computing (BigComp), February 2017, doi:10.1109/BIGCOMP.2017.7881713. 15. W. Sun et al., An auxiliary gaze point estimation method based on facial
normal. Pattern. Anal. Applic.19(3), 611–620 (2016)
16. F. Vicente et al., Driver gaze tracking and eyes off the road detection system. IEEE Trans. Intell. Transp. Syst.16(4), 2014–2027 (2015)
17. S. Baltaci, D. Gokcay, Role of pupil dilation and facial temperature features in stress detection, 2014 22nd Signal Processing and Communications Applications Conference (SIU), April 2014, Trabzon, Turkey, doi:10.1109/SIU. 2014.6830465.
18. J. Xu et al., Facial attractiveness prediction using psychologically inspired convolutional neural network (PI-CNN), 2017 IEEE International Conference on Acoustics, Speech and Signal Processing (ICASSP), March 2017, New Orleans, LA, USA, doi:10.1109/ICASSP.2017.7952438.
19. H. M. Khalid et al., Prediction of trust in scripted dialogs using neuro-fuzzy method, 2016 IEEE International Conference on Industrial Engineering and Engineering Management (IEEM), December 2016, Bali, Indoensia, doi:10. 1109/IEEM.2016.7798139.
20. L. Teijeiro-Mosquera et al., What your face Vlogs about: expressions of emotion and big-five traits impressions in YouTube. IEEE Trans. Affect. Comput.6(2), 193–205 (2015)
21. M. Gavrilescu, Study on determining the Big-Five personality traits of an individual based on facial expressions, E-Health and Bioengineering Conference (EHB), November 2015, Iasi, Romania, doi:10.1109/EHB.2015. 7391604.
22. S. Chin et al., An automatic method for motion capture-based exaggeration of facial expressions with personality types. Virtual Reality17(3), 219–237 (2013) 23. T. Zhang et al., Physiognomy: personality traits prediction by learning. Int. J.
Autom. Comput., 1–10 (2017)
24. A. Larochette et al., Genuine, suppressed and faked facial expressions of pain in children. Pain126, 64–71 (2006)
25. M.D. Giudice, L. Colle, Differences between children and adults in the recognition of enjoyment smiles. Dev. Psychol.43(3), 796–803 (2007)
26. P. Gosselin et al., Components and recognition of facial expression in the communication of emotion by actors. Oxford: Oxford University Press, 243–267 (1995)
27. R. Subramanian et al., ASCERTAIN: Emotion and Personality Recognition using Commercial Sensors, IEEE Transactions on Affective Computing, November 2016, doi:10.1109/TAFFC.2016.2625250.
28. H. Berenbaum et al., Personality and pleasurable emotions. Personal. Individ. Differ.101, 400–406 (2016)
29. P. Ekman, W.V. Friesen,Facial Action Coding System: Investigator’s Guide (Consulting Psychologists Press, Palo Alto, 1978)
30. T. Taleb et al., A novel middleware solution to improve ubiquitous healthcare systems aided by affective information. IEEE Trans. Inf. Technol. Biomed.14(2), 335–349 (2010)
31. A. Sano et al., Recognizing academic performance, sleep quality, stress level, and mental health using personality traits, wearable sensors and mobile phones, 2015 IEEE 12th International Conference on Wearable and Implantable Body Sensors Networks (BSN), June 2015, Cambridge, MA, USA, doi:10.1109/BSN.2015.7299420.
32. O. Santos, Emotions and personality in adaptive e-learning systems: an affective computing perspective. Human-Computer Interaction Series, Chapter: Emotions and Personality in Personalized Services, 263–285 (2016) 33. A. Daros et al., Identifying mental disorder from the faces of women with
borderline personality disorder. J. Nonverbal Behav.40(4), 255–281 (2016) 34. C. Ridgewell et al., Personality traits predicting quality of life and overall
functioning in schizophrenia. Schizophr. Res.182, 19–23 (2017) 35. J. Levallius et al., Take charge: personality as predictor of recovery from
eating disorder. Psychiatry Res.246, 447–452 (2016)
36. S.E. Emert et al., Associations between sleep disturbances, personality, and trait emotional intelligence. Personal. Individ. Differ.107, 195–200 (2017) 37. A. Cerekovic et al., How do you like your virtual agent?: human-agent
interaction experience through nonverbal features and personality traits. International Workshop on Human Behavior Understanding, 1–15 (2014) 38. M.A. Fengou et al., Towards personalized services in the healthcare domain,
Handbook of Medical and Healthcare Technologies, pp. 417–533, November 2013
39. M. Jokela et al., Personality change associated with chronic diseases: pooled analysis of four perspective cohort studies. Psychol. Med. 44, 2629–2640 (2014)
40. B. Jiang et al., A dynamic appearance descriptor approach to facial actions temporal modelling. IEEE Transactions on Cybernetics44(2), 161–174 (2014) 41. Y. Li et al., Simultaneous facial feature tracking and facial expression
recognition. IEEE Trans. Image Process.22(7), 2559–2573 (2013)
42. S. Eleftheriadis et al., Discriminative shared Gaussian processes for multiview and view-invariant facial expression recognition. IEEE Trans. Image Process. 24(1), 189–204 (2015)
43. S.L. Happy, A. Routray, Automatic facial expression recognition using features of salient facial patches. IEEE Trans. Affect. Comput.6(1), 1–12 (2015) 44. P. Lucey et al., The extended Cohn-Kanade dataset (CK+): a complete
dataset for action unit and emotion-specified expressions, 2010 IEEE Computer Society Conference on Computer Vision and Pattern Recognition Workshop (CVPRW), June 2010, San Francisco, CA, USA, doi:10.1109/CVPRW. 2010.5543262.
45. M.L. Lyons et al., Coding facial expressions with Gabor wavelets, IEEE International Conference on Automatic Face and Gesture Recognition, April 1998, Nara, Japan
46. E.I. Barakova et al., Automatic interpretation of affective facial expressions in the context of interpersonal interaction. IEEE Transactions on Human-Machine Systems45(4), 409–418 (2015)
47. L. Zafeiriou et al., Probabilistic slow features for behavior analysis. IEEE Transactions on Neural Networks and Learning Systems27(5), 1034–1048 (2016) 48. P. Carcagni et al., A study on different experimental configurations for age,
race, and gender estimation problems. EURASIP Journal on Image and Video Processing37, 2015 (2015)
49. H.E.P. Cattell, A.D. Mead, in The SAGE Handbook of Personality Theory and Assessment: Vol. 2. Personality Measurement and Testing, ed. by G. J. Boyle, G. Matthews, D. H. Saklofske. The sixteen personality factors questionnaire (16PF) (Thousand Oaks, 2008), Sage Publishing, pp. 135–159
50. R.B. Cattell,Use of Factor Analysis in Behavioral and Life Sciences(Plenum, New York, 1978)