Volume 2010, Article ID 626324,10pages doi:10.1155/2010/626324
Research Article
Unsupervised Action Classification Using
Space-Time Link Analysis
Haowei Liu,
1Rogerio Feris,
2Volker Krueger,
3and Ming-Ting Sun
11University of Washington, Seattle, WA 98195, USA 2IBM, Hawthorne, NY 10523, USA
3CVMI, CIT, Aalborg University, 2750 Ballerup, Denmark
Correspondence should be addressed to Volker Krueger,[email protected]
Received 16 September 2009; Revised 21 December 2009; Accepted 26 March 2010
Academic Editor: Jian Zhang
Copyright © 2010 Haowei Liu et al. This is an open access article distributed under the Creative Commons Attribution License, which permits unrestricted use, distribution, and reproduction in any medium, provided the original work is properly cited.
We address the problem of unsupervised discovery of action classes in video data. Different from all existing methods thus far proposed for this task, we present a space-time link analysis approach which consistently matches or exceeds the performance of traditional unsupervised action categorization methods in various datasets. Our method is inspired by the recent success of link analysis techniques in the image domain. By applying these techniques in the space-time domain, we are able to naturally take into account the spatiotemporal relationships between the video features, while leveraging the power of graph matching for action classification. We present a comprehensive set of experiments demonstrating that our approach is capable of handling cluttered backgrounds, activities with subtle movements, and video data from moving cameras. State-of-the-art results are reported on standard datasets. We also demonstrate our method in a compelling surveillance application with the goal of avoiding fraud in retail stores.
1. Introduction
How to automatically discover and recognize activities from video data is an important topic in computer vision. A solution to this problem will not only facilitate applications, such as video retrieval or summary, but will also improve, for example, automatic video surveillance systems [1] and human-machine/robot communication [2]. In addition to its importance for many practical applications, unsupervised action categorization is important in the context of machine learning, particularly on how video processing approaches could allow a high-level “understanding” of the data.
Numerous techniques have been proposed to solve the action classification problem [3]. The requirements of video analysis techniques are manifold, such as dealing with cluttered background, camera motion, occlusion, and geometric and photometric variability, [1, 4, 5]. Recently, unsupervised methods based on bag of visual words have become very popular as they could achieve excellent perfor-mance in standard datasets [6] and long surveillance videos [1,7].
Generally, these unsupervised algorithms extract spa-tiotemporal feature descriptors called video words and then use document-topic models such as pLSA [8], LDA [9], or HDP [10] to discover latent topics [1, 5, 7]. A common limitation of these models is that they usually do not consider spatiotemporal correlations among visual words unless the correlations are represented explicitly [6]. Another general limitation is that some of these methods are EM-based learning approaches which makes recursive learning and updating difficult.
In this paper we introduce link analysis-based tech-niques to unsupervised activity discovery in video data that naturally preserves the spatiotemporal topology among the video words. Link analysis techniques are known from data mining, the information retrieval research communities, and the WWW [11]. They were largely ignored in computer vision until their recent introduction to the community by Kim et al. [12,13], who applied link analysis to unsupervised image clustering with impressive results.
is to extract spatiotemporal features from the video data. Then, we construct a visual similarity network (VSN) [12] by computing the pairwise similarity between the features. Here, we replace for better efficiency the spectral matching approach [14] as used in [12,13] with a combination of a linear matching [15] and the shape context descriptor [16]. Note that after pairwise matching all the video sequences, each feature would establish links with another. The weights of these links are given by the result of matching, that is, how similar two features are. The features together with the links form a giant VSN, shown as the output of the matching process inFigure 1.
Next, the VSN is analyzed separately by using the link analysis techniques, PageRank [11] and structure similarity (SS) [17]. The PageRank algorithm would output a score for each feature indicating the amount of similar features it has while the structural similarity gives the likelihood of a feature being a hub node. The intuition is that genuine features should be similar to one another and thus have high ranking values. The PageRank and the structural similarity scores together form an affinity matrix between all video sequences.
Here, we interpret the pairwise matching weights as
votes for the importance of the nodes which allows a quick division between consistent nodes and irrelevant ones (e.g., those from the background). Eventually, as shown in
Figure 1, spectral clustering is applied to the affinity matrix to identify potential action categories. Link analysis techniques have been shown to be able to detect consistent matches (hubs) very effectively and efficiently [11, 12, 18,19]. All computation and inference is done on the link weights between the nodes in the VSN which makes it fast and efficient.
The key contributions of our work are as follows.
(i) We extend link analysis techniques to the spa-tiotemporal domain and show that unsupervised discovery of action classes can greatly benefit from such approach. For this we apply necessary revisions (feature representation, matching techniques, etc.) to the approach presented in [12] to make it efficiently applicable to video data. We report results that either match or exceed the performance of the state-of-the-art techniques in various datasets.
(ii) We demonstrate that our approach can be applied for action clustering in real surveillance videos and show a compelling application to avoid fraud in retail stores.
The paper is organized as follows: in Section 2, we review related literature on activity recognition. Section 3
describes our approach in detail, including the spatiotem-poral interest point detector, the matching process, and link analysis techniques. In Section 4, we show the perfor-mance of our approach on standard datasets and a real surveillance application. Finally, Section 5 concludes our paper.
2. Related Work
Many methods have been proposed to address the problem of action recognition and analysis in video sequences [3,
20, 21]. Specifically for human action modeling, a variety of techniques rely on tracking body parts (e.g., arms, limbs, etc.) to classify human actions [22,23]. The classical review of [24] covers significant amount of work that falls into this category. Although very promising results have been achieved recently to distinguish activities under large viewpoint changes [25], it is often difficult to accurately detect and track body parts in complex environments.
Template-based approaches make use of spatiotemporal patterns to match and identify specific actions in videos. Bobick and Davis [26] use motion history images—a.k.a temporal templates—for action classification. Efros et al. [27] introduce a spatiotemporal descriptor that works well on low-resolution videos. Blank et al. [28] represent actions as space-time shape volumes for classification. Shechtman and Irani [29] propose a similarity metric between video patches based on intensity variation. A common drawback of these template-based methods is their inability to generalize from a collection of examples and create a single template which captures the intraclass variability of an action. More recently, Rodriguez et al. [30] address this problem using a MACH filter.
State-Space models have been widely applied for short term action recognition and more complex behavior anal-ysis, involving object interactions and activities at multiple levels of temporal granularity. Examples include Hidden Markov Models and its variations such as coupled HMMs [31] and Layered HMMs [32], Stochastic Grammars [33], and Conditional Random Fields [34]. The majority of these methods are supervised, requiring manual labeling of video clips. When the state space is large, the estimation of many parameters make the learning process more difficult.
Bag of words models have recently shown great promise in action classification. These approaches in general extract sparse space-time interest points [35, 36] from the video sequences and then apply either discriminative or generative models for categorizing the activities. Highly discriminative results are obtained using SVM classifiers based on these descriptors under a supervised learning framework [36,37]. Recently, Niebles and Fei-Fei [4] enhance this approach by proposing a novel model characterized as a constellation of bags-of-features, which encodes both the shape and appearance of the actor.
Unsupervised methods have also been proposed using the bag of words model (see the general discussion in
Matching scores/ VSN
Structural similarity
Spectral clustering Interest point
detector
Refined matching Video
sequences
Different categories Interest
points Matching
PageRank
Figure 1: This flow chart summarizes our approach: given a set of video sequences, we start with spatial-temporal interest points extraction. The extracted interest points from each sequence are then matched pairwise using Hungarian method with shape context features incorporated. The matching scores encoding the similarities between any two features are then refined using link PageRank and structure similarity to further enhance distinctive features while suppress noisy ones. Later, the two resulting refined scores are then jointly fed into a clustering algorithm.
Different from all methods thus far proposed for unsu-pervised action categorization, we address this problem using a link analysis-based approach. Specifically, we apply link analysis algorithms in the spatiotemporal domain to automatically discover actions in video sequences. By using link analysis, we are able to naturally take into account the spatiotemporal relationships between detected interest points, while leveraging the power of graph matching for action classification. Experiment results show that this approach performs well compared to the state-of-the-art techniques on standard datasets and works very well in real surveillance scenarios. More details about our algorithm follow in the next section.
3. Link-Analysis for Spatiotemporal Features
In this section, we break down our approach into its major components and give a detailed introduction to them. In detail, we will discuss the types of features we used, the use of shape context features matching, PageRank, structure similarity computation, and spectral clustering. Figure 1
shows the flow chart of our approach.
3.1. Extraction of Spatio-Temporal Features. The first step of our action classification approach is to extract spatiotem-poral interest points from the input video sequences. The two most recent spatiotemporal descriptors are proposed by Laptev and Lindeberg [35] and Dollar et al. [36], respectively. We use the interest point detector proposed by Dollar et al. [36] in order to get denser spatiotemporal visual words. For a video sequence with pixel values I(x,y,t), separable linear filters are applied to the video in order to obtain the response function as follows:
R=I∗g∗hev
2
+I∗g∗hod
2
, (1)
where ∗ indicates the convolution, g(x,y,σ) is the 2D Gaussian smoothing kernel applied only along the spatial dimensions (x,y), andhev andhodare a quadrature pair of
1D Gabor filters applied temporally, which are defined as
hev
t;τ,f=cos2π f te−t2/τ2
,
hod
t;τ,f=sin2π f te−t2/τ2.
(2)
The two parameters σ and f correspond to the spatial and temporal scales of the detector, respectively. The fre-quency of the harmonic functions is given byf. In all cases we use f =4/τ, as in [5].
Any region with spatially distinguishing characteristics undergoing a complex, nontranslational motion induces a strong response [36]. At these interest points, we extract spatiotemporal volumes (cuboids). Later we calculate the brightness gradients within these volumes and concatenate them to form a feature vector. PCA is then used to reduce the dimensions of these feature vectors.Figure 2shows the extracted interest points on a few sequences from the KTH dataset [37]. ConsideringFigure 2(c)as an example, we can see that the interest points occur at places around the arms, where the up-and-down motion induces strong responses.
Alternatives to the space-time volumes are possible. On crowded scenes in surveillance data, that we have successfully used the spatiotemporal motion descriptors from [27].
3.2. Matching Spatial-Temporal Words and Building VSN.
Suppose we have a setI of video sequences, each withma,
a ∈ I, spatiotemporal features, and the total number of features in all sequences isM.
In order to take into account the relationships between detected visual words we apply a graph matching algorithm on each pair of sequencesa,b∈Ito determine feature level similarities. In [12], quadratic matching techniques such as [14] are used to match nodes from two graphs by jointly considering the consistencies of their feature values and the spatial arrangements. However, the direct application of the techniques from [12] is not possible. While the work in [12] is applied on sets of images, our problem is concerned with sets of videos. For video processing, the techniques from [12], in particular the spectral matching [14], are too inefficient for video processing. For example, the spectral matching has a complexity ofO(n4), wherenis the number
(a) (b) (c)
(d) (e) (f)
Figure2: Sample sequences with detected interest points using the approach inSection 3.1for the KTH dataset. From (a) to (f), the activities are boxing, handclapping, handwaving, jogging, running, and walking. Note that these interest points are detected at places where complex, nontranslational motions occur.
of all others with respect to itself in polar coordinate system. In our scenario, since the activities are periodic, we only consider the spatial distributions, that is, the 2D polar coordinates of the visual features. The incorporation of shape context features discourages the matching of a noisy word from the background and a legitimate one. The reason is that although the feature value of the noisy word could be very similar to a genuine one, its shape context descriptor would say otherwise since these noisy words often occur at random places in the video sequences while the genuine features from the activities of interest are usually centered around a specific location, for example, the human body. This way, although the Hungarian method itself does not consider the locations of matched features, by augmenting every spatial-temporal word with its shape context descriptor, the spatial arrangement of these features is implicitly modeled.
Based on the pairwise matching results, and similarly to Kim et al. [12], we build a VSNG =(V,E,W) where each nodeai∈V represents theith feature in the input videoa,
bj ∈V represents the jth feature in the input videob. The
weightwe ∈W for each edgee =(ai,bj)∈Eare given by
the similarity score between featuresaiandbj. The similarity
score between feature vectoraiandbj is obtained through
the exponential equation:
Wai,bj
=exp
⎛
⎝−cost
ai,bj
2σ2 ⎞
⎠, (3)
where cost(ai,bj) is the matching cost between featureaiand
bj. In our experiments we have computed the link weights,
W(ai,bj) from the difference, that is, cost(ai,bj) between the
two feature vectorsaiandbjwith and without shape context
features. For normalizing the weights we follow the approach outlined in [12].
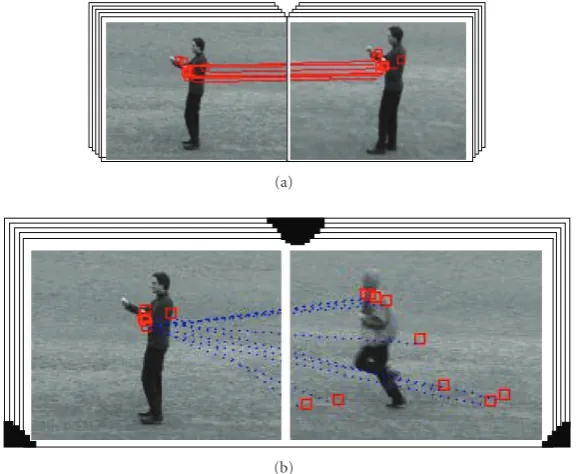
The intuition behind the matching algorithm and the VSN is that the number of links to and from a node reflects the cooccurrence statistics while each link weight reflects the belief in that match. This creates a clustering effect. The hope is that (a) features from the same category would tend to interconnect with each other through strong links, while only weak links would exist between features from different categories, and (b) features that appear often will have many links. Figure 3 shows the matching results between sequences from same and different categories, respectively. As one can see, sequences from different classes would incur worse matching (Figure 3(b)) while the matching between sequences from the same category are more consistent and regular (Figure 3(a)).
3.2.1. PageRank. The aim of the next step is to identify the strongest and most consistent features in each of the videos. This we do by extracting the subgraphGafrom our original
VSN that contains the nodes from the video a as well as all other nodes in the VSN that are connected to the nodes froma: we setWi j = 0 ifi /∈a and j /∈a. Then, we apply
pagerank [11] to the subgraphGa. The intuition behind the
(a)
(b)
Figure3: The figures show the matching results between two sequences from (a) the same category and (b) different categories. Solid lines indicate matching pairs with low costs while dotted lines indicate costly matching pairs. Since the shape context features are incorporated, for two features to match well, they need to have not only similar feature values but also similar relative locations with respect to other features.
In short, the pagerank algorithm generates a pagerank vectorPby solving the following equation:
P=(1−α)(W+D)P+αu, (4)
whereWis the weight matrix ofGa,αis a weighting constant
set to 0.1 as in [12], uis the transport vector representing the initial prior of P (set to uniform distribution here), and D = udT, where d is the r-dimensional indicator
vector identifying the nodes with zero outdegree and r is the dimension of the transport vector. The final ranking value of each node represents its relative importance in the VSNGa.
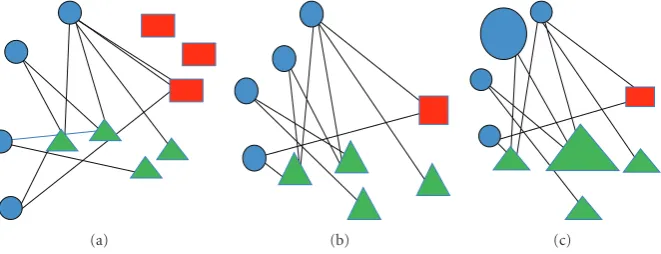
The process is illustrated in Figure 4. Initially, as
Figure 4(a) shows, we have a VSN composed of features from three sequences. We extract the subgraph with respect to the first sequence, of which the features are represented as the circular nodes (Blue, circular nodes in Figure 4(b)). Then, we apply pagerank to the subgraph to determine the relative importance of the features in the subgraph.
Figure 4(c) shows the final graph after pagerank. Larger nodes are those relevant features with respect to sequence one.
3.2.2. Structure Similarity. After computing pagerank, we evaluate the structure similarity [17] between two nodes. Here, we follow the reasoning in [12, 17]: nodes with a similar set of links, that is, nodes that are pointed to by a similar set of nodes and which are pointing to a similar set of nodes will most likely belong to the same category. Blondel et al. [17] use this technique to find synonymies in text documents.
The goal for computing structure similarity is to identify which nodes in the graph are true hub nodes. In order to do this, we take the graph we have and compare it with graph
B, and see which node(s) are most similar to node 2, the center node, in B. Therefore, B is the graph we compare to and (5) is the matrix representation of it. Let U be the resulting similarity scores. To solveU, we use the following formulation to solve (6), which is an approach proposed in citeSS to compare nodes from different graphs.
Given a graphG, we define the neighborhood graphGai
of a nodeaito be the subgraph formed by the neighboring
nodes of ai and the edges in Gbetween them. Let Mai be
the adjacency matrix of Gai and letNai be the number of
neighbors ofai. Then, the similarity (central score) between
the vertices ofGai and vertex 2 of the path graph of (5) is
calculated:
1−→2−→3, B=
⎛ ⎜ ⎝
0 1 0 0 0 1 0 0 0
⎞ ⎟
⎠, (5)
by iteratively solving
Uk+1= BUkM T
ai+BTUkMai
BUkMTai+BTUkMaiF
(6)
for U. Here, Uk is a 3 × Nai matrix, initially set to a
matrix with all entries1and · F is the Frobenius norm.
Upon convergence, the structure similarity value for each neighborbjofaiis given byUai(2,bj). A valuebjwith higher
score shares a lot of common nodes withai. The process is
repeated for each featureaiwhich gives us anM×Mmatrix
(a) (b) (c)
Figure4: The process of pagerank: (a) is the original similarity network we have. (b) shows the result after the subgraph extraction. Nodes of different shape represent features from different categories. After pagerank, features that are important would receive high ranking values, represented as the size of the nodes in (c). The larger a node is, the higher it ranks.
3.2.3. Spectral Clustering. By fusing the result of pagerank and structure similarity, we can obtain the similarity score between sequenceaand sequencebby
S(a,b)=
bj∈Xb Pa
bj
+
ai∈Xa,bj∈Xb Pa(ai)Z
ai,bj
. (7)
Given annby n matrix encoding the similarity scores between n instances, the spectral clustering [38] clusters these n instances into k clusters, where k is a predefined value. With the affinity matrixSat hand, we apply spectral clustering [38] on the nearest neighbor graph to uncover the underlying activities.
4. Experiments
In this section, we apply our algorithm to standard datasets and show that it performs well compared to the state-of-the-art approaches. In detail, we test our approach on the following:
(i) the KTH dataset [37], which is the largest one, (ii) the skating datset from [39], where we show that our
approach is able to handle cluttered background as well as video data from a moving cameras,
(iii) real-world surveillance data where our approach was able to cope even with subtle movements.
In all the evaluations, the features are reduced to 100D vectors using PCA. In practice, the target dimensionality could be set using cross validation. In our case, we set it to 100 for the sake of comparison. The values ofσandτcould vary according to different datasets but they are set to the same values as in [5].
4.1. KTH Dataset. The KTH dataset [37] is by far the largest standard activity dataset, which consists of six categories of activities performed by twenty-five actors in four different scenarios. The feature detector parameters are set toσ =2 andτ =2.5, the detector results are shown inFigure 2. Each spatiotemporal patch is represented by the concatenated vector of its 3D gradients and then further reduced to 100
Table 1: Confusion matrix for the KTH dataset. The average performance is 91.3%. “box”, “hc”, “hw”, “j/r”, and “walk” represent boxing, handclapping, handwaving, jogging/running, and walking, respectively. For example, row one means out of all the boxing sequences, 84% are classified correctly, and 16% are classified as handclapping.
Category box hc hw jr wa
box 0.84 0.16 0 0 0
hc 0.04 0.93 0.03 0 0
hw 0 0.06 0.94 0 0
jr 0 0 0 0.94 0.06
wa 0 0.07 0 0.04 0.9
dimensions using PCA. We then apply our approach to cluster the video sequences, the results are shown inFigure 5. Due to the size of the database, we report the result for KTH without shape context features. The confusion matrix for the KTH dataset is shown in Table 1. Note that we lump “jogging” and “running” into one category, as we did not incorporate features such as speed to distinguish these two activities. Our approach achieves 91.3% accuracy and performs well compared to the that of-state-of-art approaches (e.g., Niebles et al. [5] also recently reported 91.3% considering running and jogging lumped together).
4.2. Skating Dataset. As a second experiment, we apply our approach to a real world skating dataset reported in [39]. We extract 24 video sequences from the dataset and apply the same process to uncover three activities: stand-spin, sit-spin, and camel-spin. The detector parameters are set toσ=2 and
τ =1.2 when extracting the spatiotemporal interest points, which are then described by the corresponding PCA- reduced 3D gradients.
(a) (b) (c)
(d) (e) (f)
Figure5: Feature points with high pagerank values from the six different categories in the KTH dataset. From (a)–(f), the activities are boxing, handclapping, handwaving, jogging, running, and walking.
(a) (b) (c)
(d) (e) (f)
Figure6: The figure shows the detected interest points for six sequences from the three different categories of the skating dataset: (a) and (b) stand-spin; (c) and (d) sit-spin; (e) and (f) camel-spin.
The performance is considerably better when the features are augmented with their associated shape context descrip-tors. The reason is that given the cluttered background in these sequences and that the activities of interest are in the center of each frame, it is beneficial to filter out the spatiotemporal interest points induced by the background. Shape context features serve the purpose as most of time
(a) (b) (c)
(d) (e) (f)
Figure7: The figure shows the detected feature points for six sequences from three different categories: (a) and (b) stand-spin; (c) and (d) sit-spin; (e) and (f) camel-spin.
Table 2: Confusion matrix for the skating dataset. The average performance is 83.4%.
Category std sit cam
stand-spin 0.83 0 0.17
sit-spin 0 1 0
camel-spin 0.33 0 0.67
Table3: Performance comparison between different methods from top to bottom: pLSA, without shape context features (SCF), and with shape context features (SCFs).
Methods Recognition accuracy
pLSA [5] 80.3%
w/o shape features 80.1%
with shape features 83.3%
average performance is 83.4%, which is better than 80.3% using the state-of-the art approach [5].Table 3compares the performance with and without the shape context features.
4.3. Real World Surveillance Video. As a third experiment, we apply our approach to a real world surveillance system deployed in large retail stores to detect fraud scannings at the counters. The goal is to avoid retail shrink caused by cashiers who intentionally fail to enter one or more items into the transaction in an attempt to get free merchandise for the customer. We approach the problem by automatically detecting the scanning activities in the video and matching these detected events with the transaction log to uncover possible fake scans. For this experiment, we extract 27 video
Table4: Confusion matrix for the surveillance video. The average performance is 81.5%. “pick”, “scan”, and “drop” represent pickup, scanning, and drop, respectively.
Category pick scan drop
pick 0.67 0 0.33
scan 0 1 0
drop 0.223 0 0.78
sequences from the dataset and show the performances of different methods. Figure 8shows sample frames for three typical activities, that is, pickup, scan, and drop, with the detected interest points. As one can see fromFigure 8, other than “drop” (Figure 8(c)), these activities only induce minor motions, and usually overlap with each other. The sparsity of interest points makes it even harder to detect the “scanning” activity. Throughout the experiment, we set σ = 2 and
(a)
(b)
(c)
Figure8: Sample frames for three typical activities at the counter. Detected interest points are shown in rectangles. (a), (b), and (c) represents pickup, scan, and drop, respectively.
5. Conclusion
In this paper, we proposed a link-analysis-based approach to unsupervised activity recognition. Different from previous approaches based on the bag of words models, the link-analysis approach takes into account the spatiotemporal relationship between visual words in the matching process. We see this as the major reason for the good performance of our approach. Furthermore, we have tested the link-analysis on a variety of test videos: the KTH data, which is the largest dataset, the skating video data, where our approach demonstrated its ability to deal with cluttered background and moving cameras and the surveillance data where our approach was able to cope even with very subtle hand movements.
During our tests of the link-analysis approach on the different datasets, we also compared different approaches, that is, (a) with the shape context features (SCF), (b) without SCF, and (c) state-of-the-art approach using pLSA. Future work will be to deal with multiple moving
individu-als/objects in the video data. We would also like to evaluate the performance of our approach using better matching algorithm, quadratic assignment [40], for example.
Acknowledgment
This work was partially funded by the EU-project PACOPlus, IST-FP6-IP-027657.
References
[1] X. Wang, X. Ma, and E. Grimson, “Unsupervised activity perception by hierarchical bayesian models,” inProceedings of the IEEE Computer Society Conference on Computer Vision and Pattern Recognition, Minneapolis, Minn, USA, 2007.
[2] V. Krueger, D. Kragic, A. Ude, and C. Geib, “The meaning of action: a review on action recognition and mapping,”
International Journal on Advanced Robotics, vol. 21, no. 13, pp. 1473–1501, 2007.
[3] T. B. Moeslund, A. Hilton, and V. Kr¨uger, “A survey of advances in vision-based human motion capture and analy-sis,”Computer Vision and Image Understanding, vol. 104, no. 2-3, pp. 90–126, 2006.
[4] J. C. Niebles and L. Fei-Fei, “A hierarchical model of shape and appearance for human action classification,” inProceedings of the IEEE Computer Society Conference on Computer Vision and Pattern Recognition, Minneapolis, Minn, USA, 2007.
[5] J. C. Niebles, H. Wang, and L. Fei-Fei, “Unsupervised learning of human action categories using spatial-temporal words,”
International Journal of Computer Vision, vol. 79, no. 3, pp. 299–318, 2008.
[6] S. Savarese, A. Del Pozo, J. C. Niebles, and L. Fei-Fei, “Spatial-temporal correlations for unsupervised action classification,” in Proceedings of the IEEE Workshop on Motion and Video Computing, Copper Mountain, Colo, USA, 2008.
[7] X. Wang, K. T. Ma, G.-W. Ng, and W. E. L. Grimson, “Trajectory analysis and semantic region modeling using a nonparametric bayesian model,” in Proceedings of the 26th IEEE Conference on Computer Vision and Pattern Recognition (CVPR ’08), 2008.
[8] T. Hofmann, “Probabilistic latent semantic analysis,” in Pro-ceedings of the 22nd Conference on Uncertainty in Artificial Intelligence, Stockholm, Sweden, 1999.
[9] D. M. Blei, A. Y. Ng, and M. I. Jordan, “Latent dirichlet allocation,”Journal of Machine Learning Research, vol. 3, no. 4-5, pp. 993–1022, 2003.
[10] Y. W. Teh, M. I. Jordan, M. J. Beal, and D. M. Blei, “Hierarchical Dirichlet processes,” Journal of the American Statistical Association, vol. 101, no. 476, pp. 1566–1581, 2006. [11] S. Brin and L. Page, “The anatomy of a large-scale hypertextual
web search engine,” in Proceedings of the 7th International Conference on World Wide Web, vol. 7, pp. 107–117, 1998. [12] G. Kim, C. Faloutsos, and M. Hebert, “Unsupervised
mod-eling of object categories using link analysis techniques,” in
Proceedings of the 26th IEEE Conference on Computer Vision and Pattern Recognition (CVPR ’08), Anchorage, Alaska, USA, June 2008.
[14] M. Leordeanu and M. Hebert, “A spectral technique for correspondence problems using pairwise constraints,” in
Proceedings of the IEEE International Conference on Computer Vision, vol. 2, pp. 1482–1489, Beijing, China, 2005.
[15] H. W. Kuhn, “The hungarian method for the assignment problem,”Naval Research Logistics Quarterly, vol. 2, 1955. [16] S. Belongie, J. Malik, and J. Puzicha, “Shape matching and
object recognition using shape contexts,”IEEE Transactions on Pattern Analysis and Machine Intelligence, vol. 24, no. 4, pp. 509–522, 2002.
[17] V. D. Blondel, A. Gajardo, M. Heymans, P. Senellart, and P. Van Dooren, “A measure of similarity between graph vertices: applications to synonym extraction and web searching,”SIAM Review, vol. 46, no. 4, pp. 647–666, 2004.
[18] M. Najork and N. Craswell, “Efficient and effective link analysis with precomputed SALSA maps,” in Proceedings of the International Conference on Information and Knowledge Management, pp. 53–62, Napa Valley, Calif, USA, 2008. [19] M. Thelwall,Link Analysis: An Information Science Approach,
Academic Press, San Diego, Calif, USA, 2004.
[20] B. K. Turaga, R. Chellappa, V. S. Subrahmanian, and O. Udrea, “Machine recognition of human activities: a survey,” IEEE Transactions on Circuits and Systems for Video Technology, vol. 18, no. 11, pp. 1473–1488, 2008.
[21] L. Wang, W. Hu, and T. Tan, “Recent developments in human motion analysis,”Pattern Recognition, vol. 36, no. 3, pp. 585– 601, 2003.
[22] D. Ramanan and A. Forsyth, “Automatic annotation of everyday movements,” inProceedings of the Neural Information Processing Systems (NIPS ’03), Washington, DC, USA, 2003. [23] C. Fanti, L. Zelnik-Manor, and P. Perona, “Hybrid models
for human motion recognition,” inProceedings of the IEEE Computer Society Conference on Computer Vision and Pattern Recognition (CVPR ’05), vol. 1, pp. 1166–1173, San Diego, Calif, USA, 2005.
[24] D. M. Gavrila, “The visual analysis of human movement: a survey,”Computer Vision and Image Understanding, vol. 73, no. 1, pp. 82–98, 1999.
[25] N. Ikizler and D. Forsyth, “Searching video for complex activities with finite state models,” inProceedings of the IEEE Computer Society Conference on Computer Vision and Pattern Recognition, Minneapolis, Minn, USA, 2007.
[26] A. F. Bobick and J. W. Davis, “The recognition of human movement using temporal templates,”IEEE Transactions on Pattern Analysis and Machine Intelligence, vol. 23, no. 3, pp. 257–267, 2001.
[27] A. A. Efros, A. C. Berg, G. Mori, and J. Malik, “Recognizing action at a distance,” inProceedings of the IEEE International Conference on Computer Vision, vol. 2, pp. 726–733, Nice, France, 2003.
[28] M. Blank, L. Gorelick, E. Shechtman, M. Irani, and R. Basri, “Actions as space-time shapes,” in Proceedings of the IEEE International Conference on Computer Vision, vol. 2, pp. 1395– 1402, Beijing, China, 2005.
[29] E. Shechtman and M. Irani, “Space-time behavior based correlation,” in Proceedings of the IEEE Computer Society Conference on Computer Vision and Pattern Recognition, vol. 1, pp. 405–412, San Diego, Calif, USA, 2005.
[30] M. D. Rodriguez, J. Ahmed, and M. Shah, “Action MACH: a spatio-temporal maximum average correlation height filter for action recognition,” inProceedings of the 26th IEEE Conference on Computer Vision and Pattern Recognition (CVPR ’08), Anchorage, Alaska, USA, 2008.
[31] M. Brand, N. Oliver, and A. Pentland, “Coupled hidden Markov models for complex action recognition,” in Proceed-ings of the IEEE Computer Society Conference on Computer Vision and Pattern Recognition, pp. 994–999, San Juan, Puerto Rico, USA, 1997.
[32] N. Oliver, A. Garg, and E. Horvitz, “Layered representations for learning and inferring office activity from multiple sensory channels,”Computer Vision and Image Understanding, vol. 96, no. 2, pp. 163–180, 2004.
[33] A. F. Bobick and Y. A. Ivanov, “Action recognition using prob-abilistic parsing,” inProceedings of the IEEE Computer Society Conference on Computer Vision and Pattern Recognition, pp. 196–202, anta Barbara, Calif, USA, 1998.
[34] A. Quattoni, S. Wang, L.-P. Morency, M. Collins, and T. Dar-rell, “Hidden conditional random fields,”IEEE Transactions on Pattern Analysis and Machine Intelligence, vol. 29, no. 10, pp. 1848–1853, 2007.
[35] I. Laptev and T. Lindeberg, “Space-time interest points,” in
Proceedings of the IEEE International Conference on Computer Vision, vol. 1, pp. 432–439, Nice, France, 2003.
[36] P. Dollar, V. Rabaud, G. Cottrellm, and S. Belongie, “Behavior recognition via sparse spatiotemporal features,” inProceedings of the IEEE International Workshop on Visual Surveillance and Performance Evaluation of Tracking and Surveillance (PETS ’05), Beijing, China, 2005.
[37] C. Sch¨uldt, I. Laptev, and B. Caputo, “Recognizing human actions: a local SVM approach,” inProceedings of the Inter-national Conference on Pattern Recognition, vol. 3, pp. 32–36, Cambridge, UK, 2004.
[38] Y. Song, W.-Y. Chen, H. Bai, C.-J. Lin, and E. Y. Chang, “Parallel spectral clustering,” inProceedings of the European Conference on Machine Learning(ECML ’08), Beijing, China, 2008.
[39] Y. Wang, H. Jiang, M. S. Drew, Z.-N. Li, and G. Mori, “Unsupervised discovery of action classes,” inProceedings of the IEEE Computer Society Conference on Computer Vision and Pattern Recognition (CVPR ’06), vol. 2, pp. 1654–1661, New York, NY, USA, 2006.