R E S E A R C H
Open Access
Image-based phenotyping for non-destructive
screening of different salinity tolerance traits in
rice
Aris Hairmansis
1, Bettina Berger
2, Mark Tester
1,2,3and Stuart John Roy
1*Abstract
Background:Soil salinity is an abiotic stress wide spread in rice producing areas, limiting both plant growth and yield. The development of salt-tolerant rice requires efficient and high-throughput screening techniques to identify promising lines for salt affected areas. Advances made in image-based phenotyping techniques provide an
opportunity to use non-destructive imaging to screen for salinity tolerance traits in a wide range of germplasm in a reliable, quantitative and efficient way. However, the application of image-based phenotyping in the development of salt-tolerant rice remains limited.
Results:A non-destructive image-based phenotyping protocol to assess salinity tolerance traits of two rice cultivars (IR64 and Fatmawati) has been established in this study. The response of rice to different levels of salt stress was quantified over time based on total shoot area and senescent shoot area, calculated from visible red-green-blue (RGB) and fluorescence images. The response of rice to salt stress (50, 75 and 100 mM NaCl) could be clearly distinguished from the control as indicated by the reduced increase of shoot area. The salt concentrations used had only a small effect on the growth of rice during the initial phase of stress, the shoot Na+accumulation independent phase termed the‘osmotic stress’phase. However, after 20 d of treatment, the shoot area of salt stressed plants was reduced compared with non-stressed plants. This was accompanied by a significant increase in the concentration of Na+in the shoot. Variation in the senescent area of the cultivars IR64 and Fatmawati in response to a high concentration of Na+in the shoot indicates variation in tissue tolerance mechanisms between the cultivars.
Conclusions:Image analysis has the potential to be used for high-throughput screening procedures in the development of salt-tolerant rice. The ability of image analysis to discriminate between the different aspects of salt stress (shoot ion-independent stress and shoot ion dependent stress) makes it a useful tool for genetic and physiological studies to elucidate processes that contribute to salinity tolerance in rice. The technique has the potential for identifying the genetic basis of these mechanisms and assisting in pyramiding different tolerance mechanisms into breeding lines.
Keywords:Rice (Oryza sativaL.); Salinity tolerance; Phenotyping; Image analysis; Growth; Senescence
* Correspondence:[email protected]
1Australian Centre for Plant Functional Genomics and the School of
Agriculture Food and Wine, Waite Campus, University of Adelaide, PMB1 Glen Osmond, Adelaide, SA 5064, Australia
Full list of author information is available at the end of the article
Background
Salinity is a major abiotic stress that threatens the sus-tainability of global rice production. Rice yield can be re-duced significantly by the addition of as little as 50 mM NaCl (Yeo and Flowers 1986), making it one of the crop species most susceptible to salt stress (Grattan et al. 2002; Munns and Tester 2008). It has been estimated that about 48 million ha of potentially useful agricultural land is unusable for growing rice in Southern Asia and South East Asia due to saline soils (Ponnamperuma and Bandyopadhya 1980; Vinod et al. 2013). The cultivation of salt-tolerant rice is important to maintain the sustain-ability of rice production in such areas. However, pro-gress with breeding programmes to develop salt-tolerant rice has been slow (Gregorio et al. 2002; Flowers 2004; Yamaguchi and Blumwald 2005). One of the limiting fac-tors in the breeding of salt tolerant rice is the availability of efficient and reliable screening techniques to select tolerant plants (Gregorio et al. 2002).
A number of screening methods for different morpho-physiological traits have been used to measure salinity tolerance in rice, including shoot weight (Yeo et al. 1990; Aslam et al. 1993), shoot Na+ concentration, the ratio of shoot Na+/K+ (Yeo et al. 1988; Gregorio and Senadhira 1993; Asch et al. 2000), leaf injury and sur-vival rate (Yeo et al. 1990; Gregorio et al. 1997), leaf area (Akita and Cabuslay 1990; Zeng et al. 2003) and bypass flow in the root (Faiyue et al. 2012). Of these traits, shoot weight was shown to be closely related to overall plant performance (Yeo et al. 1990) and to the perform-ance of the plant in the field (Aslam et al. 1993). How-ever, most protocols that measure plant biomass are destructive, thus making it difficult to measure dynamic responses in plant growth in response to salt application and to collect seed from the individuals being measured. Recent developments in image-based phenotyping have enabled the non-destructive assessment of plant responses to salinity over time and allows determination of shoot
biomass measurements without having to harvest the whole plant (Rajendran et al. 2009; Furbank and Tester 2011; Berger et al. 2012a; Jansen et al. 2014).
When plants are exposed to salt, their growth immedi-ately slows due to the shoot ion independent stress, the so-called osmotic component of salt stress, and plants produce fewer tillers (Munns and Tester 2008; Rajendran et al. 2009; Horie et al. 2012). Over time, Na+and Cl-will accumulate to toxic concentrations in the shoot, resulting in premature leaf senescence and death–the ionic com-ponent of salt stress (Tester and Davenport 2003; Munns and Tester 2008; Munns 2010; Horie et al. 2012). Import-antly, image-based phenotyping can differentiate between the effects of the osmotic and ionic components of salt stress in growing plants. This can be done by measuring growth responses immediately after salt application, be-fore the accumulation of toxic concentrations of ions in the shoot. This allows for at least some dissection of salin-ity tolerance mechanisms (Rajendran et al. 2009; Sirault et al. 2009).
Several studies have used image based phenotyping to measure salinity tolerance in crops, in particular wheat and barley (Rajendran et al. 2009; Sirault et al. 2009; Harris et al. 2010), where digital colour images were used to quantify plant biomass, leaf area and health (Rajendran et al. 2009; Harris et al. 2010; Golzarian et al. 2011). The measurement of senescent leaf area in combination with the measurement of shoot Na+concentration enabled the quantification of shoot tissue tolerance in salt stressed einkorn wheat (Triticum monococcum) (Rajendran et al. 2009). Infrared thermography has also been used to meas-ure leaf temperatmeas-ure, as a surrogate for stomatal conduct-ance, to screen the osmotic tolerance of barley and durum wheat seedlings (Sirault et al. 2009) and rice (Siddiqui et al. 2014). In the current study, high-throughput image acquisition and analysis was used to study the salinity tol-erance traits of two rice cultivars (IR64 and Fatmawati) under different levels of salt stress. The use of this tech-nology for screening individual salt tolerance traits in rice, as well as whole plant salt tolerance, is demonstrated here. These methods can now be used in genetic studies to in-form breeding programs of approaches to improve the sal-inity tolerance of rice.
Results and discussion
Imaging as a surrogate for rice shoot biomass measurements
Non-destructive imaging of plants allows multiple mea-surements of plant growth and plant health on the same individual over time, without having to harvest plant ma-terial for analysis (Rajendran et al. 2009; Furbank and Tester 2011; Berger et al. 2012b; Fiorani and Schurr 2013). Non-destructive imaging is important when measuring the dynamic response of individual plants to the onset of
an environmental stress such as salinity and water deficit. It is also important to use non-destructive techniques when plants are unique, such as early generation trans-genics, which need to be phenotyped but also maintained for seed collection. Key to the success of this technique is that the measurements obtained are quantitative, quick to obtain and a good surrogate for important traits, such as determination of plant biomass.
A number of studies have used projected shoot area to estimate the shoot biomass of different crops, such as wheat and barley under conditions of salinity stress (Rajendran et al. 2009; Harris et al. 2010; Golzarian et al. 2011).
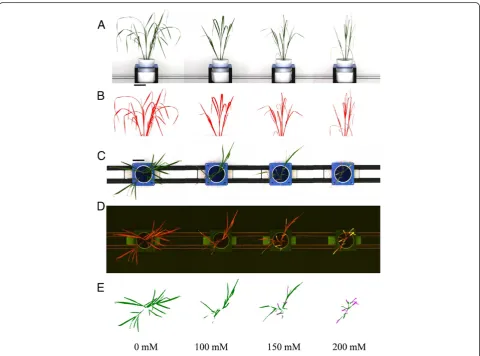
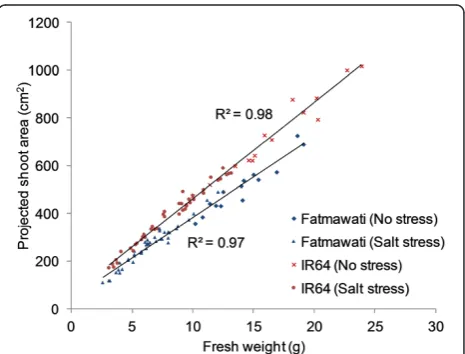
To determine whether shoot biomass of rice plants cor-related with the measurements of projected shoot area, and is therefore a quantifiable parameter that can be used to measure plant biomass, RGB images were obtained of plants that had been exposed to various salt stress levels for 20 d (Figure 1) before the fresh weight of each plant was determined by destructive harvest. The projected shoot area was calculated based on two side view images (at 90° from each other) and one top view image (Figure 1). There was a strong positive correlation between the pro-jected shoot area obtained by image analysis and shoot fresh weight in the two rice cultivars, Fatmawati (R2= 0.97) and IR64 (R2= 0.98) (Figure 2) and there was no in-dication of any deviation from a linear relationship even at the highest biomasses measured in this experiment. Pro-jected shoot area is therefore a suitable surrogate for rice shoot biomass up to six weeks of age and 24 g of shoot fresh weight (Figure 2). It is possible that the correlation
Figure 2Relationship between projected shoot areas and shoot fresh weight of rice.A positive linear relationship was observed in both rice cv. Fatmawati (R2= 0.97, n = 56) and IR64
(R2= 0.98, n = 56). The projected shoot area of rice cv. Fatmawati
between biomass and projected shoot area will still be strong for older plants, however, if running experiments on older plants then this should be confirmed, in case there are issues of areas of the plant being hidden from the camera by other parts of the plant.
IR64 and Fatmawati differ in their response to salt stress
IR64 and Fatmawati were grown in soil under moderate (0, 50, 75 and 100 mM NaCl) and high (0, 100, 150 and 200 mM NaCl) salt stress. Digital images were taken through time, at 0, 10, and 20 d after salt application.
Measurements of plant growth are important to permit an understanding of the physiological mechanisms under-lying the plant response to salt stress over time (Munns 2010), particularly to separate the effects of the osmotic
and ionic stress components, which dominate plant growth at different times (Munns and Tester 2008).
Interestingly, under these growth conditions there is no apparent reduction in biomass production immedi-ately after salt application (between days 0 and 10), sug-gesting little response to the osmotic stress component of salt stress in the growing rice plants (Figures 3 and 4). This finding differs to the responses observed in other cereal species, such as einkorn wheat (T. monococcum) (Rajendran et al. 2009), durum wheat (James et al. 2008; Rahnama et al. 2010) and bread wheat (Rahnama et al. 2011), where an immediate response to salt application can be seen - the shoot ion independent stress (osmotic stress) (Munns and Tester 2008). This early reduction in plant growth is not observed in either IR64 or Fatmawati,
suggesting these cultivars have good levels of osmotic tol-erance, and that later reductions in growth are likely to be due to ionic stress leading to an increase in premature senescence. A similar observation was reported by Moradi and Ismail (2007), where a significant reduction in growth in the seedling stage of rice only became visible after 2 weeks of salt stress. The authors hypothesised that salt tolerant rice plants have the ability to control their sto-matal conductance during the initial stress and recover their growth immediately through an acclimation process (Moradi and Ismail 2007). It is well known that IR64 is a moderately salt tolerant rice variety and has been used in-tensively in salinity tolerance studies (Asch et al. 2000; Ueda et al. 2006; Castillo et al. 2007; Nakhoda et al. 2012), however, no information is available on the salinity toler-ance of Fatmawati.
After 20 d of salt treatment, however, the projected shoot area of salt stressed rice was clearly reduced com-pared with that of the non-stressed plants, even at 50 mM NaCl. The reduction in shoot area was more pronounced under the higher concentrations of salt with the shoot area of Fatmawati and IR64 reduced by 37% and 30%, respect-ively, after 20 d of growth in 100 mM NaCl when com-pared with non-stressed plants (Figure 3). There was a slight difference in response of rice plants to 100 mM NaCl treatment between two subsequent experiments, which might be attributed to soil batches of different age being used (Figures 3 and 4). In the second experiment (high salt stress; Figure 4), after 20 d of growth under 100 mM NaCl the shoot area of Fatmawati and IR64 was reduced by 49% and 54% compared to control plants, re-spectively (Figure 4). However, the 0 mM NaCl plants in
the second experiment (Figure 4) grew bigger than in the first experiment (low salt stress; Figure 3) for both Fatmawati and IR64, while the plants grown in 100 mM NaCl reached a similar size in both experiments. The increase in biomass reduction is therefore primarily a result of the control plants growing bigger in the second experiment. The late reduction in growth rate in response to salinity in both experiments suggests that the plants ex-perience ionic stress, which can be determined by mea-surements of leaf senescence and leaf ion concentration.
Fatmawati exhibits greater shoot senescence under salinity stress than IR64
A common method for determining rates of senescence and leaf injury is the visual scoring of symptoms, classi-fying individuals on an integer scale from zero to an ar-bitrary upper value (Gregorio et al. 1997; Negrão et al.
2011). However, this process is subjective, and can vary depending on the person making the observations. In this study, fluorescence images were used to objectively quantify the degree of leaf senescence of salt stressed plants over time. No difference in senescent area could be observed between stressed and control plants 10 d after salt application. However, the total senescent area was found to increase dramatically by 20 d (Figure 5).
The cultivar Fatmawati appears to be significantly more salt sensitive than IR64, showing considerable shoot sen-escence (23%) when exposed to 200 mM NaCl for 20 d (Figure 5A). IR64, in contrast, exhibited little shoot senes-cence (4%), even under very high NaCl concentrations (Figure 5B). While there was an increase in shoot senes-cent area that corresponded to increasing salt consenes-centra- concentra-tions, both cultivars had little senescence at moderate salinity levels (Figure 5A and 5B).
IR64 plants accumulate sodium in the shoot while exhibiting low levels of shoot senescence
The concentrations of Na+ and K+ in the youngest, fully expanded leaf of both IR64 and Fatmawati were measured after 20 d of salt application. Leaf Na+ con-centrations of the stressed plants increased as ex-pected with increasing external NaCl concentration (Tables 1 and 2). The amount of Na+ in the leaf was cultivar dependent, with IR64 accumulating more leaf Na+ than Fatmawati (Tables 1 and 2). However, des-pite accumulating lower concentrations of Na+ in the leaf, Fatmawati was found to have higher levels of shoot senescence (Table 2 and Figure 5).This suggests that IR64 may have more efficient Na+ tissue toler-ance mechanisms, such as the ability to accumulate Na+ in the vacuoles of leaf cells (Garbarino and DuPont 1989; Blumwald et al. 2000). Sub-cellular measurements of ion accumulation and whole plant/tissue ion fluxes will help elucidate the mechanisms involved (James et al. 2006; Møller et al. 2009; Plett et al. 2010). Interestingly, the concentrations of shoot K+ in the stressed plants were higher than those of the control plants, perhaps suggesting that rice attempts to maintain as high a K+ concentration as possible during salt stress. However, shoot K+/Na+ ratios in the stressed plants were signifi-cantly lower than those of the non-stressed plants (Tables 1 and 2).
It was not possible to measure Na+and K+ concentra-tions in the last fully expanded leaf of Fatmawati plants grown in 200 mM NaCl due to the high level of senes-cence (Tables 2 and Figure 5).
A role for non-destructive phenotyping in screening for rice salinity tolerance
Automation of the phenotyping process in combination with automated plant handling and watering allows large numbers of plants to be screened efficiently with limited handling. Entire populations of plants can be grown in soil media, emulating field conditions (at least for the earlier stages of growth), thus facilitating the transfer of knowledge from controlled environment to growth conditions in the field. An increasing number of phenotyping facilities are now accessible globally, such as the Australian Plant Phenomics Facility (http://www.plantphenomics.org.au), used in this study, or the centres of the European Plant Phenomics Network (http://www.plant-phenotyping-network. eu). The process described here has the potential to be scaled to phenotype large numbers of rice breeding lines and mapping populations allowing the evaluation of the effect of different salt tolerant mechanisms on plant growth and yield. Screening of hundreds of mapping lines and/or rice accessions for bi-parental or association mapping studies can now be done relatively quickly for traits that require time course measurements of growth. The use of such populations has the potential to identify the underlying genetic mechanisms of salinity tolerance in a forward genetics screen.
The main limitation for the widespread adoption of this approach is the cost, but this is decreasing very rapidly as imaging technologies decrease in price and, as knowledge of phenotyping improves, short-cuts and pragmatic com-promises can be more confidently undertaken. This will be accompanied by an increasing ability to phenotype cheaply in the field–although this inevitably comes with
Table 1 Shoot Na+and K+accumulation and K+/Na+ratio
of rice cv. Fatmawati and IR64 at 20 d after application of a moderate salt stress (50, 75 and 100 mM NaCl)
Cultivar Salt stress (mM NaCl)
Na+(mM) K+(mM) Shoot K+/Na+
Fatmawati 0 1.6 ± 0.1 a 297.4 ± 6.6 a 196.8 ± 16.6
50 2.4 ± 0.3 b 343.0 ± 6.6 b 151.0 ± 14.1
75 3.3 ± 0.2 c 362.0 ± 5.6 bc 111.0 ± 5.4
100 3.4 ± 0.2 c 365.6 ± 7.2 c 111.8 ± 6.6
IR64 0 2.5 ± 0.1 b 345.1 ± 7.4 b 137.4 ± 5.1
50 4.8 ± 0.3 d 357.3 ± 10.0 bc 76.7 ± 4.4
75 5.7 ± 0.4 e 365.4 ± 3.5 c 66.4 ± 4.7
100 6.1 ± 0.4 e 385.5 ± 7.2 d 65.0 ± 4.3
F-test Cultivar (C) ** ** **
Salt stress (S) ** ** **
C x S ** * ns
Values are the means ± SE (n = 7). Values in the same column followed by the same letter are not significantly different according to LSD (0.05) test. **and * = significant atP< 0.01 and 0.05, respectively. ns = not significant.
Table 2 Shoot Na+and K+accumulation and K+/Na+ratio of rice cv. Fatmawati and IR64 at 20 d after application of a high salt stress (100, 150 and 200 mM NaCl)
Cultivar Salt stress (mM NaCl)
Na+(mM) K+(mM) Shoot K+/Na+
Fatmawati 0 1.3 ± 0.1 265.3 ± 5.5 208.3 ± 12.3 b
100 3.8 ± 0.1 326.1 ± 8.2 85.8 ± 2.1 c
150 8.2 ± 1.0 346.3 ± 9.8 46.3 ± 6.1 d
200 NA NA NA
IR64 0 0.6 ± 0.1 284.4 ± 4.8 465.2 ± 48.0 a
100 5.9 ± 0.4 320.0 ± 7.0 55.4 ± 4.8 cd
150 11.6 ± 1.1 325.7 ± 6.0 29.1 ± 2.5 d
200 12.5 ± 1.3 366.4 ± 11.0 31.2 ± 2.9 d
F-test Cultivar (C) ** ** ns
Salt stress (S) ** ** **
C x S ns ns **
a reduced ability to control and manipulate environmental conditions. As costs decrease, so the power of this ap-proach will also increase, to enable more detailed physio-logical characterization of rice genotypes (e.g. stomatal behaviour) in response to salinity (e.g. by combination of infrared (IR), RGB and fluorescence techniques).
Conclusions
An efficient and high-throughput screening protocol to select salt-tolerant rice is required to accelerate the devel-opment of salt-tolerant rice cultivars. A non-destructive image-based phenotyping method to analyse the re-sponses of rice to different levels of salinity stress has been developed and revealed differences in the effects of salt stress in two cultivars of rice, IR64 and Fatmawati. Use of non-destructive imaging technologies, such as those de-scribed here, in combination with measurements of tissue ion concentration, allow the differentiation between the ionic and osmotic components of salt stress in growing rice. This will enable the identification of new traits and sources of salinity tolerance genes that can be used to pyramid different salinity tolerance mechanisms into elite rice breeding lines.
Methods
Plant material and growth conditions
Two Indica rice cultivars, IR64 and Fatmawati, were used in this study. IR64 was developed at the Inter-national Rice Research Institute (IRRI) in the Philippines and is known as a “mega variety” because of its wide adoption and cultivation in large areas (Mackill 2008). Fatmawati is a new plant type of rice from Indonesia (Abdullah et al. 2008) which has new morphological traits, such as fewer tillers, sturdy culms and higher number of seed per panicle compared to traditional rice cultivars (Khush 1995; Abdullah et al. 2008). IR64 and Fatmawati seeds were obtained from the Indonesian Centre for Rice Research, Sukamandi, Indonesia.
Rice seeds were sorted for uniform size and then dehusked and surface sterilised with 70% (v/v) ethanol for one min followed by a 30 min bleach treatment (30% (v/v) commercial Domestos bleach solution, sodium hypochlor-ite 49.9 g/L). The seeds were then washed with RO water five times to remove all traces of bleach. Surface sterilised seeds were germinated by placing them on sterile wet filter paper in dishes. The dishes were sealed to prevent evaporation and contamination and placed in a growth chamber with 12 h light and a constant temperature of 28°C. After seven days, uniformly germinated seedlings were transferred into white plastic pots (150 mm diam-eter × 200 mm height) containing 3 kg dry University of California (U.C.) soil mix (Matkin and Chandler 1957), composed of sand and peat moss (volume ratio 1.6:1) and fertiliser (1.5 kg Mini Osmocote® per 600 litre UC soil
base). The soil surface was covered by blue plastic pellets to reduce development of algae, reduce evaporation and to provide a favourable background colour for image ana-lysis. Three rice seedlings were transplanted into each pot but were thinned to a single plant per pot after one week.
The plastic pots had drainage holes in their base, allowing watering from underneath (Figure 1A). The pots were placed in a deep white plastic saucer (160 mm × 160 mm × 90 mm) to which a volume of 600 mL of water was applied to each pot via the saucer. Water levels were monitored daily by weighing the pots using a digital scale, and pots were adjusted to the target weight by adding water to main-tain a constant salt concentration in each pot.
The rice plants were placed in a growth chamber (Con-viron, Model PGC20) at The Plant Accelerator® (Australian Plant Phenomics Facility, University of Adelaide, Adelaide, Australia) with a sinusoidal 12 hr/12 hr day/night cycle. Growth chambers were fitted with Osram FQ54W/840 HO fluorescence lights (Osram Australia, Pennant Hills, Australia) providing an average photon irradiance of 200 -300 μmol/m2/s over a 24 h period. Humidity was main-tained at 70% with day/night temperatures of 28°C/26°C, respectively.
Salt treatment
Two separate salt experiments (moderate salt stress and high salt stress) were carried out sequentially in 2012. The moderate salt experiment was conducted from 15 February to 26 March 2012 and the high salt experiment was from 23 March to 3 May 2012. In the moderate salt stress experiment, the rice cultivars were subjected to four levels of salt, 0 mM, 50 mM, 75 mM and 100 mM NaCl. In the high salt stress experiment the salt levels were 0 mM, 100 mM, 150 mM and 200 mM NaCl. Seven biological replicates were used for each treatment. Salt treatments were imposed 14 d after seedling trans-plantation in 50 mM increments every 12 h until the de-sired level was reached to minimise the osmotic shock to the plants. For each increment, 60 mL of a 0.5 M NaCl solution was applied to the saucer in which the pots sat. Additional CaCl2was added to prevent Na+ in-duced Ca2+deficiency with the ratio of Na+:Ca2+ molar concentration of 30:1 (3.3 mM CaCl2for 100 mM NaCl (Genc et al. 2010)). The concentrations of NaCl in the soil were maintained at constant levels by watering each pot to weight, as described in the previous section.
Image capture and image analysis
moved to the image capture stations. Three 5 mega pixel colour images (RGB images) were taken per plant, two from the side at 90° from each other and one from the top. Three fluorescent images were taken in a separate im-aging chamber with constant blue light excitation (400 nm to 500 nm) and a 1.4 mega pixel colour camera with a 500 nm high pass filter capturing steady-state fluorescence emission from 500 nm to 750 nm of light-adapted plants. The images captured allow detection of senescence, ne-crosis and chlorosis but are not suitable for measuring photosynthetic activity since the lighting system is not pulsed. After image capture, all images were analysed using the LemnaTec Grid software package (LemnaTec GmbH, Aachen, Germany).
In brief, the plant was separated from the imaging background using a nearest-neighbour colour classifica-tion. Noise was removed from the images using erosion and dilation steps as well as a size filter. Subsequently, all objects identified as being part of the plant were composed to one single object. The visible RGB images were used to measure size and height of the object (Berger et al. 2012a). The summed area of all three im-ages per plant was used as an approximation for shoot biomass (Rajendran et al. 2009; Golzarian et al. 2011; Berger et al. 2012a). The top view fluorescent images were used to quantify the level of shoot senescence. After object separation from the background and noise re-duction, nearest-neighbour colour classification was used to separate the shoot into healthy leaf area (red chloro-phyll fluorescence) and senescent leaf area (yellow fluores-cence; Figure 1D). The level of senescence was calculated as the percentage of senescence pixels relative to total shoot area.
Measurement of shoot biomass and shoot ion concentration
Shoots were harvested 20 d after salt application and the fresh weight was measured using a digital scale. Leaf tis-sue for shoot Na+ and K+ measurements were taken from the youngest fully expanded leaf at 20 d after salt application. The leaves were weighed immediately after harvest to determine their fresh weight and then dried in an oven at 70°C for 24 h. The dry weight was mea-sured to determine the tissue water content. Dried leaf samples were placed in 50 mL Falcon tubes and digested in 20 mL1% (v/v) nitric acid (HNO3) for 5 h in a heat block at 70°C. The samples were shaken every hour to ensure complete digestion. The concentrations of Na+and K+ were determined using a flame photometer (model 420; Sherwood Scientific Ltd., Cambridge, UK).
Competing interests
The authors declare that they have no competing interests.
Authors’contributions
AH carried out the experiments. SR, BB, MT conceived and supervised the experiments. AH and BB analysed the data. AH, BB and SR wrote the manuscript. All authors read and commented on the manuscript.
Acknowledgments
AH is financially supported by an Australian Development Scholarship, AusAID. SR and MT would like to thank the Australian Research Council and the Grains Research and Development Corporation for funding. The authors would like to thank the staff of The Plant Accelerator® for the support in undertaking this study and analysing the image results. The Plant Accelerator®, Australian Plant Phenomics Facility, was funded under the National Collaborative Infrastructure Strategy. We would also like to thank Dr Julian Taylor for statistical assistance. We are grateful to Dr Christina Morris for editing the manuscript.
Author details
1Australian Centre for Plant Functional Genomics and the School of
Agriculture Food and Wine, Waite Campus, University of Adelaide, PMB1 Glen Osmond, Adelaide, SA 5064, Australia.2The Plant Accelerator, Australian Plant Phenomics Facility, School of Agriculture Food and Wine, Waite Campus, University of Adelaide, PMB1 Glen Osmond, Adelaide, SA 5064, Australia.3Center for Desert Agriculture, Division of Biological and
Environmental Sciences and Engineering, King Abdullah University of Science and Technology, Thuwal 23955-6900, Kingdom of Saudi Arabia.
Received: 3 March 2014 Accepted: 16 July 2014
References
Abdullah B, Tjokrowidjojo S, Sularjo (2008) Development and prospect of new plant type of rice in Indonesia (in Indonesian with English abstract). Jurnal Litbang Pertanian 27(1):1–9
Akita S, Cabuslay G (1990) Physiological basis of differential response to salinity in rice cultivars. Plant Soil 123(2):277–294
Asch F, Dingkuhn M, Dörffling K, Miezan K (2000) Leaf K/Na ratio predicts salinity induced yield loss in irrigated rice. Euphytica 113(2):109–118
Aslam M, Qureshi RH, Ahmed N (1993) A rapid screening technique for salt tolerance in rice (Oryza sativaL.). Plant Soil 150(1):99–107
Berger B, de Regt B, Tester M (2012a) High-throughput phenotyping of plant shoots. In: Normanly J (ed) High-Throughput Phenotyping in Plants, vol 918. Methods in Molecular Biology. Humana Press, New York, USA, pp 9–20 Berger B, de Regt B, Tester M (2012b) Trait dissection of salinity tolerance with
plant phenomics. In: Shabala S, Cuin TA (eds) Plant Salt Tolerance, vol 913. Methods in Molecular Biology. Humana Press, New York, USA, pp 399–413 Blumwald E, Aharon GS, Apse MP (2000) Sodium transport in plant cells. Biochim
Biophys Acta Biomembranes 1465(1–2):140–151
Castillo EG, Tuong TP, Ismail AM, Inubushi K (2007) Response to salinity in rice: Comparative effects of osmotic and ionic stresses. Plant Prod Sci 10(2):159–170
Faiyue B, Al-Azzawi MJ, Flowers TJ (2012) A new screening technique for salinity resistance in rice (Oryza sativaL.) seedlings using bypass flow. Plant, Cell Environ 35(6):1099–1108
Fiorani F, Schurr U (2013) Future scenarios for plant phenotyping. Annu Rev Plant Biol 64:17.11–17.25
Flowers TJ (2004) Improving crop salt tolerance. J Exp Bot 55(396):307–319 Furbank RT, Tester M (2011) Phenomics–technologies to relieve the
phenotyping bottleneck. Trends Plant Sci 16(12):635–644
Garbarino J, DuPont FM (1989) Rapid induction of Na+/H+exchange activity in
barley root tonoplast. Plant Physiol 89(1):1–4
Genc Y, Tester M, McDonald GK (2010) Calcium requirement of wheat in saline and non-saline conditions. Plant Soil 327(1–2):331–345
Golzarian M, Frick R, Rajendran K, Berger B, Roy S, Tester M, Lun D (2011) Accurate inference of shoot biomass from high-throughput images of cereal plants. Plant Methods 7(1):2
Grattan SR, Zeng L, Shannon MC, Roberts SR (2002) Rice is more sensitive to salinity than previously thought. Calif Agric 56(6):189–195
Gregorio GB, Senadhira D (1993) Genetic-analysis of salinity tolerance in rice
(Oryza-sativaL). Theor Appl Genet 86(2–3):333–338
Gregorio GB, Senadhira D, Mendoza RD, Manigbas NL, Roxas JP, Guerta CQ (2002) Progress in breeding for salinity tolerance and associated abiotic stresses in rice. Field Crops Res 76(2–3):91–101
Harris B, Sadras V, Tester M (2010) A water-centred framework to assess the effects of salinity on the growth and yield of wheat and barley. Plant Soil 336(1–2):377–389
Horie T, Karahara I, Katsuhara M (2012) Salinity tolerance mechanisms in glycophytes: An overview with the central focus on rice plants. Rice 5(1):11 James RA, Munns R, Von Caemmerer S, Trejo C, Miller C, Condon T (2006)
Photosynthetic capacity is related to the cellular and subcellular partitioning of Na+, K+and Cl-in salt-affected barley and durum wheat. Plant, Cell Environ
29(12):2185–2197
James RA, Sv C, Condon AG, Zawrt AB, Munns R (2008) Genetic variation in tolerance to the osmotic stress component of salinity stress in durum wheat. Funct Plant Biol 35:111–123
Jansen M, Pinto F, Nagel KA, Dusschoten D, Fiorani F, Rascher U, Schneider HU, Walter A, Schurr U (2014) Non-invasive phenotyping methodologies enable the accurate characterization of growth and performance of shoots and roots. In: Tuberosa R, Graner A, Frison E (eds) Genomics of Plant Genetic Resources. Springer Netherlands, Dordecht, Netherlands, pp 173–206 Khush GS (1995) Breaking the yield frontier of rice. GeoJournal 35(3):329–332 Mackill DJ (2008) Breeding for resistance to abiotic stresses in rice: The value of
quantitative trait loci. In: Plant Breeding: The Arnel R. Hallauer International Symposium. Blackwell Publishing, Oxford, England, pp 201–212
Matkin OA, Chandler PA (1957) The U.C.-type soil mixes. In: Baker KF (ed) The U.C. system for producing healthy container-grown plants. The University of California College of Agriculture, Berkeley, California, USA, p 332 Møller IS, Gilliham M, Jha D, Mayo GM, Roy SJ, Coates JC, Haseloff J, Tester M
(2009) Shoot Na+exclusion and increased salinity tolerance engineered by cell type-specific alteration of Na+transport in
Arabidopsis. Plant Cell
21(7):2163–2178
Moradi F, Ismail AM (2007) Responses of photosynthesis, chlorophyll fluorescence and ROS-Scavenging systems to salt stress during seedling and reproductive stages in rice. Ann Bot 99(6):1161–1173
Munns R (2010) Approaches to identifying genes for salinity tolerance and the importance of timescale. In: Sunkar R (ed) Plant Stress Tolerance, vol 639. Methods in Molecular Biology. Humana Press, New York, USA, pp 25–38 Munns R, Tester M (2008) Mechanisms of salinity tolerance. Annu Rev Plant Biol
59:651–681
Nakhoda B, Leung H, Mendioro MS, Mohammadi-nejad G, Ismail AM (2012) Isolation, characterization, and field evaluation of rice (Oryza sativaL., Var. IR64) mutants with altered responses to salt stress. Field Crops Res 127:191–202
Negrão S, Courtois B, Ahmadi N, Abreu I, Saibo N, Oliveira MM (2011) Recent updates on salinity stress in rice: From physiological to molecular responses. Crit Rev Plant Sci 30(4):329–377
Plett D, Safwat G, Gilliham M, Møller IS, Roy S, Shirley N, Jacobs A, Johnson A, Tester M (2010) Improved salinity tolerance of rice through cell type-specific expression ofAtHKT1;1. PLoS ONE 5(9), doi:10.1371/journal.pone.0012571 Ponnamperuma FN, Bandyopadhya AK (1980) Soil salinity as a constraint on food
production in the humid tropics. In: Priorities for alleviating soil-related constraints to food production in the tropics, Los Banos, Philippines, 1980. International Rice Research Institute and Cornel University, Los Banos, Laguna, Philippines, p 468
Rahnama A, James RA, Poustini K, Munns R (2010) Stomatal conductance as a screen for osmotic stress tolerance in durum wheat growing in saline soil. Funct Plant Biol 37(3):255–263
Rahnama A, Poustini K, Tavakkol-Afshari R, Ahmadi A, Alizadeh H (2011) Growth properties and ion distribution in different tissues of bread wheat genotypes
(Triticum aestivum L.) differing in salt tolerance. J Agron Crop Sci 197(1):21–30
Rajendran K, Tester M, Roy SJ (2009) Quantifying the three main components of salinity tolerance in cereals. Plant, Cell Environ 32(3):237–249
Siddiqui ZS, Cho J-I, Park S-H, Kwon T-R, Ahn B-O, Lee G-S, Jeong M-J, Kim K-W, Lee S-K, Park S-C (2014) Phenotyping of rice in salt stress environment using high-throughput infrared imaging. Acta Bot Croat 73(1):149–158
Sirault XRR, James RA, Furbank RT (2009) A new screening method for osmotic component of salinity tolerance in cereals using infrared thermography. Funct Plant Biol 36(10–11):970–977
Tester M, Davenport R (2003) Na+tolerance and Na+transport in higher plants.
Ann Bot 91(5):503–527
Ueda A, Kathiresan A, Bennett J, Takabe T (2006) Comparative transcriptome analyses of barley and rice under salt stress. Theor Appl Genet 112(7):1286–1294
Vinod KK, Krishnan SG, Babu NN, Nagarajan M, Singh AK (2013) Improving salt tolerance in rice: Looking beyond the conventional. In: Azooz MM, Prasad MNV (eds) Ahmad P. Salt Stress in Plants, Springer New York, pp 219–260 Yamaguchi T, Blumwald E (2005) Developing salt-tolerant crop plants: challenges
and opportunities. Trends Plant Sci 10(12):615–620
Yeo AR, Flowers TJ (1986) Salinity resistance in rice (Oryza-Sativa-L) and a pyramiding approach to breeding varieties for saline soils. Aust J Plant Physiol 13(1):161–173
Yeo AR, Yeo ME, Flowers TJ (1988) Selection of lines with high and low sodium transport from within varieties of an inbreeding species; rice (Oryza sativaL.). New Phytol 110(1):13–19
Yeo AR, Yeo ME, Flowers SA, Flowers TJ (1990) Screening of rice (Oryza sativaL.) genotypes for physiological characters contributing to salinity resistance, and their relationship to overall performance. Theor Appl Genet 79(3):377–384 Zeng L, Poss J, Wilson C, Draz A-S, Gregorio G, Grieve C (2003) Evaluation of salt
tolerance in rice genotypes by physiological characters. Euphytica 129 (3):281–292
doi:10.1186/s12284-014-0016-3
Cite this article as:Hairmansiset al.:Image-based phenotyping for non-destructive screening of different salinity tolerance traits in rice.
Rice20147:16.
Submit your manuscript to a
journal and benefi t from:
7Convenient online submission
7Rigorous peer review
7Immediate publication on acceptance
7Open access: articles freely available online
7High visibility within the fi eld
7Retaining the copyright to your article