A Multi-Focus Image Fusion Algorithm Based on
Contrast Pyramids
Mingzhu Lai 1, Jianguo Sun 1, Liguo Zhang 1,*, Yiran Shen 1, Qing Yang 2 and Zilong Jin 3
1 College of Computer Science and Technology, Harbin Engineering University,
Harbin 150001, China; [email protected] (M.L.); [email protected] (J.S.); [email protected] (Y.S.)
2 Department of Computer Science, Montana State University, Bozeman, MT 59717, USA;
3 School of Computer and Software, Nanjing University of Information Science & Technology,
Nanjing 210044, China; [email protected]
* Author to whom correspondence should be addressed; E-Mail: [email protected]; Tel.: +86-451-8256-9610; Fax: +86-451-8256-9610.
Abstract: This paper proposes a new approach for multi-focus images fusion based on Region Mosaicing on Contrast Pyramids (REMCP). A density-based region growing method is developed to construct a focused region mask for multi-focus images. The segmented focused region mask is decomposed into a mask pyramid, which is then used for supervised region mosaicking on a contrast pyramid. In this way, the focus measurement and the continuity of focused regions are incorporated and the pixel level pyramid fusion is improved at the region level. Objective and subjective experiments show that the proposed REMCP is more robust to noise than compared algorithms and can fully preserves the focus information of the multi-focus images meanwhile reducing distortions of the fused images.
Keywords: multi-focus image, image fusion, region mosaic, contrast pyramid
1. Introduction
High magnification optical lens, such as microscopes, has very limited depth of field. When capturing an object/scene in depth with optical lens of high magnification, typically, only a small fraction of the object/scene is just in focus. Multi-focus images fusion is a process in which the registered images with different focus settings are fused to synthesize an “all-in-focus” image with extended depth of field [1][2][3]. It plays important roles in microscope imaging [4], optical image de-blurring, shape from focus [4][5] and image based forensics [6].
[14][15][16]. Despite the advantages of pyramid-based generally agreed, they are pixel based therefore sensitive to noises. Noise pixels often have high contrast, and can be falsely detected as in-focus pixels. Because the fused image obtained by transform domain-based algorithms employs global information, a small change in a single coefficient of the fused image in the transformed domain may cause all the pixel values to change in spatial domain [17]. Consequently, distortion artifacts and the loss of contrast information are often observed in fused images. To solve the problem of noisy sensitivity, gradient map filtering [8] and multiple coefficient selection principles [18] are proposed, however their performance depends on fine-tuned parameters.
Compared with pyramid-based methods, weighted linear approaches are more intuitive for image fusion [19][20][21]. When applied to multi-focus image fusion, weights for different regions are calculated based on the degree of focus and corresponding pixels from different images are combined with linear weighting. A special case of the weighted linear fusion is region mosaicking, where all the weights in focusing regions are set as ones and those of other regions as zeros. In [10], a block-based mosaic algorithm is proposed. Images are first divided into blocks then the blocks with largest spatial frequency are selected for fusion. In [22], Agarwala et al. describe an interactive framework for combining regions of a set of images into a single composite picture, called “iterative digital photomontage”. When applied to multi-focus image fusion, it can be regarded as region mosaicking approach with optimized mask segmentation on a graph-cut algorithm. Mosaic algorithms can preserve original information but they often introduce block artifacts in transitive zones around region boundaries which degrading visual perception quality of fused images. Most recently, the sparse reconstruction method is employed for weighted multi-focus image fusion [17]. Multi-focus images are represented with sparse coefficients using an over-complete dictionary then the coefficients are combined with a choose-max rule. Finally, the fused image is reconstructed from the combined sparse coefficients with respect to the over-complete dictionary. Reported results show that sparse weighted fusion achieves the highest performance among the existing weighted linear approaches.
In recent years, pulse coupled neural network (PCNN) was employed to perform weighted linear fusion with two parallel source images input. Meanwhile focus measurements are carried out for the source images and weighted coefficients are automatically adjusted based on the measurements. The method takes full advantage of neural networks and it also incorporate continuity of focused regions by defining surrounding neurons for pixels, but may be computational inefficient.
Figure 1. An illustration of 3D object imaging with an optical camera. IA and IB are image
pixels of point A and B respectively. With the current focal length, the surface that point A lies on is focused while that of point B is not. It can be seen that in-focus pixels in the image plane form a continuous region. By adjusting the object distance to the lens, a series of de-focused (part-in-focus) images could be obtained.
In this paper, we propose a simple but effective approach called Region Mosaicking on Contrast Pyramids (REMCP) for multi-focus images fusion. It is based on the observation that the in-focus pixels in a multi-focus image form continuous regions. We propose to use Density-Based Region Growing (DBRG) to generate a focus region mask for all of the multi-focus images. The DBRG uses both region growing and filtering to identify proper focus regions and reduce the impact of noises. A segmented focused region mask is decomposed into a mask pyramid, which is then applied to supervise the region mosaicking on a contrast pyramid. Then we improve pixel level pyramid fusion at the region level, where the imaging characteristics of multi-focus images are utilized and the continuity of segmented focused regions is incorporated. In the proposed REMCP approach, decomposition values of a pixel in different pyramid levels but same spatial position are from the same multi-focus image, exactly. This guarantees that distortion artifacts are reduced to minimum. In addition, the REMCP approach can also significantly reduce the artifacts those are often introduced by weighted linear fusion approaches.
The remainder of this paper is organized as follows. We first present an overview of the proposed approach in Section 2. Then the focus region segmentation is described in Section 3 and in Section 4 we propose a new multi-focus images fusion approach REMCP. Then experimental results are provided in Section 5, and the paper is concluded in Section 6.
2. Overview of our approach
Figure 2. Flowchart of the proposed REMCP approach. For the limitation of space, three of fifteen multi-focus images are given, while others are omitted for the limited space.
Then DBRG is applied to refine the extracted clear pixels, connect them into clear regions and form a focus region mask (Section 3). The focus region mask is then decomposed into a mask pyramid, corresponding to the CPs of focus images. The mask pyramid contains label values of multi-levels, indicating which pyramid will be selected in the fusion procedure (Section 4).
Since the mask image contains continuous regions instead of disconnected pixels, in the fusion procedure, one segmented region will be selected from one of the CP images. Then all selected regions cover the pyramid. This procedure is referred as region mosaicking on pyramids. After region mosaicking, a reconstruction procedure is carried out to obtain the final “all-in-focus” image as the output.
3. Focus region segmentation
3.1 Pixel level focus measurement
There are many ways of focus measurement including variance, Energy of image Gradient (EOG), Energy of Laplacian (EOL) of the image, Sum-Modified-Laplacian (SML), and spatial frequency (SF) [1][7][8]. In [1], the authors assessed these methods and reported that SML and EOL measurement can provide better performance than others. Considering the computational efficiency, we choose EOL in this paper.
We define a neighboring window of size (-w, w) around the pixel I(x, y), then apply EOL on the pixels within the window to measure the focus. The EOL within the neighboring window is calculated as
(
)
(
) (
)
(
)
( )
(
) (
)
(
) (
)
( , ) ( , )
2
( , ) 1, 1 4 1, 1, 1 4 , 1
20 , 4 , 1 1, 1 4 1, 1, 1
x w w y w w
EOL x y I x y I x y I x y I x y
I x y I x y I x y I x y I x y
∈ − ∈ −
= − − − − − − − + − −
+ − + − + − − + − + +
If a pixel lies in a focused and non-smooth region, its neighboring pixels will tend to have large variance, leading to large value of EOL. Otherwise, the EOL is small. Assuming that there are multi-focus images to be fused, we define a mask image M0 whose pixel values lie in [1, N]. Let EOLn(x, y)
denote the EOL value of the nth multi-focus image at pixel (x, y). The pixel-level mask image M0 is
initially labeled as
( )
(
)
0( , ) arg max , , 1, 2,3,...,
n n
M x y = EOL x y n= N . (2) M0(x, y) = n
is the EOL value of the nth multi-focus image at pixel (x, y), the maximum among the N images.
3.2 Focus region segmentation
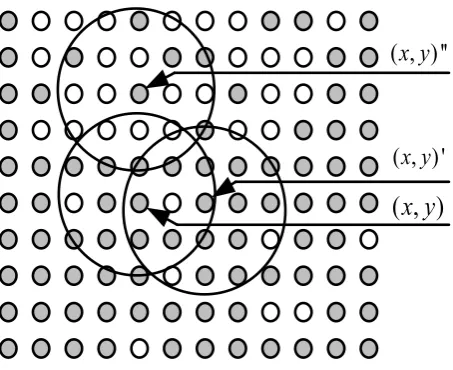
Figure 3. An illustration of density-connectivity of pixels of same mask label. As pixels marked with the ‘gray’ label, (x, y)′ is density-connected with (x, y), but (x, y)′′ is not density-connected with (x, y) in terms of the density-connectivity defined below.
( , ) ''x y
( , )'x y
( , )
x y
Image segmentation is applied in many scenarios as a common pretreatment method [24][25]. DBRG segmentation algorithm is applied based on the analysis of density distribution of pixels of same labels. As illustrated in Figure 3, the spatial neighborhood Ω(x, y) of a given pixel (x, y) is defined as a circle with center at the pixel and radius R. R is determined experimentally. The density distribution in Ω(x, y) is defined as
( )
(
0)
( , ) 2
( , ) ( , )
1
( ) ,
x y
a b x y
D n M a b n
R δ
π
Ω
∈Ω
= =
, (3)where (a, b) denotes a pixel in Ω(x, y), δ(·) returns 1 when the input is true, otherwise it returns 0. If the maximum density maxn
(
DΩ( , )x y ( )n)
of Ω(x, y) is larger than a threshold 0.5, then the pixel (x, y)is called a core pixel and Ω(x, y) forms a core region. A pixel (x, y)′ is density-connected from pixel (x,
y) if (x, y)′ is within the spatial neighborhood of (x, y), as shown in Figure 3.
Table 1. Mask Segmentation via DBRG
Input: Pixel-level mask image M0
Output: Region-level mask image M
1.Create a region-level mask image M, setting all of the pixels to unlabeled;
2.Search the unlabeled pixels in M0 to find a core pixel (x, y) and core region, Ω(x, y). If a core pixel
(x, y) is found, a new cluster is created with the cluster label
( )
, arg max(
( , )x y ( ))
nM x y = DΩ n . (4)
3.Iteratively collect unlabeled pixels in M that are density-connected with (x, y) in M0, and label
these pixels with same cluster label;
4.If there are still existing core pixels in the image, goto 2;
5.For the pixels that are not included in any clusters (noise pixels or pixels from smooth region), merge them with the cluster that has the most adjacent pixels.
The density-connectivity among pixels is transitive as density reachability, which is consistent with the imaging characteristics of multi-focus images. In smooth regions, focus measurements are not stable since the EOL is small. Noisy pixels can have larger EOL than the true focused pixels. The density based thresholding and growing can reduce the label errors on smooth regions or noisy pixels.
4. Region mosaicking on contrast pyramids
The focus region segmentation procedure results in a mask that indicates focused regions of all images. This mask is decomposed into a mask pyramid to supervise the fusion processes on the contrast pyramid. This procedure is called region mosaicking on pyramid.
4.1 Contrast pyramid fusion
According to the definition in [10], the contrast pyramid (CP) and Gaussian pyramid (GP) are related as following:
( )
,( ) ( )
, / ,( )
,l l l
C p q =G p q V p q −U p q , (5) where Cl(p, q), l=0,…,L-1 denotes the pixel value of CP at lth level and location (p, q), Gl(p, q),
l=0,…,L denotes the pixel value of GP at the lth level and location (p, q), V
l(p, q), l=0,…,L-1 denotes
the low-pass-filtered GP. U denotes a matrix whose elements are all equal to 1. Gl(p, q) is calculated
by a convolution operation between a Gaussian filter and its upper-level GP image:
( )
,( )
, 1(
2 , 2 ,)
1,...,l l
G p q = f p q G∗ − p q l= L, (6) where f(p, q) denotes a Gaussian filter of 5×5 pixels and * is convolution operator. GL is the base
image and G0=I denotes an original multi-focus image.
After that, we compute the ratio of the low-pass filtered images at successive levels of the GP. We insert new values ‘0’ between the given values of the lower frequency image, and then perform a low-pass-filtering as
( )
, 4 ( , )* 1 2 2, , 0,..., 1l l
p q
V p q = ⋅f p q G+ l= L−
The classical CP algorithm exploits a pixel level competition and fusion on pyramids as
( )
( )
( )
,,
, , , 0,..., 1
arg max , , 1,...,
l l n
l n n
RC x y C x y l L
n C x y n N
= = −
= =
, (8)
where RCl denotes the level of the fused CP, Cl, n (x, y) denotes contrast value of pixel (x, y) at lth level
of the nth multi-focus image and N denotes the total number of multi-focus images.
Figure 4. Illustration of REMCP with two multi-focus images (N=2) and three pyramid levels (L=2). There are two CPs and two base images. The focus label mask is decomposed into a pyramid of three levels as Ml, l=0, 1, 2. Different colors in M0 indicate focused
regions from different multi-focus images, which are to be reconstructed by fusing the Contrast Pyramids and the base images following the position relationship indicated by the mask pyramid. Cl, 1, l=0, 1 denotes the CP pyramid of the first image, and Cl, 2, l=0, 1 the
second image. GL, 1 and GL, 2 denote the base images of two GPs. FC0 and FC1 denote the
fused CPs . Symbol ‘+’denotes the fusion operation.
1,1
C
1,2
C
0,1 C
0,2
C
,1 L
G
,2 L
G
1
FC
0
FC
L
FG
0
M
1
M
L
4.2 Region based contrast pyramid fusion
According to equation (8), the pixel-level fusion pyramid values are selected according to the contrast magnitudes of their source images. In this case, it is found that regions selected for fusion in different pyramid levels are not similar figures. Therefore, many pixels to be reconstructed with pixel values come from more than one multi-focus image. As a result, the original clear information is lost and distortion is introduced. Therefore, we propose the region based pyramid fusion scheme, i.e., REMCP as following.
As shown in Figure 4, in REMCP, the segmentation mask M(p, q) is first decomposed into a mask pyramid, Ml(p, q), l=0,…,L, which is then used to supervise a region level fusion of CP. The
corresponding formulation is as follows,
, ( , )
( , ) l ( , ), 0,...,
l l M p q
FC p q =C p q l= L, (9)
where FCl(p, q) denotes the contrast fusion result of pixel (p, q) at the lth level, Ml(p, q) denotes the
mask label of the lth level CP, indicating which multi-focus image should be selected for fusion at pixel
(p, q).
The base image fusion is performed as
, ( , )
( , ) L ( , )
L L M p q
FG p q =G p q , (10) where FCL(p, q) denotes the fusion result of pixel (p, q) in the base image at lth level. , ( , )( , )
L
L M p q
G p q
denotes the value of (p, q) of the base image. ML(p, q) denotes the label of pixel (p, q) of the original
mask image, calculated by the DBRG segmentation algorithm in Section 3.
In the region based fusion procedure, Ml+1 is the sub-sampling copy of Ml, therefore corresponding
regions in them are strict similar figures. Consequently, most of the pixels (except for the pixels that lie on region transitive zones) in the fused image are reconstructed with pixel values from the same multi-focus images, and as a result, much of the original clear information is kept and distortion is reduced.
When reconstructing the boundary areas, information from more than one multi-focus image is used. This may induce slight focus information loss in the transitive zones around the boundary areas. However, the usage of more than one multi-focus image information guarantees the gradual transformation of a transitive zone meanwhile eliminating the block artifacts of the fused images.
With the fusion results in the fused CPs (FCl, l=0,…,L-1), the low-pass-filtered GPs, (Vl, l=0,…,
L-1), and the fused base GP image, FGL(p, q), a reconstruction procedure is then carried out with
( )
,(
( ) ( )
, ,)
( )
, , 1,...,0l l l
FG p q = FC p q +U p q ×V p q l L= − , (11) which is derived from equation (5). The reconstruction starts from the base GP where FGL(p, q)= GL(p,
q) . Then it iteratively calculates the GPs until FG0 is obtained. 5. Experiments
5.1 Datasets
Fifteen groups of focus images for subjective evaluation (Set A) and twelve groups of multi-focus images (Set B) for objective evaluation are collected. Each group has 3-70 demulti-focused images with various depths and textured surfaces. The multi-focus images for subjective evaluation (Set A) were captured with a microscope for image forensics, which have an objectives and eyepieces of magnification 10.0 and 2.0 ratios respectively. The images for subjective evaluation (Set B) are synthetic multi-focus images.
5.2 Subject evaluation
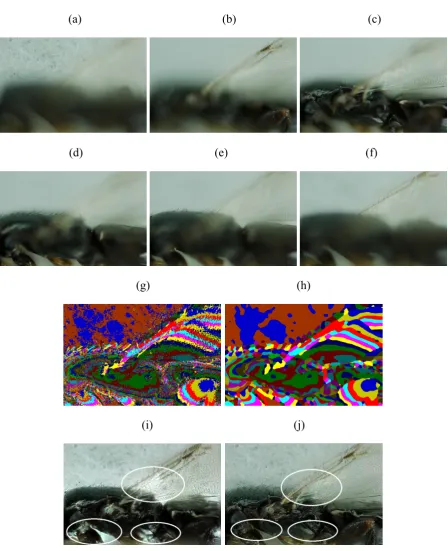
In Figure.5, six images under different focus parameters of the “bullet” image sequence are shown. For the depth variation of the “top of bullet” object, each image has only a stripe region in focus as indicated by a color stripe in the mask image (Figure.5h). When we use the pixel level focus measurement to calculate focus pixels, it can be seen in Fig.5g that the mask image is noisy and have some errors.
When the DBRG algorithm of a proper R parameter is employed, clear focus regions are segmented, as shown in Figure.5h. In Figure.5i and Figure.5j the fusion results of a contrast pyramid method and the proposed REMCP approach are compared. It can be seen that in the highlighted regions with two circles in Figure.5i and Figure.5j, the fusion result of CP method has some color distortion. While the result of REMCP approach has minimal distortion which validates the effectiveness of the proposed region mosaicing strategy in reducing distortion. In Figure.6, an image sequence of an object with more complex 3D shape is shown. The results and comparison in Figure.6i and Figure.6j demonstrate the performance of the REMCP approach over pixel level CP approach.
5.3 Objective evaluation
On synthetic multi-focus images with groundtruth “all-in-focus” images, we use two statistical variances to evaluate the fusion accuracy: Root Mean Squared Error (RMSE) and Structural Similarity (SSIM) [26][27], where RMSE is defined as
( )
( )
(
')
21 1
1
, ,
X Y
x y
RMSE I x y I x y
X Y = =
= −
×
, (12) where X and Y are the width and height of the image, I(x, y) denotes pixel color value of the fused image and I′(x, y) denotes the pixel color value of the reference image. Lower RMSE indicates better performance of the fusion algorithm. The SSIM is defined as:(
)(
)
(
2 2 1)(
2 2 2)
1 2
2 R I 2 RI
R I R I
C C
SSIM
C C
μ μ σ
μ μ σ σ
− +
=
Figure 5. Fusion of the “top of bullet” sequence, which contains fifty images in total. (a)-(f) are six sampled examples of the multi-focus images, (g) is the mask image with only EOF measurement, (h) is the mask image with the proposed DBRG segmentation algorithm. (i) is the fusion result of the CP method and (j) of the proposed REMCP approach.
(a) (b) (c)
(d) (e) (f)
(g) (h)
Figure 6. Fusion of the “bee” image sequence, which contains sixty images in total. (a)-(f) are six sampled examples of the multi-focus images, (g) is the mask image with only EOF measurement, (h) is the mask image with the proposed DBRG segmentation algorithm. (i) is the fusion result of the CP method and (j) of the proposed REMCP approach.
(a) (b) (c)
(d) (e) (f)
(g) (h)
(i) (j)
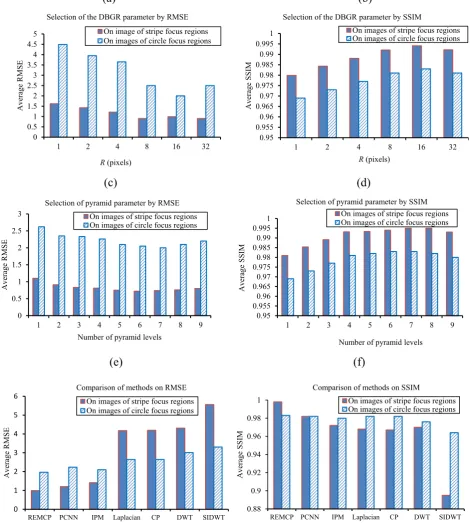
be scaled proportional to the image size. A larger value of R reduces not only the precise but also the fusion speed.
Figure 7. (a) RMSE and (b) SSIM under different DBRG radius for the focus region mask segmentation. (c) RMSE and (d) SSIM under different pyramid levels.(e) and (f) are comparisons of REMCP, PCNN [1], IDP [22],CP[10], Laplacian pyramid [11], DWT[7] and shift invariance DWT [13] methods.
(a) (b)
(c) (d)
(e) (f)
In Figure 7c and Figure 7d, it can be seen that when the number of pyramid levels is 6 or 7, the RMSE and SSIM are the highest. A smaller or larger number of pyramid levels cannot take the full
0 0.5 1 1.5 2 2.5 3 3.5 4 4.5 5
1 2 4 8 16 32
Average RMSE
R(pixels)
Selection of the DBGR parameter by RMSE On image of stripe focus regions On images of circle focus regions
0.95 0.955 0.96 0.965 0.97 0.975 0.98 0.985 0.99 0.995 1
1 2 4 8 16 32
Average SSIM
R(pixels) Selection of the DBGR parameter by SSIM
On images of stripe focus regions On images of circle focus regions
0 0.5 1 1.5 2 2.5 3
1 2 3 4 5 6 7 8 9
Average RMSE
Number of pyramid levels Selection of pyramid parameter by RMSE
On images of stripe focus regions On images of circle focus regions
0.95 0.955 0.96 0.965 0.97 0.975 0.98 0.985 0.99 0.995 1
1 2 3 4 5 6 7 8 9
Average SSIM
Number of pyramid levels Selection of pyramid parameter by SSIM
On images of stripe focus regions On images of circle focus regions
0 1 2 3 4 5 6
REMCP PCNN IPM Laplacian CP DWT SIDWT
Average RMSE
Comparison of methods on RMSE On images of stripe focus regions On images of circle focus regions
0.88 0.9 0.92 0.94 0.96 0.98 1
REMCP PCNN IPM Laplacian CP DWT SIDWT
Average SSIM
Comparison of methods on SSIM
advantages of pyramid fusion. This shows that a proper setting of pyramid level is significantly important for the objective quality of the fused image.
In Figure 7e and Figure 7f, we compared our proposed approach with five state of the art methods including CP [10], Laplacian pyramid [11], DWT [7], SIDWT [13], IDP [22] and PCNN [1]. PCNN is implemented according to the descriptions in [1]. For the “interactive photomontage” (IDP) approach, we use the program provided by the authors on website1. All of the other approaches can be obtained
from website2.
In Figure 7e, we can find seen that the RMSE of REMCP is the lowest among all compared methods, which indicates highest fusion accuracy. In Figure 7f, REMCP approach achieves the best SSIM among compared methods, indicating that it can preserve the original information of the multi-focus images best. Therefore, the proposed REMCP approach improves the performance of the state of the arts.
Considering the computation issue, the existing PCNN method has significantly higher computing complexity for it is iterative operations, while the proposed REMP approach is significantly more efficient. When performing fusion, our implemented PCNN approach spends about 12.0 seconds on average to fuse an image of 720×480 pixels with an Intel CORE i5 CPU, while the proposed REMCP approach spends only 1.5 seconds. In contrast, the IDP approach that uses a graph-cut optimal algorithm to calculate focus region mask spends 2.6 seconds on average.
6. Conclusions
In this paper we present a new multi-focus image fusion approach, called REMCP, which explores unique characteristics of multi-focus imaging. REMCP transfer the pixel-based classical pyramid fusion to region-based. The experimental results and comparisons with other methods demonstrate that the proposed method is capable of handling multi-focus images more accurately in various practical conditions than the state of the arts it can significantly reduce the fusion errors and color distortions as well as preserve the visual perception quality.
However, the impact of miss-alignment of images is not considered in this paper. We leave this issue as future work.
Acknowledgments
This work is supported by the National Science Foundation of China with No. 61501132, the China Postdoctoral Science Foundation No. 2016M591515, the Heilongjiang Postdoctoral Sustentation Fund with No. LBH-Z14055.
Author Contributions
Liguo Zhang and Mingzhu Lai wrote the paper and conceived the experiment; Jianguo Sun and Yiran Shen supervised the overall work and reviewed the paper; Qing Yang and Zilong Jin contributed the experimental data and analysis.
Conflicts of Interest
The authors declare no conflict of interest.
References
1. Wang, Z.; Ma, Y.; Gu, J. Multi-focus image fusion using PCNN. Pattern Recognition. 2010, 43, 2003-2016.
2. Favaro, P.; Soatto, S. Shape from defocus via diffusion. IEEE Trans. Pattern Analysis and Machine Intelligence. 2008, 30, 518-531.
3. Wang, R.; Xu, B.; Zeng, P.; Zhang, X. Multi-focus image fusion for enhancing fiber microscopic images. Textile Research Journal. 2012, 82(4), 352-361.
4. Tsai, D.C.; Chen, H.H. Reciprocal focus profile. IEEE Trans. Image Processing. 2012, 21(2), 459-468.
5. Hariharan, R.; Rajagopalan, A. N. Shape-From-Focus by Tensor Voting. IEEE Trans. Image Processing. 2012, 21(7), 3323-3328.
6. Peters, T.; Bowyer, K.W.; Flynn, P.J. Iris recognition using signal-level fusion of frames from video. IEEE Trans. Information Forensics and Security. 2009, 4(4), 837-848.
7. Pajares, G.; Cruz, J.M. A wavelet-based image fusion tutorial. Pattern Recognition. 2004, 37, 1855-1872.
8. Tian, J.; Chen, L. Multi-focus image fusion using wavelet-domain statistics. IEEE International Conference on Image Processing. 2010, 1205-1208.
9. Petrovic, V. S.; Xydeas, C.S. Gradient-based multiresolution image fusion. IEEE Trans. Image Processing. 2004, 13, 228-237.
10. Ruyven, T.V.; Valeton, J.J. Merging thermal and visual images by a contrast pyramid. Optical Engineering. 1989, 28, 789-792.
11. Zhang, Z.; Blum, R.S. A categorization of multiscale decomposition-based image fusion schemes with a performance study for a digital camera application. Proceedings of IEEE. 1999, 87, 1315-1326.
12. Toet, A. Image fusion by a ratio of low-pass pyramid. Information Fusion. 1989, 9, 245-253. 13. Rockinger, O. Image sequence fusion using a shift-invariant wavelet transform. Proceedings of Int.
Conf. on Image Processing. 1997, 3, 288-291.
14. Do, M.N.; Vetterli, M. The contourlet transform: an efficient directional multi-resolution image representation. IEEE Trans. Image Processing. 2005, 14(12), 2091-2106.
15. Li, S.T.; Yang, B.; Multifocus image fusion by combining curvelet and wavelet transform. Pattern Recognition Letters. 2008, 29(9), 1295–1301.
16. Li, H.; Chai, Y.; Li, Z. Multi-focus Image fusion based on non-sub-sampled contourlet transform and focused regions detection. Optik-International Journal for Light and Electron Optics. 2013,
124, 40–51.
17. Yang, B.; Li, S.T. Multifocus image fusion and restoration with sparse representation. IEEE Trans. Instrumentation and Measurement. 2010, 59(4), 884-892.
19. Li, S.T.; Kwok, J.T.; Wang,bY. Combination of images with diverse focuses using the spatial frequency. Information Fusion. 2001, 2, 169-176.
20. Li, S.T.; Yang, B. Multifocus image fusion using region segmentation and spatial frequency.
Image and Vision Computing. 2008, 26(7), 971-979.
21. Kubota, A.; Aizawa, K. Reconstructing arbitrarily focused images from two differently focused images using linear filters. IEEE Trans. Image Processing. 2005, 14(11), 1848 - 1859.
22. Agarwala, A.; Dontcheva, M.; Agrawala, M.; Drucker, S.; Colburn, A.; Curless, B.; Salesin D.; Cohen, M. Interactive Digital Photomontage. ACM Transactions on Graphics (Proceedings of SIGGRAPH 2004). 2004, 294-302.
23. Hariharan, H. Koschan, A.; Abidi, M. An adaptive focal connectivity algorithm for multifocus fusion. IEEE International Conference on Computer Vision and Pattern Recognition. 2007, 1-6. 24. Yuhui Z.; Byeungwoo J.; Danhua X.; Jonathan Wu Q.M.; Hui Z. Image segmentation by
generalized hierarchical fuzzy C-means algorithm. Journal of Intelligent and Fuzzy Systems. 2015,
2(28), 961-973.
25. Li J.; Li X.; Yang B.; Sun X. Segmentation-based Image Copy-move Forgery Detection Scheme.
IEEE Transactions on Information Forensics and Security. 2015, 3(10), 507-518.
26. Wang, Z.; Bovik, A.C. Sheikh, H.R. Simoncelli, E.P. Image quality assessment: from error visibility to structural similarity. IEEE Trans. Image Processing. 2004, 13, 600-612.
27. Goshtasby, A. A.; Nikolov, S. Image fusion: advances in the state of the art. Information Fusion. 2007, 8(2), 114–118.