Environmental Research, Engineering and Management, 71(3), 3-4 ISSN 1392-1649 (print) Aplinkos tyrimai, inžinerija ir vadyba, 71(3), 3-4 ISSN 2029-2139 (online)
http://dx.doi.org/10.5755/j01.erem.71.3.13789 © 2015 EREM
Editorial
Design of Biomethane Supply System Using
Ecodesign Approach and System Dynamics
Modelling
Prof. Dr. Gatis Bazbauers
Institute of Energy Systems and Environment, Faculty of Power and Electrical Engineering, Riga Technical University, Riga, Latvia
E-mail: gatis.bazbauers@rtu.lv
Biomethane can be produced from biogas by upgrading it to the quality of natural gas. This way it is possible to obtain a renewable substitute for natural gas, which may be injected into the natural gas grid and used in existing technologies without the need for replacement. Grid-supply of biomethane offers several important advantages. It allows substituting fossil for a renewable energy source in the technologies which require gaseous fuels, e.g. natural gas-fired industrial furnaces, gas engines and combined cycle gas turbine cogeneration plants. Biogas, after purification, can be diverted from distributed biogas-fired power plants, which often are relatively inefficient due to the lack of sufficient heat loads, to large district heating systems with efficient cogeneration possibilities. Biomethane supply via a natural gas grid would also facilitate maintenance and development of the natural gas supply infrastructure in future when consumption of natural gas may decline due to an increased share of renewable energy.
However, several important questions arise. First, is biomethane a sound choice from the environmental point of view in comparison with natural gas and potential renewable alternatives, e.g. biofuels, which also can be often used in natural gas-fired systems? Second, is biomethane an economically feasible alternative to natural gas? If not, what is the level of support required for production of biomethane to be put in price parity with natural gas? And finally, how should a support policy for a biomethane supply chain be designed to make it sustainable over time? These questions have been addressed in the research performed at the Institute of Energy Systems and Environment of Riga Technical University and the results have been published in several peer-reviewed papers.
In principle, the design of a biomethane supply system involves the system innovation from the ecodesign perspective since it allows improving environmental performance of the whole system currently using natural gas. Therefore, by following the ecodesign approach one should employ tools of environmental impact assessment, e.g. life cycle assessment (LCA), for the comparison of design alternatives from the environmental standing. This has been done by applying LCA to the case of brick production industry in Latvia and analysing “cradle-to-gate” environmental impacts per 1 ton of the product when the following fuels are used in the industrial furnace: natural gas, biomethane, and 1st and 2nd generation liquid biofuels. “ReCiPe” has been used as the environmental impact
assessment method. The results show that the environmental impact could be reduced by circa 50% when biomethane is substituted for natural gas, and that biomethane and the 2nd generation biofuel have roughly equal
environmental impact as the 1st generation biofuel, being far worse than even natural gas. Other studies based on
life cycle inventory data have indicated that the use of biomethane instead of natural gas may reduce greenhouse gas emissions by nearly 80%. The environmental benefits of fuel substitution, i.e. system innovation versus gradual improvements of natural gas-fired equipment efficiencies, can thus be clearly seen.
grid. The total costs have been calculated for 5 different biogas upgrading technologies and it has been found that the difference between the total biomethane production costs among these technologies was relatively small, i.e. approximately 3%. The total costs can be reduced significantly, i.e. by circa 30%, if biogas producers cooperate and build a single larger biogas production and upgrading facility instead of several of a smaller size. This indicates that the spatial distribution of biogas reactors and possibilities for cooperation among biogas producers to a large extent will determine competitiveness of grid-injected biomethane with natural gas. Currently, financial support is required for production of grid-injected biomethane since the minimum total costs of production achieved at the best scenario with 20 years of economic lifetime are nearly 50 EUR/MWh, exceeding the price of natural gas by approximately 16%. For economic lifetime of 10 years, the difference is about 34%. Therefore, we come to the need for the design of an appropriate support policy for the development of a biomethane supply system.
System dynamics modelling is a well-suited tool for the design of a renewable energy support policy since it allows analysing complex dynamic systems with feedbacks, delays and non-linearity. System dynamics has been successfully used at the Institute of Energy Systems and Environment for modelling of power and district heating supply systems, design of energy efficiency and waste management policies, analysis of the transport sector and sustainable energy supply systems. The challenge for energy policy makers lies in setting up the support system which leads to the perceived optimal growth of the renewable energy share and, for that reason, can be sustained over a long period of time. As experience shows, this is not a case in many countries, including Latvia, where support has led to the overshoot of the perceived limit of the financial support which can be carried by national economy, and it was corrected by a complete or nearly complete stall in the support. It is often noted that due to complexity of the energy supply system policy decisions for support of sustainability are difficult, i.e. it is difficult to foresee the dynamics of evolvement of the required support. Therefore, system dynamics has been chosen for creating the model which reveals the most crucial part in the support policy implementation, i.e. the structure of the policy system which leads to successful implementation of the support. Very few studies using system dynamics for the analysis of renewable energy policies have a focus on the structure of the support policy itself but rather look at the consequences in terms of the renewable energy share if the support is implemented or absent. The structure of the support policy for biomethane is built up by 2 parallel flows, i.e. the flow of granted permits to receive support, and the flow of actual investments into biomethane production facilities. Actual biomethane production is compared with the target value, which is based on the perceived limit of financial support at a certain period of time, and the feedback is taken back for adjusting dynamics of permit granting. This structure is similar to biological systems where a marginal increase of distribution of a certain plant in a limited territory decreases over time as space available for new plants shrinks. It is considered in the analysis of dynamics that not all permits will lead to actual investments and some will be cancelled after a certain period of time. This modelling approach allows comparison of several support alternatives, i.e. investment subsidies versus tariff or feed-in-premium. Development of specific investments into technologies due to the learning effect and dynamics of a natural gas price are considered as well.
Environmental Research, Engineering and Management, 71(3), 5-12 ISSN 1392-1649 (print) Aplinkos tyrimai, inžinerija ir vadyba, 71(3), 5-12 ISSN 2029-2139 (online)
http://dx.doi.org/10.5755/j01.erem.71.3.12715 © 2015 EREM
Greywater Treatment with Simultaneous Generation of Energy
Using Low-Cost Microbial Fuel Cells
K. J. Sajithkumar and E. V. Ramasamy
School of Environmental Sciences, Mahatma Gandhi University, Kottayam, Kerala, India
Corresponding author:
E. V. Ramasamy, School of Environmental Sciences, Mahatma Gandhi University, Kottayam, Kerala, 686560, India
E-mail: evramasamy@rediffmail.com
(received in July 2015; accepted in September 2015)
Microbial fuel cells (MFCs) are an emerging type of biological wastewater treatment units with simultaneous power generation. The present study demonstrates an effective treatment of greywater and generation of electricity in a double-chambered MFC. This MFC was fabricated using cost-effective and easily available materials replacing expensive materials like Nafion membranes, graphite electrodes, etc. Experimental results showed a maximum open circuit voltage of 0.64 ± 0.04 V and 114 ± 1.41 mA current during the study period. The results further indicate a maximum power generation of 24.50 mW along with 307.69 mW/m² of power density; 34.62 mA/m² of current density, 1.33 W/m³ of volumetric power density, 0.15 A/m³ of volumetric current density and a power yield of 0.40 mW/kg of COD removal. The chemical oxygen demand (COD) removal efficiency was 77.6%. The use of low-cost and easily available raw materials has brought down the total manufacturing cost of MFCs used in this study to less than USD 4.0. However, the performance of the MFCs used in the current study is comparable with other sophisticated MFCs built with expensive raw materials, as reported in the literature. This cost-effective MFC used in the present study might be an cost-effective replacement of expensive MFCs for wastewater treatment at scaled-up levels.
Keywords: greywater, microbial fuel cell (MFC), wastewater treatment, cost-effective, power output.
1 Introduction
A huge volume of wastewater is being discharged annually from domestic, industrial and agriculture sectors. Greywater is the wastewater exiting from households; excluding the wastewater from toilets and including bathrooms, bathtubs, showers, hand wash basins, laundry machines and kitchen sinks. In order to manage the alarming threat of drinking water scarcity in and around the world, there is an increasing demand in the treatment and reuse of greywater. About 75% of residential sewage fraction is greywater (Eriksson et al., 2002). As compared with black (toilet) water, greywater contains low concentrations of organic compounds, nutrients and pathogens (Otterpohl, 2002). Therefore, in order to manage the water scarceness, it makes sense to collect greywater separately and treat it for irrigation, washing or other non-potable applications. It should
be treated properly to meet the discharge standards prior to their release into the environment (Suzuki et al.; 2002, Maekawaet al., 1995).
drawbacks of anaerobic reactors, particularly in a small-scale biogas plant (Gangrekar & Shinde, 2006). An alternative technique emerging more recently for wastewater treatment and energy production is microbial fuel cells (MFCs). In MFCs, electricity can be produced with simultaneous degradation of organic matter by microorganisms. MFCs are generally fabricated into 2 chambers: one is anode chamber, while the other is cathode chamber. The cathode chamber is maintained with anaerobic conditions and the organic material given as a substrate will be oxidised by the anaerobic microorganisms; the electrons lost in the process are transferred to the anode by either an electron carrier (mediator) added in the MFC or directly from the respiratory enzyme of the microbes (mediator less) (Logan et al., 2007)
From the literature survey, it can be noted that extensive research on microbial fuel cells is going on on a laboratory scale and most of such studies have been using double or single chamber MFCs with expensive raw materials including Nafion-based proton exchange membranes (Logan et al., 2007; Venkata Mohan et al., 2008; Greenman et al., 2009; Wen et al., 2009; Sangeetha et al., 2011). The generation of electricity using MFCs with different substrates has also been reported. In most of the MFCs, pure compounds such as acetate (Bond & Lovely, 2003), glucose (Rabaey et al., 2003), sucrose (He et al., 2006), amino acid (cysteine; Logan et al., 2005), and proteins (bovine serum albumin) (Heilmann & Logan, 2006) are used as substrates. Wastewater from various industries, such as swine (Min et al., 2005), meat packing (Heilmann & Logan, 2006), food processing (Kim et al., 2004), beer brewery, paper (Mathuriya & Sharma, 2009a, 2009b), corn stover hydrolysates (liquefied corn stover) (Zuo et al., 2006), food processing industries (Sangeetha et al., 2011), and wastewater from domestic activities (Liu et al., 2004) have also been treated using MFCs. Most of the previous studies have reported that MFCs operated with wastewater generate a lower amount of energy than those operated with pure compounds.
Greywater, even though it is a good source of organic matter, has not been reported so far as a substrate in MFCs. Hence, in the present study, greywater was used as a substrate in double-chambered MFCs. Double-double-chambered MFCs have been successfully operated by many researchers for the simultaneous generation of electricity and wastewater treatment (Min et al., 2005; Raghavulu et al., 2009; Jadhav & Ghangrekar, 2009; Sangeetha et al., 2011) with expensive raw materials, such as graphite electrodes and Nafion-based proton exchange membranes. Hence, the development of MFCs with cost-effective raw materials is a thrust area of research in MFC studies. In this context, the major objective of the present study is to develop laboratory-scale MFCs with cost-effective materials and use them in greywater treatment. The performance of double-chambered MFCs treating greywater was assessed in terms of electricity production, removal of chemical oxygen demand (COD removal) and total solids (TS).
2 Materials and methods 2.1 Substrates used
Greywater was collected from the student’s hostel of Mahatma Gandhi University and stored under the refrigeration at 4°C before use. After analysing the characteristics (Table 1), greywater was used as the substrate for MFC without any modifications, such as pH adjustment or the addition of nutrients/trace metals. The experiments were conducted using full-strength wastewater.
2.2 Microbial fuel cells
The whole experiment was designed with 2 double-chambered MFCs, which were fabricated with salt bridges as described by Mohan et al., (2008) and Min et al., (2005). Two polyethylene terephthalate (PET) bottles of 400 mL capacity were used as 2 chambers of each MFC. One bottle was used as the anode chamber and maintained under anaerobic conditions. The other bottle was used as the cathode chamber, maintained aerobic by providing an external air supply with a sparger network (Mohan et al., 2007). Carbon brushes were used as electrodes in each chamber. The electrodes were kept 10 cm apart from each other and were externally connected through copper wires after sealing the contact area with epoxy resin. The chambers were provided with inlet and outlet ports. Both the anode and cathode chambers were connected through a salt bridge of 8.5 cm length and 1.1 cm inner diameter, prepared by using KCl solution and agar-agar.
2.3 Experimental methods. MFC operation
MFC operation was started by filling the anode chamber with 250 mL of greywater (substrate) and 50 mL of digested effluent from an ongoing anaerobic reactor as inocula. In all MFCs, the cathode chamber was kept in aerobic conditions with KCl solution (300 mL) as catholyte and was replenished once in a week as it got denatured. Initially, the MFCs were operated in the batch mode for 10 days, i.e. without further addition of the substrate during this period. This is to facilitate the acclimatisation of microbes with the substrate. After 10 days of the batch mode, both MFCs were operated semi-continuously for a total period of 30 days with 6 cycles of feeding at an interval of 5 days each. On each cycle, daily feeding of 50 mL of the substrate was carried out and, thus, at the end of each cycle, a total of 250 mL substrate was treated. The total experimental period including the batch mode of operation was 40 days. Daily monitoring of voltage and current was carried out during the study period, with different loads of resistance using a digital multimeter. Periodic assessment of greywater treatment in MFCs was done in terms of COD and total solids removal.
Greywater Treatment with Simultaneous Generation of Energy Using Low Cost Microbial Fuel Cells relation P = v2/R
external, where v represent voltage (V)
and R is the external resistance load. Power density (mW/m2) and current density (mA/m2) were
calculated by dividing the obtained power and current by the anode surface area (m2). Power yield (W/kg
COD removal) was obtained by dividing power with corresponding substrate (COD) removal values. Volumetric power (W/m3) and current density (A/m3)
were calculated based on the anode liquid volume (Venkata Mohan et al., 2007).
3 Results and discussion
The characteristics of greywater used in the study was analysed and the results are presented in Table 1. Daily monitoring of voltage and current was carried out during the study period, with different loads of resistance using a digital multimeter. Each measurement lasted for 3 minutes at each resistance and concordant values. The results were presented as average of MFCs calculated to evaluate the performance of respective duplicate cells of MFCs.
Table 1. Characteristics of greywater used as substrate in MFC.
Parameters Characteristics
1st cycle 2nd cycle 3rd cycle 4th cycle 5th cycle 6th cycle
pH 6.30 6.52 6.45 6.25 6.20 6.14
Total Solids (mg/L) 1,915 1,910 2,440 2,555 2,030 1,900 Nitrate (mg/L) 6.50 6.81 7.13 7.77 7.43 7.89 Sulphate (mg/L) 15.85 15.67 16.47 15.69 15.15 16.33 Phosphate (mg/L) 22.69 23.71 24.25 24.16 22.80 23.69 Chemical Oxygen Demand (mg/L) 1,382 1,396 1,402 1,402 1,384 1,400
Results in terms of electricity generation from wastewater
After inoculation and feeding, a slow increase in the current was observed in all MFCs. After 10 days of acclimatisation of the microbes with the substrate, a steady current was observed as output in MFCs. The development of microbial population in the form of biofilm has been found to occur between 6 to 15 days until a stable current generation was obtained (Liu et al., 2005). In the present study, the open circuit voltage (OCV) was also observed as a steady output
after 10 days of operation. OCV is the cell voltage between 2 terminals of a device when disconnected from any circuit. The maximum OCV of 0.64 ± 0.04 V and 114 ± 1.4 mA of the current were recorded on day 36 (Figure 1). From the figure, it is clear that the potential of the MFC increases as the number of days increases. The results obtained in the present study are comparable with those of Dalvi et al. (2011), who conducted a study on electricity generation with paneer whey degradation with different microorganisms in a dual-chambered MFC and the results showed an OCV of 0.45 V.
Figure 1. Open circuit voltage and current of MFC treating greywater.
Even though the performance of an MFC can be evaluated in many ways, it is principally done with power output. The power output is usually normalised to the projected anode surface area, where most of the biological activity occurs. In the present study, the power production in MFCs reached the maximum of 24.50 mW on day 36 (Figure 2). It may be noted that the power output showed increments after each feeding of MFCs, indicating multiplication of microbes and their acclimatisation to the new
Figure 2. Power generation graph of MFC treating greywater.
Table 2 shows the power generation details of MFCs. At the continuous external load of 100 Ω resistances, the maximum power density of 307.69 mW/m2, current density of 34.62 mA/m2,
volumetric power density of 1.33 W/m3, and
volumetric current density of 0.15 A/m3 were
recorded.
Table 2. Average power generation details of MFCs at 100 Ω resistances. No of
Days
Power density
mW/m2
Volumetric power density W/m3
Current density mA/m2
Volumetric current density A/m3
1-10 days* 0.275 ± 0.123 0.001 ± 0.001 1.231 ± 0.649 0.005 ± 0.003
11 0.62 0.0027 3.0769 0.0133
12 0.77 0.0033 3.8462 0.0167
13 0.77 0.0033 3.8462 0.0167
14 3.08 0.0133 4.6154 0.0200
15 4.81 0.0208 6.1538 0.0267
16 6.92 0.0300 6.9231 0.0300
17 12.31 0.0533 6.1538 0.0267
18 19.23 0.0833 7.6923 0.0333
19 43.27 0.1875 7.6923 0.0333
20 23.27 0.1008 15.38462 0.0667
21 27.69 0.1200 15.38462 0.0667
22 43.27 0.1875 21.53846 0.0933
23 43.27 0.1875 22.30769 0.0967
24 37.69 0.1633 14.61538 0.0633
25 49.23 0.2133 34.61538 0.1500
26 49.23 0.2133 22.30769 0.0967
27 43.27 0.1875 27.69231 0.1200
28 49.23 0.2133 22.30769 0.0967
29 55.58 0.2408 29.23077 0.1267
30 55.58 0.2408 20.76923 0.0900
31 49.23 0.2133 15.38462 0.0667
32 49.23 0.2133 15.38462 0.0667
33 62.31 0.2700 21.53846 0.0933
34 76.92 0.3333 22.30769 0.0967
35 69.42 0.3008 14.61538 0.0633
36 173.08 0.7500 34.61538 0.1500
37 173.08 0.7500 22.30769 0.0967
38 307.69 1.3333 27.69231 0.1200
39 235.58 1.0208 29.23077 0.1267
40 76.92 0.3333 20.76923 0.0900
*1-10 days – the batch mode of operation was carried out, and the average values of the results are presented.
Lu et al. (2009) operated an MFC with starch processing wastewater containing 4,900 mg/L of COD over 4 cycles and obtained the maximum power density of 239.4 mW/m2 in the third cycle. Similar
results were also reported by Sangeetha et al., (2011)
Greywater Treatment with Simultaneous Generation of Energy Using Low Cost Microbial Fuel Cells (Jang et al., 2004). In the present study, the electrodes
of MFCs were kept at a distance of 10 cm resulting in good power output (Figure 2). The effect of electrode distance on MFC performance was carried out by Sangeetha & Muthukumar (2012) varying it as 10 cm, 12 cm and 15 cm. Their study revealed that electrode distance of 10 cm resulted in increased power production with a voltage of 900 mV (millivolts), current of 9.0 mA (milliamps) at 100 Ω resistances and COD removal of 94%. A similar trend of an increase in MFC performance with a decreasing distance between the electrodes was observed by Liu et al. (2005), Kim et al. (2007), Ghangrekar & Shinde (2007), and Cheng et al. (2006).
Effect of organic loading rate on power generation.
The amount of electricity produced from wastewater depends upon COD loading (Oh and
Logan, 2005). The present study showed greater power output with high COD loading. Wastewater from various sources with a COD ranging 1,000 – 10,000 mg/L is a potential substrate for MFCs (Pant et al., 2009). Greywater used in the present study had an average COD value of 1394.33 ± 9.04 mg/L. The overall COD removal efficiency observed in the present study was 71.36 ± 1.93%, demonstrating the feasibility of this configuration of MFCs as an effective wastewater treatment system, also ensuring better effluent quality. The organic matter present in greywater at the anode chamber was effectively consumed by microorganisms resulting in COD removal from greywater (Figure 3). Power yield of MFCs with respect to daily COD removal was calculated and shown in Figure 4. In accordance with the COD reduction results, MFCs showed a power yield of 0.40 mW/kg CODremoval.
Figure 3. Results in terms of percentage COD removal.
Figure 4. Power yield of MFC treating greywater.
The solid removal efficiency of MFCs was also analysed and the results are shown in Figure 5. During the study period, the effluent samples from both MFCs
Figure 5. Total and volatile solid concentration in the effluent from MFCs.
4 Conclusions
The efficiency of MFCs used for the treatment of greywater was successfully evaluated in the present study with remarkable results of electricity production and COD removals. One of the major drawbacks of conventional MFCs, which utilize graphite electrodes and Nafion-based proton exchange membranes, is high cost. The significance of the present study is the cost effectiveness of the raw materials used for the fabrication of MFCs. In the present study, in order to transfer protons to the cathode, a salt bridge and carbon brushes were used as electrodes, which are less expensive and easily available. This low-cost MFC, with the manufacturing cost of less than USD 4.0, has performed with comparable performance on a par with many sophisticated MFCs employing expensive proton exchange membranes. The low-cost MFCs used in the present study may be an effective alternative for an expensive Nafion-based MFC in wastewater treatment at scaled-up levels. However, the lower electrode potential of the present MFC has to be improved by decreasing its internal resistance. Further studies are presently going on towards improving the performance of the cathode with less internal resistance using low-cost raw materials.
Acknowledgements
The financial support from the Department of Environment and Climate Change (DoECC), Government of Kerala through ‘Paristhithiposhini’ fellowship programme is gratefully acknowledged. The authors also gratefully acknowledge the support from DST-PURSE and DST-FIST, Government of India.
References
APHA (American Public Health association) (1995). Standard methods for examination of water and wastewater, 19th edition. APHA, Washington DC, USA.
Behera, M., Jana, P. S., & Ghangrekar, M. M. (2010). Performance evaluation of low cost microbial fuel cell fabricated using earthen pot with biotic and abiotic cathode. Bioresource technology, 101(4), 1183-1189.
http://dx.doi.org/10.1016/j.biortech.2009.07.089 Bond, D. R. & Lovley, D. R. (2003). Electricity production
by Geobactersulfurreducensattached to electrodes. Applied and Environmental Microbiology, 69(3),1548– 1555.
http://dx.doi.org/10.1128/AEM.69.3.1548-1555.2003 Dalvi, A. D., Mohandas, N., Shinde, O. A., & Kininge, P. T.
(2011). Microbial fuel cell for production of bioelectricity from whey and biological waste treatment. International Journal of Advanced Biotechnology and Research, 2(2), 263-268.
Eriksson, E., Auffarath, K., Henze, M., & Ledin, A. (2002). Characteristics of grey wastewater. Urban water, 4, 85-104.
http://dx.doi.org/10.1016/S1462-0758(01)00064-4 Ghangrekar, M. M. & Shinde, V. B. (2006). Microbial fuel
cell: a new approach of wastewater treatment with power generation. In: International Workshop on R&D Frontiers in Water and Wastewater Management. Nagpur, India, pp. 20-21.
He, Z., Wagner, N., & Minteer, S. D. (2006). An up flow microbial fuel cell with an internal resistance by impedance spectroscopy. Environmental Science and Technology, 40, 5212–5217.
http://dx.doi.org/10.1021/es060394f
Heilmann, J. & Logan, B. E. (2006). Production of electricity from proteins using a single chamber microbial fuel cell. Water Environment Research, 78(5), 531–537.
http://dx.doi.org/10.2175/106143005X73046
Jadhav, G. S. & Ghangrekar, M. M. (2009).Performance of microbial fuel cell subjected to variation in pH, temperature, external load, and substrate concentration. Bioresource Technology, 100, 717–723.
http://dx.doi.org/10.1016/j.biortech.2008.07.041 Jadhav, G. S., Jagtap, Y. D., & Ghangrekar, M. M. (2013).
Greywater Treatment with Simultaneous Generation of Energy Using Low Cost Microbial Fuel Cells Liu, H. & Logan, B. E. (2004). Electricity generation using
an air-cathode single chamber microbial fuel cell in the presence and absence of a proton exchange membrane. Environmental Science and Technology, 38(14), 4040-4046.
http://dx.doi.org/10.1021/es0499344
Liu, H., Ramnarayanan, R., & Logan, B. E (2004). Production of electricity during wastewater treatment using a single chamber microbial fuel cell. Environmental Science and Technology. 38:2281-2285.
http://dx.doi.org/10.1021/es034923g
Logan, B. E., Hamelers, B., Rozendal, R., Schröder, U., Keller, J., Freguia, S., & Rabaey, K. (2006). Microbial fuel cells: methodology and technology. Environmental science & technology, 40(17), 5181-5192.
http://dx.doi.org/10.1021/es0605016
Lu, N., Zhou, S., Zhuang, L., Zhanag, J. T., Ni J. R. (2009). Electricity generation from starch processing wastewater using microbial fuel technology. Biochemical engineering journal, 43, 246-251.
http://dx.doi.org/10.1016/j.bej.2008.10.005
Maekawa, T., Liao, C. M., & Feng, X., D. (1995). Nitrogen and phosphorus removal for swine wastewater using intermittent aeration batch reactor followed by ammonium crystallization process. Water Research, 29(12), 2643-2650.
http://dx.doi.org/10.1016/0043-1354(95)00153-C Min, B., Cheng, S., & Logan, B. E. (2005). Electricity
generation using membrane and salt bridge microbial fuel cells. Water research, 39(9), 1675-1686.
http://dx.doi.org/10.1016/j.watres.2005.02.002 Otterpohi, R. (2002). Options for alternative types of
sewerage and treatment systems directed to improvement of the overall performance. Water science and technology, 45(3), 149-158.
Pant, D., Van Bogaert, G., Diels, L., & Vanbroekhoven, K. (2009). A review of the substrates used in microbial fuel cells (MFCs) for sustainable energy production. Bioresource Technology, 101(6), 1533-1543
Rabaey, K., Lissens, G., & Siciliano, S. D. (2003). A microbial fuel cell capable of converting glucose to electricity at high rate and efficiency. Biotechnology Letters, 25(18), 1531–1535
http://dx.doi.org/10.1023/A:1025484009367
Raghavulu, S. V., Mohan, S. V., Goud, R. K., & Sarma, P. N. (2009). Effect of anodic pH microenvironment on microbial fuel cell (MFC) performance in concurrence with aerated and ferricyanidecatholytes. Electrochemistry Communications, 11, 371–375
http://dx.doi.org/10.1016/j.elecom.2008.11.038 Rodrigo, M. A., Canizares, P., Lobato, J., Paz, R., Sáez, C.,
& Linares, J. J. (2007). Production of electricity from the treatment of urban waste water using a microbial fuel cell. Journal of Power Sources, 169(1), 198-204.
http://dx.doi.org/10.1016/j.jpowsour.2007.01.054 Sangeetha, T. & Muthukumar, M. (2011). Catholyte
performance as an influencing factor on electricity production in a dual chambered microbial fuel cell employing food processing wastewater. Energy Sources, Part A, 33, 1514–1522.
Suzuki, K., Tanaka, Y., Osada, T., & Waki, M. (2002). Removal of phosphate, magnesium and calcium from swine wastewater through crystallization enhanced by aeration. Water Research, 36(12), 2991-2998.
http://dx.doi.org/10.1016/S0043-1354(01)00536-X Zuo, Y., Maness, P. C., & Logan, B. E (2006). Electricity
production from steam-exploded corn stover biomass. Energy Fuels, 20(4), 1716–1721
Pilkojo vandens valymas ir elektros energijos generavimas,
naudojant nebrangius mikrobinius kuro elementus
K. J. Sajithkumar ir E. V. Ramasamy
Aplinkosaugos mokslų fakultetas, Mahatma Gandhi Universitetas, Kottayam, Kerala, Indija
(gauta 2015 m. liepos mėn.; priimta spaudai 2015 m. rugsėjo mėn.)
Mikrobiniai kuro elementai (angl. microbial fuel cells – MFCs) – tai besivystantys biologinio nuotekų tvarkymo technologija, kuri tuo pačiu metu generuoja elektros energiją. Šis tyrimas pristato efektyvų pilkojo vandens valymą kartu su elektros energijos gamyba dvigubos kameros MFCs. MFCs buvo pagaminti naudojant rentabilias ir lengvai prieinamas medžiagas, pakeičiant tokius brangius metalus, kaip Nafion membranos, grafito elektrodai ir pan. Eksperimentiniai rezultatai parodė, kad tyrimo metu didžiausia atviros elektros srovės įtampa siekė 0,64 ± 0,04 V, o srovės stipris 114 ± 1,41 mA. Rezultatai taip pat parodė, kad išvystyta galia siekė 24,5 mW, kai galios tankis buvo 307,69 mW/m²; srovės stiprio tankis 34,62 mA/m², galios tūrinis tankis 1,33 W/m³, srovės stiprio tūrinis tankis 0.15 A/m³ ir galios išeiga 0,40 mW/kg cheminio deguonies suvartojimo (ChDS) panaikinimui. ChDS pašalinimo efektyvumas siekė 77,6%. Nebrangių ir lengvai prieinamų žaliavų naudojimas leido sumažinti šiame tyrime naudotų MFCs bendrus gamybos kaštus iki mažiau nei 4,0 JAV dolerių. Nepaistant to, šiame tyrime naudotų MFCs rezultatai gali būti sulyginami su kitais sudėtingais MFCs, kurie yra sukurti naudojant brangias žaliavas, pateiktas literatūroje. Šie rentabilūs tyrime naudojami MFCs gali būti efektyvus pakaitalas brangiems MFCs, kurie naudojami nuotekoms valyti aukštesniuose lygiuose.
Environmental Research, Engineering and Management, 71(3), 13-22 ISSN 1392-1649 (print) Aplinkos tyrimai, inžinerija ir vadyba, 71(3), 13-22 ISSN 2029-2139 (online)
http://dx.doi.org/10.5755/j01.erem.71.3.12474 © 2015 EREM
Assessment of Metal Pollution of Soil and Diagnostic Species
Associated with Oil Spills in the Niger Delta, Nigeria
Paul O. Fatoba, Clement O. Ogunkunle, and Cynthian O. Ihaza
Environmental Biology Unit, Department of Plant Biology, University of Ilorin, NigeriaCorresponding author:
Clement O. Ogunkunle, Environmental Biology Unit, Department of Plant Biology, P. M. B. 1515, University of Ilorin, 240003 Nigeria
E-mail: seyeogunkunle@gmail.com (ogunkunle.co@unilorin.edu.ng)
(received in June 2015; accepted in July 2015)
An ecological impact assessment of crude-oil spills was carried out on the environment of an oil-rich community in the Niger Delta of Nigeria. Samples of the topsoil (0−15 cm), subsoil (15−25 cm) and the dominant species Gamba grass (Andropogon gayanus) were collected using the transect method from the point of spills. The samples were also collected from an unimpacted location (control). The samples were wet-digested and the concentrations of Pb, Cd, Cu, and Zn were determined by flame atomic absorption spectrophotometry, while the physico-chemical properties of the topsoil were determined by standard methods. The data were subjected to Student t test, ANOVA and Pearson correlation analysis, and the models for pollution assessment were employed to assess the pollution status of the soil and plant species. The results showed that concentrations of Pb, Cu and Zn in the topsoil exceeded international standards at close proximity to point of spills (0−200 m), while Cd concentrations exceeded the international standard at all the locations. Only Cd exceeded the international standard in the subsoil. Contamination (Pi) and
integrated pollution (Pc) indices of the topsoil showed reducing trends from the point of pollution,
and locations at 0 m and 100 m exhibited high Pc, while those at 200 m showed moderate Pc by all
metals. The levels of Pb and Cd in the diagnostic species exceeded the World Health Organization limits and the pollution load index (PLI) portrayed severe contamination. In conclusion, the impact of crude-oil spills in the area was significant; soil remediation is important to avert ecological and human health disasters. Moreover, these findings will be useful for designing strategic measures for environmental control in the area.
Keywords: oil spillage, integrated pollution index, soil remediation, pollution load index.
1 Introduction
In the quest for industrialisation and greater economic empowerment, many developing countries, including Nigeria, have interfered with the environment to the extent that there is currently widespread environmental degradation and devastation with attendant climatic, economic and health effects. Since the beginning of petroleum production in Nigeria in 1958, many documents are available on the petroleum spills into agricultural lands through petroleum production operations (Odu et al., 1985; Imoobe & Iroro, 2009). Although, the petroleum industry has contributed immensely to the economy and development of Nigeria, oil exploration, transportation and marketing operations have also
(2000) indicted oil spills for the introduction of heavy metals such as Cu, Ni and Hg into the soil, which impair the biota due to their toxicity. Oil spill affects the physical-chemical properties of the soil, such as temperature, structure, nutrient status and pH. The effects of heavy metal pollution may be immediate if crops planted in spill sites which have accumulated the metals are consumed by man and livestock.
Okordia and Oya in Ikarama community are hosts to Agip and Shell companies, but very little has been documented with respect to the impact of their activities on immediate environment. Based on this, the community needs to be environmentally audited from time to time so as to advise the stakeholders in the petrochemical industries, the government and the local communities on the potential health risks posed by the oil industry. Several studies have also indicated that metal pollution (e.g. Pb, Cd and Ni) is responsible for certain diseases of humans and animals (Gustav, 1974; Nolan, 2003; Young, 2005); and thus, there is a need for cleaning up oil-contaminated soil. So far, phytoremediation has proved to be cheaper and sustainably feasible in cleaning up pollutants from the soil (Joner et al., 2004). Hence, identification of plants growing in oil-spill impacted land with potentials to accumulate metals is imperative in order to establish suitable plants for the clean-up of metals in oil-spill impacted locations. Therefore, this study was undertaken to investigate the impact of oil spill on the soil and vegetation of this oil-rich community with respect to their heavy metal loads.
2 Materials and methods 2.1 Study area
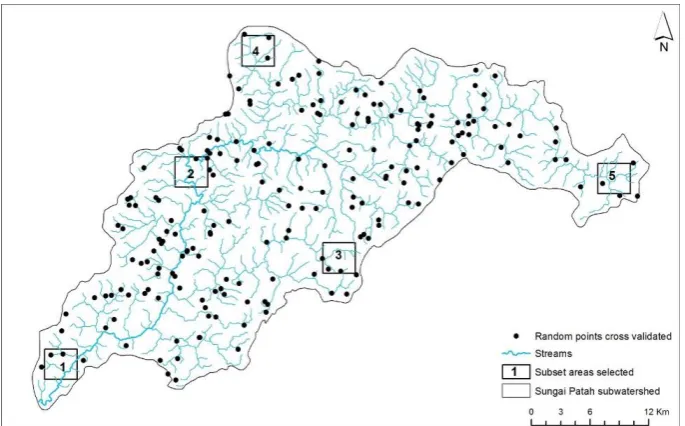
The study sites Okordia and Oya are in Ikarama (05°09’16” N, 06°27’11 E), a small community situated within Yenogoa Local Government Area, Bayelsa State, Nigeria (Figure 1). Bayelsa state is strategically located at the centre of the Niger Delta region of Nigeria, which is one of the richest wetlands in the world with a tropical climatic condition of a rainy season (April to November) and a dry season (December to March) and an annual rainfall ranging between 1,500 and 4,000 mm (Kuruk, 2004). Ikarama community is a host to Nigeria’s Agip Oil Company and Shell Petroleum Development Company (SPDC). The SPDC pipelines linking Delta, Bayelsa and River states in Nigeria pass through Ikarama community and oil spills from equipment failure have been reported to be the major environmental contamination of this community (MOEN, 2008). The 2 study sites were chosen because of the frequent occurrence of oil spills in the sites. For example, 421 crude oil spills occurred between 18 December 1991 and 23 August 2008 in the state, while 9 major oil spills occurred within Ikarama community (MOEN, 2008). Moreover, more recent crude oil spills also occurred in December 2008 and June 2009 in Oya and Okordia, respectively.
Assessment of Metal Pollution of Soil and Diagnostic Species associated with oil Spills in the Niger-Delta, Nigeria 2.2 Sampling and chemical analysis
Soil and plant samples were collected from 2 oil-spill impacted sites at Okordia and Oya and the sampling activities were carried out in September 2009. At each crude-oil impacted site, a line transect was set from the centre point of the spill in any accessible direction and soil samples were collected at every 100 m along the transect to a distance of 400 m. The short transect distance was premised on the fact that most of the area was inundated with seawater. At every sampling point, 5 soil samples were randomly collected from the depth of 0−15 cm and 15−25 cm, respectively (topsoil and subsoil, respectively), with a stainless soil auger, and a total of 50 soil samples (25 samples each of topsoil and subsoil) were collected in each site. The dominant plant species – Gamba grass (Andropogon gayanus) – was sampled at every point of soil collection in the 2 sites, while the samples that served as the control were collected at Zarama, a location that has not experienced crude oil spill. Roots of the samples were discarded at the site and the shoots were properly packed in a paper bag and labelled for laboratory analysis.
The soil samples were air-dried at room temperature, sieved through a 2-mm mesh and ground into fine powder. One (1) g of the soil sample was wet-digested using the Aqua regia method described by ISO (2002). The resulting digestate was filtered using Whatman No 42 filter paper into a beaker and diluted with deionised water to make up 25 mL. Four metal concentrations (Pb, Cd, Cu, and Zn) were determined by flame atomic absorption spectrophotometer (Bulk Scientific 210VGP, USA). One (1) g of the powdered plant sample was digested in 10 mL of conc. HNO3 on
a hot plate until fumes turned white. The solution was filtered using Whatman No 42 filter paper and analysed for Pb, Cd, Cu and Zn using the FAAS (Bulk Scientific 210VGP, USA).
Procedural blanks and replicates’ digestion were carried out for QA/QC. A calibration graph for each element determined by the AAS was drawn by using a series of working standard solutions (CPI International, USA) and correlation coefficients greater than 0.850 were obtained for all the elements. The soil pH was determined in a soil-deionised water suspension (1:2.5 w/v) by a calibrated pH meter (PHS-3C model); electrical conductivity (EC) was determined using a conductivity bridge (Hanna EC– 214 model) and soil particle size fractions were determined by the method of Bouyoucos (1962).
2.3 Statistical analyses and assessment of metal pollution
The data generated were subjected to the analysis of variance (ANOVA) and the means were separated with Duncan multiple range test (DMRT) using the Statistic Package for Social Sciences (SPSS) and Excel 2007 for Windows version 16. Student t test was employed to test a significant difference between the metal in the soil and the diagnostic plant, while Pearson coefficient of correlation was used to
determine the relationship between the metal in the soil and the plant at p < 0.05, respectively.
Heavy metal pollution of the soil was assessed by the use of the contamination index (Pi) and
integrated contamination index (Pc) models suggested
by Huang (1987). The expression for the models is represented in Equations 1-4 and the applied threshold values (mg kg-1) are presented in Table 1.
𝑃𝑖=C𝑖 X 𝑎
⁄ [Ci ≤ Xa] (1)
𝑃𝑖= 1 + ⌈C𝑖− X𝑎 X 𝑏− X𝑎
⁄ ⌉ [Xa < Ci ≤ Xb] (2)
𝑃𝑖= 2 + ⌈C𝑖− X𝑏 X 𝑐− X𝑏
⁄ ⌉ [Xb < Ci ≤ Xc] (3)
𝑃𝑖= 3 + ⌈C𝑖− X𝑐 X 𝑐− X𝑏
⁄ ⌉ [Ci >Xc] (4)
where Ci is the metal concentration in the soil; Xa
is the bo-pollution threshold value; Xb is the lowly
polluted threshold value and Xc is the highly polluted
value. The threshold values of Xa, Xb and Xc are
defined in Table 1 based on the Chinese Environmental Quality Standard for soils (SETAC, 1995).
The integrated contamination index (Pc) for each
study distance was calculated by the following formula:
P𝑐= ∑ (P𝑖− 1) 𝑛
𝑖=1
(5)
The classes of Pi and Pcaccording to Huang
(1987) are presented in Table 2.
Table. 1. Threshold values (mg/kg) for contamination index (Pi) (SETAC, 1995).
Pb Cd Cu Zn
Xa 35 0.2 35 100
Xb 250 0.3 50 200
Xc 500 1.0 400 500
Table 2. Classes of contamination index (Pi) and
integrated pollution index (Pc) (Huang, 1987;
D’Souza et al., 2013).
Class Contamination
index (Pi)
Integrated pollution index (Pc)
No Pi ≤ 1 Pc ≤ 0
Low 1 ≤ Pi ≤ 2 0 < Pc ≤ 7
Moderate 2 ≤ Pi ≤ 3 7 < Pc ≤ 21
High Pi > 3 Pc > 21
The heavy metal pollution status of the diagnostic species was assessed using the contamination factor (CF) and the pollution load index (PLI) suggested by Fernandez & Carballeira (2001) and Kalavrouzioti et al. (2012), respectively:
𝐶𝐹 = 𝐶𝑚/𝐶𝑏
(6)
where Cm is concentration of the metal
determined in the plant species; Cb is concentration of
CF < 1 – showed no contamination (NC); 1 < CF < 2 – suspected contamination (SC); 2 < CF < 3.5 – slight contamination (SLC); 3.5 < CF < 8 – moderate contamination (MC); 8 < CF < 27 – severe contamination (SEC); and CF > 27 – extreme contamination (EC) (Gonzalez-Miqueo et al., 2010).
𝑃𝐿𝐼 = 𝑛√∑ 𝐶𝐹1× 𝐶𝐹2× 𝐶𝐹𝑛 𝑛
𝑖=1
(7)
Values of PLI close to 1 indicate that elemental loads of plant species are near to the background level, PLI 1−3 shows moderate pollution, and values > 3 indicate severe pollution (Daud et al., 2006).
3 Results and discussion
3.1 Level of heavy metals in topsoil and subsoil
The characteristics of the topsoil in the study sites are presented in Table 3. The topsoil was predominantly sandy with less than 2% silt and 8%
clay and acidic. The sandy portions were found to constitute more than 90% of the topsoil in Okordia and Oya. The pH values of the soil ranged from 4.66 to 5.6 and from 4.09 to 4.76 for Okordia and Oya, respectively, showing that the soils were acidic. Increased acidity has been reported to enhance mobility, solubility and availability of elements in soils (Odu et al., 1985; Sauve et al., 1997). The acidic nature of the soil of the area is not surprising because most of the soils in the south-south geographical zone of Nigeria are acidic and which may be due to their exposure to excessive precipitation leading to leaching of the basic cations and being replaced by hydrogen ion (Ngobiri et al., 2007). This finding was consistent with the reports of Osuji & Nwoye (2007) as they also reported a pH range of 4.9–5.1 in crude-oil polluted soil and 5.6 in unpolluted soil. The electrical conductivity (EC) of the 2 oil-impacted sites range from 0.08 to 0.15 dS/m and from 0.07 to 0.18 dS/m for Okordia and Oya, respectively. The high EC observed in these impacted soils may be linked to the crude-oil spill, suggesting the presence of highly soluble solutes.
Table 3. Physico-chemical characteristics of topsoil of Okordia and Oya.
Soil characteristics
Location Distance (m) Sand (%) Silt (%) Clay (%) pH (1:2.5) EC (dS m-1) (1:2.5)
Okordia 400 93.07±1.79 1.67±0.75 5.27±2.54 4.82±0.61 0.08±0.05 300 93.63±2.51 0.60±0.20 5.73±2.39 5.06±0.90 0.09±0.06 200 91.60±2.21 1.73±0.91 6.67±2.75 4.66±1.07 0.08±0.03 100 91.27±2.01 1.77±0.93 6.93±2.47 5.09±0.77 0.13±0.02 0 93.43±2.68 1.23 ±1.02 5.17±2.79 5.62±0.55 0.15±0.03 Oya 400 87.57±3.19 2.17±0.60 6.93±2.11 4.44±0.58 0.07±0.01 300 91.17±2.47 1.63±0.95 7.20±2.25 4.76±1.09 0.08±0.02 200 91.90±1.45 1.77±0.85 6.33±1.59 4.09±0.58 0.09±0.03 100 92.37±0.81 1.73±0.91 5.90±1.47 4.69±1.34 0.12±0.08 0 91.73±1.05 1.17±1.08 7.10±1.37 4.76±1.23 0.18±0.01
Heavy metal contents of the topsoil of Okordia and Oya at various distances are shown in Table 4. It was evident that metal concentrations of the soil decreased significantly (P<0.05) as the distance
increased from the point of the spill; and metal concentrations were consistently and significantly higher (P<0.05) at 0 m.
Table 4. Heavy metal contents (mg kg-1) of topsoil of Okordia and Oya.
Site Distance (m) Concentration (mean±SD)
Pb Cd Cu Zn
Okordia 400 19.7±2.4e 5.1±0.25d 18.7±0.7d 181.3±17.2d
300 23.7±1.1c 5.9±0.35d 21.6±0.8d 185.3 ±15.0d
200 41.0±6.2c 7.0±0.6c 37.3±7.6c 201.0±34.6c
100 88.2±4.2b 9.3± 2.0b 82.0±18.5b 223.7 ±38.1ab
0 128.1±12.5a 10.7±3.12a 116.8±7.8a 285.0±43.8a
Oya 400 19.8±4.9e 5.2±0.2d 19.8±0.8d 184.6 ±16.0d
300 23.3±6.5c 2.2±0.2e 22.6±1.4d 190.7±16.8d
200 34.0±8.2c 6.7±3.1c 32.7±8.8c 221.7±38.4c
100 82.5±23.3b 9.2±2.7b 78.5±15.0b 272.5±77.6b
0 115.0±14.2a 11.0±3.7a 120.8±3.6a 309.3±63.5a
CCME* 70 1.4 63 200
Values with the same superscript along the same column are not statistically different at p ≤ 0.05.
* – CCME limits for metals in agricultural soils.
The concentrations of Pb, Cu and Zn at 0 m doubled the concentrations at 300 m and 400 m, whereas the concentrations of Cd were in several folds
Assessment of Metal Pollution of Soil and Diagnostic Species associated with oil Spills in the Niger-Delta, Nigeria the crude-oil spill. Essoka et al. (2006) reported high
concentrations of Pb and Cd in the soil around a crude-oil polluted site in Warri, Delta state in Nigeria. Comparing the metal loads of the topsoil of the 2 crude-oil impacted areas with the limits stipulated for agricultural soil by the Canadian Council of Minister of Environment (CCME) (2007), it was observed that the concentrations of Pb and Cu in the topsoil exceeded CCME limits up to 100 m distance. Cd concentrations at the 2 sites were also several folds greater than the CCME limit, while Zn concentrations exceeded the CCME limit up to 200 m distance (Table 4).
These elevated values of heavy metals in the soil of Okordia and Oya of Ikarama suggest anthropogenic inputs into the soil due to several crude oil spillages in the area since more than 60 metals have been
established to be in crude oil (Nduka et al., 2012). The fact that there is significant metal pollution in the area becomes ecologically significant due to the agrarian nature of the community and the possibility of toxic metals being transferred up the food chain, thereby portending human health hazards.
The heavy metal loads in the subsoil of Okordia and Oya are shown in Table 5. Generally, the concentrations of Pb, Cd, Cu and Zn in the subsoil were lower than the concentrations in the topsoil. The subsoil of the 2 sites was contaminated with Cd at all locations, while Zn contamination was up to 200 m when compared with the CCME limits. The same pattern of reduction of metal concentrations in the topsoil as the distance increases was also observed for the subsoil.
Table 5. Heavy metal content (mg kg-1) of subsoil of Okordia and Oya.
Site Distance (m) Concentration (mean ± SD)
Pb Cd Cu Zn
Okordia 400 5.1±1.50d 2.5±0.1d 5.0±1.3c 54.6.1±6.8e
300 4.8±0.37d 2.8±0.1d 5.6±0.7c 185.3±4.12d
200 6.3±1.1c 3.0±0.2c 7.3±1.0b 201.0±33.6c
100 8.8±1.7b 3.6±0.1b 8.8±0.8b 223.7±38.1b
0 11.0±1.0a 3.8±0.1a 12.3±0.2a 277.2±43.8a
Oya 400 4.5±0.6d 2.6±0.1e 4.5±0.6d 184.6±16.0d
300 6.8±1.0c 3.0±0.2c 4.7±0.8d 190.6±16.7d
200 8.1±0.5b 2.8±0.5d 5.2±1.5c 221.7±33.7b
100 10.0±0.8a 3.1±0.7b 11.5±1.7b 272.5±77.5a
0 10.8±0.5a 3.5±0.3a 13.6±1.7a 209.2±63.2c
CCME 70 1.4 63 200
Values with the same superscript along the same column are not statistically different at p ≤ 0.05.
3.2 Level of heavy metals in the diagnostic species Andropogon gayanus
The concentrations of metals in Andropogon gayanus (Gamba grass) used as biomonitor in this study are presented in Table 6. Generally, Gambia grass in the control had the lowest values of metals. The highest concentration of metals in the diagnostic
plant was obtained at the point of the spill (0 m) and subsequently decreased significantly (P < 0.05) away from the source point of pollution up to 300 m away. This reported reduction in metal concentration in the diagnostic plant as the distance increased from the source point of pollution has been earlier reported by Bada & Olarinle (2012).
Table 6. Heavy metal content (mg kg-1) of Andropogon gayanus growing at various locations in the study sites.
Concentration (mean ± SD)
Site Distance (m) Pb Cd Cu Zn
Okordia 400 4.5±1.25d 0.25±0.05d 4.1 ±0.05e 8.0±0.12d
300 3.5±0.25e 0.5±0.25c 5.6±0.64d 7.8±0.37d
200 4.2±0.12c 0.75±0.25c 6.5±0.12c 16.1±0.37c
100 4.7±0.12b 1.2±0.07b 7.7±0.02b 27.2±.75b
0 6.3±0.25a 3.5±1.5a 9.0±0.12a 31.7±4.25a
Oya 400 4.6±0.12d 0.25±0.25e 2.5±2.87e 6.5±0.25d
300 4.8±0.12d 0.5±0.05d 5.2±0.05d 7.5±0.03c
200 6.3±0.25b 1.0±0.05c 6.3±0.12c 12.7±0.12b
100 6.0±0.62c 1.2±0.5b 7.7±0.03b 26.0±0.62a
0 8.1±0.62a 2.2±1.50a 9.1±0.11a 26.7±0.25a
Control 2.0±0.50 0.2±1.00 1.6±0.12 4.0±0.12
WHO limit* 2.0 0.2 10 n.a.
Phytotoxic levela 10-20 5-10 15-20 150-200
Values with the same superscript along the same column are statistically the same at p ≤ 0.05; * – WHO Permissible
limit in plants; a – Varun et al. (2010).
Compared with the WHO (1996) permissible limits of metals in plants, Pb and Cd exhibited elevated concentrations beyond the WHO limits at all
soil-plant-human or soil-plant-animal-human, as well as reduction in food quality via phytotoxicity. Meanwhile, the concentrations of all the metals in A. gayanus were below the phytotoxic levels in plants as presented by Varun et al. (2010); and this could explain its continued survival in the presence of the elevated metal concentrations in the soil. There is also the possibility of A. gayanus being excluder of these heavy metals as the concentrations never reached phytotoxic levels despite their abundance in the soil of the area.
Student t test used to compare the metal contents of the topsoil with the grass and the Pearson correlation coefficient are presented in Table 7. The concentrations of heavy metals in the topsoil positively and significantly correlated (p < 0.05) with the concentrations of metals in A. gayanus, except Cd at Oya. This indicates the possibility of A. gayanus taking up the heavy metals solely from the polluted topsoil. Metals in A. gayanus were significantly lower than their corresponding concentrations in the topsoil at p < 0.05 (Table 7). This also evidently proves that high concentrations of metals in the soil do not always
indicate similar high concentrations in plants; the extent of accumulation depends on plant and heavy metal species (Hart et al., 2005).
Table 7. Pearson correlation coefficients (r) and Student t test between metals in topsoil and Andropogon gyanus in the study sites.
Pearson correlation (r)
Student t test
Metal Okordia Oya Okordia Oya
Pb 0.725** 0.844** 4.790** 0.808**
Cd 0.746** 0.360 10.232** 5.600**
Cu 0.908** 0.828** 4.703** 4.566**
Zn 0.798** 0.756** 16.350** 13.078** ** – Significant at p ≤ 0.05.
3.3 Pollution assessment of topsoil and diagnostic species
The pollution assessment of the topsoil using the contamination index (Pi) and the integrated pollution
index (Pc) is presented in Figure 2.
Figure 2. Contamination index (Pi) of (a) Pb, (b) Cd, (c) Cu, (d) Zn and (e) the integrated pollution index (Pc) of the topsoil
Fatoba, Ogunkunle, & Ihaza Low contamination by Pb (1 ≤ Pi ≤ 2) was
observed in the topsoil of Okordia and Oya from 0 m to 200 m distance whereas 300 m and 400 m locations showed no contamination (Pi ≤ 1). High levels of
contamination (Pi > 3) were recorded in the case of Cd
across all locations. The sites showed moderate contamination (2 ≤ Pi ≤ 3) of Cu and Zn at 0 m and
200 m, while low contamination of Zn was observed from 200 m to 400 m in the 2 sites. Pb and Cu indicated no contamination from 200 m to 400 m in the 2 sites. It is noteworthy that the contamination levels in the 2 sites for all the metals showed a reducing trend from the source of pollution, and Cd was consistently at high levels across the locations.
The integrated contamination index (Pc) values
of the locations for the 2 sites are presented in Figure 2f. The same reducing trend of the contamination
index (Pi) observed at the 2 sites was also represented
in the integrated contamination index (Pc). High
integrated (Pc > 21) contamination was observed at
0 m and 100 m at the 2 sites due to their proximity to the source of pollution. Locations at 200 m, 300 m and 400 m in Okordia and locations at 200 m and 400 m in Oya indicated moderate integrated contamination (7 < Pc ≤ 21). The location at 300 m in Oya indicated low
integrated contamination (0 < Pc ≤ 7). It is clear from
the results that all the locations within the 2 sites does not fall within the threshold of no integrated contamination (Pc≤ 0); hence, there is urgent need for
remediation of the soil to avert ecological and human health disaster.
The assessment of the contamination level of the diagnostic species (A. gayanus) used in this study is presented in Figure 3.
Figure 3. The contamination factor (CF) of (a) Pb, (b) Cd, (c) Cu, (d) Zn and (e) the pollution load index (PLI) of A. gayanus in the 2 study sites.
The concentrations of Pb in A. gayanus at 0 m, 100 m and 400 m in Okordia were within the slight
the level of contamination of A. gayanus reached moderate contamination (Figure 3a). The concentrations of Cd in A. gayanus at 0 m and 100 m in Okordia and Oya reached the severe contamination level, while moderate contamination was observed at 200 m and 300 m in the 2 sites (Figure 3b). Cu concentrations in A. gayanus at 0 m, 100 m, 200 m and 300 m indicated moderate contamination, while slight contamination and suspected contamination were exhibited at 400 m in Okordia and Oya, respectively (Figure 3c). Moderate contamination of Zn was recorded in A. gayanus at 0 m, 100 m and 200 m in both Okordia and Oya, while at 300 m and 400 m suspected contamination of A. gayanus was exhibited (Figure 3d). The pollution load of the index of A. gayanus showed that all locations in the 2 sites were severely contaminated with heavy metals (Figure 3e). This portends a grave ecological problem as food crops planted in this agricultural land can possibly accumulate metals to the levels that portend health implications to animals and humans that depend on them for survival.
4 Conclusion
The study has revealed that the several incidences of crude oil spillage have really impacted on the environment of Ikarama with heavy metals. The pollution indices of the soil at 0 m and 100 m were high, while the other distances (200 m, 300 m and 400 m) were of low pollution. The high metal pollution of the soil at all the distances was reflected on the diagnostic plants, as A. gayanus showed the severe metal pollution status due to uptake and eventual accumulation of metals to toxic levels in the biomass. It is obviously imperative that the government improve environmental policies to protect the Niger Delta from a degradation effect of oil exploration. It is also important that the Environmental Guidelines and Standards for the Petroleum Industry in Nigeria (EGASPIN) that stipulated that the spiller should be responsible for the clean-up of the site and restoration to the original state should be adequately empowered and enforced on oil prospecting companies in the Niger Delta to reduce the risk and hazard posed by heavy metals to humans and the ecosystem.
Acknowledgements
The authors express their appreciation to Prof. Oladele of the Department of Plant Biology, University of Ilorin for helping in reviewing the manuscript.
References
Ekundayo, E. O. & Obuekwe, O. (2000). Effects of an oil spill on soil physic-chemical properties of a spill site in a Typic Udipsamment of the Niger Delta basin of Nigeria. Environmental Monitoring and Assessment, 60(2), 235-249.
http://dx.doi.org/10.1023/A:1006230025095.
Bada, B. S. & Olarinle, T. A. (2012). Characteristics of soils and heavy metal content of vegetation in oil spill impacted land in Nigeria. In proceedings of the Annual International Conference on Soils, sediments, Water and Energy vol. 13, article 2.
Bouyoucos, G. J. (1962). Hydrometer method improved for making particle size analysis of soil. Soil Agronomy Journal 54(5), 464-466.
http://dx.doi.org/10.2134/agronj1962.00021962005400 050028x.
Canadian Council of Ministers of the Environment (CCME). (2007). Canadian soil quality guidelines for the protection of environmental and human health: summary tables. Canadian Council of Ministers of the Environment, Winnipeg. Excerpt from Publication No. 1299, ISBN 1-896997-34-1.
Daud, M., Khalid, N., Iqbal, J., & Ahmad, S. (2006). Assessment of atmospheric pollution level using
Asclepias procera leaves as biomonitor. Radiochim Acta
95, 423-431.
D’Souza, R., Varun, M., Pratas, J., & Paul, M. S. (2013). Spatial distribution of heavy metals in soil and flora associated with the glass industry in north central India: implications for phytoremediation. Soil and Sediment: An International Journal 22(1), 1-20.
http://dx.doi.org/10.1080/15320383.2012.697936. Ekundayo, E. O. & Obuekwe, O. (1997). Effects of oil spill
on the physic-chemical properties of a spill site in a paleudult of the Niger Delta basin of Nigeria.
Environmental Monitoring and Assessment, 60, 235-249.
http://dx.doi.org/10.1023/A:1006230025095.
Essoka, P. A., Ubogu, A. E., & Uzu, L. (2006). An overview of oil pollution and heavy metal concentration in Warri area, Nigeria. Management of Environmental Quality: An International Journal, 17(2), 209-215.
http://dx.doi.org/10.1108/14777830610650519. Fernandez, J. & Carballeira, A. (2001). Evaluation of
contamination by different elements in terrestrial mosses. Archives of Environmental Contamination and Toxicology, 40, 461-468.
http://dx.doi.org/10.1007/s002440010198.
Gideon, O. & Josephine, E. (2008). Levels of heavy metals (Pb, Cd, Zn, Mg and Cu) in cassava from Niger Delta of Nigeria as an indication of soil environmental pollution.
Journal of the Chemical Society, 2, 120-143.
Gonzalez-Miqueo, L., Elustondo, D., Lasheras, E., & Santamaria, J. M. (2010). Use of native mosses as biomonitors of heavy metals and nitrogen deposition in the surrounding of two steel works. Chemosphere, 78, 965-971.
http://dx.doi.org/10.1016/j.chemosphere.2009.12.028. Gustav, R. (1974). Hazardous heavy metals (No. 6, p. 14).
WHO International Reference Centre for Waste Disposal (IRCWD News).
Hart, A. D., Oboh, C. A., Barimalaa, I. S., & Sokari, T. G. (2005). Concentrations of trace metals (Pb, Fe, Cu and Zn) in crops harvested in some oil prospecting locations in River state, Nigeria. African Journal of Food Agriculture, Nutrition and Development, 5(2), 34-41. Huang, R. (1987). Environmental pedology. Beijing, China:
Higher Education Press.
Imoobe, T. O. & Iroro, T. (2009). Ecological restoration of oil spill sites in the Niger Delta, Nigeria. Journal of Sustainable Development in Africa, 11(2), 54-65. International Organisation for Standardisation (ISO).
Assessment of Metal Pollution of Soil and Diagnostic Species associated with oil Spills in the Niger-Delta, Nigeria Joner, E. J., Hirmann, D., Szoler, O. H. J., Todorovic, D.,
Leyval, L., & Liobner, A. P. (2004). Priming effects on PAH degradation and ectoxicity during phytoremediation experiment. Environmental Pollution, 128: 429-435.
http://dx.doi.org/10.1016/j.envpol.2003.09.005. Kalavrouziotis, I., Koukoulakis, P., & Kostakioti, E. (2012).
Assessment of metal transfer factor under irrigation with treated municipal wastewater. Agricultural Water Management, 103,114-119.
http://dx.doi.org/10.1016/j.agwat.2011.11.002. Kuruk, P. (2004). Customary Water Laws and Practices in
Nigeria. Retrieved from: http://www.fao.org/fileadmin/ templates/legal/docs/CaseStudy_Nigeria.pdf (Accessed 23 November, 2014)
Ling, W., Shen, Q., Gao, Y., Gu, X., & Yang, Z. (2007). Use of bentonite to control the release of copper from contaminated soils. Australian Journal of Soil Research, 45(8), 618-623.
http://dx.doi.org/10.1071/SR07079.
Ministry of Environment (MOEN) (2008). Oil spill logbook investigated (pp. 10). Ministry of Environment, Bayelsa state, Nigeria.
Nduka, J. K., Obumselu, F. O., & Umedun, N. L. (2012). Crude oil and fractional spillages resulting from exploration and exploitation in Niger-Delta region of Nigeria: A review about the environmental and public health impact. In M. Younes (Ed.) Crude oil exploration in the world.
Ngobiri, C. N., & Ayuk, A. A. (2007). Anunuso II. Differential degradation of hydrocarbon fractions during bioremediation of crude oil polluted sites in Niger Delta area. Journal of Chemical Society of Nigeria, 32, 151-158.
Nolan, K. (2003). Copper Toxicity Syndrome. J. Orthomol. Psychiatry, 12(4), 270-282.
Odu, C. T. I., Nwoboshi, L. C., & Esuruoso, O. F. (1985).
Environmental studies (soils and vegetation) of the Nigerian Agip Oil Company Operation Industry and the Nigerian Environment (pp. 274-283). Lagos, Nigeria: NNPC.
Osuji, L. C., & Nwoye, S. C. (2007). An appraisal of the impact of petroleum hydrocarbons on soil fertility: the Owaza experience. African Journal of Agricultural Research, 2(7), 318-324.
Ozurumba, C. C. (1999). Effects and causes of oil spillage.
National Association of Petroleum Explorationist Bulletin, 14, 31-45.
Sauve, S., McBride, M. B., Norvell, W. A., & Hendershot, W. H. (1997). Copper solubility and speciation of in situ contaminated soils: Effects of copper level, pH and organic matter. Water, Air and Soil Pollution, 100, 133– 149.
http://dx.doi.org/10.1023/A:1018312109677.
State Environmental Protection Administration of China (SETAC). (1995). Chinese Environmental Quality Standard for Soils (GB15618-1995). Beijing, China: author.
Varun, M., D’Souza, V., Pratas, J., & Paul, M. S. (2012). Metal contamination of soils and plants associated with the glass industry in north central India: prospects of phytoremediation. Environmental Science and Pollution Research, 19, 269-281.
http://dx.doi.org/10.1007/s11356-011-0530-4. World Health Organization (WHO). (1996). Permissible
limit of heavy metals in soil and plants. Geneva, Switzerland: author.
Young, R. A. (2005). Toxicity Profiles: Toxicity Summary for Cadmium, Risk Assessment Information System.
RAIS, University of Tennessee Retrieved from: