c
Arsenic Contamination in Indus Alluvial Plain Sediments and Groundwater of
Hyderabad and its Surroundings, Pakistan
Sadaf Naseem
1*, Viqar Husain
1, Shella Bano
11
Department of Geology, University of Karachi, Pakistan
*E-mail: snaseem@uok.edu.pk
Received: 23Februaryr, 2019 Accepted: 27 March, 2019 Abstract: Alluvial aquifers are the main source of groundwater worldwide. In Hyderabad area of Sindh province, aquifers are naturally polluted by arsenic (As) like other alluvial aquifers of the world. Present study was carried out to decipher the mobilization mechanism of arsenic in Holocene aquifers of Indus river basin, where a large population is at the risk of arsenic ingested diseases. Fifty groundwater samples were collected from Hyderabad and its surrounding areas to examine their physical, chemical and microbiological characteristics. In 80% of the groundwater samples, TDS is above the WHO limit. Dominant (40%) hydrofacies in groundwater of study area is NaCl, which shows water-rock interaction and cation exchange mechanism. In order to investigate the source of arsenic, eleven near-surface soil samples were also collected and analyzed for elemental and mineral composition using XRD and AES techniques. Correlation Coefficient, Principal Component Analysis (PCA) and multivariate statistical analyses were used to interpret the data. Arsenic ranges between 10-150 µg/L in groundwater, while in soil samples it ranges from 77 and 137µg/kg. Findings showed that arsenic is mobilized in the alluvial aquifers of Indus river through dissolution/ leaching of iron oxyhydroxides under anoxic conditions. Arsenic is mainly leached from mica and phlogopite under reducing conditions. Meandering of Indus river through different historical time periods is an important factor for the distribution of redox zones created by mirco-biodegradation of organic matter rich with clayey sediments. Irrigation return flow, infiltration of sewerage in groundwater and unlined sanitation are also important anthropogenic factors for creating local anoxic conditions to mobilize arsenic in groundwater.
Keywords:Arsenic, groundwater quality, Indus, Hyderabad, Pakistan.
Introduction
In arid regions of the world, people mostly use groundwater from alluvial aquifers for drinking, irrigation and industrial purpose (Al-Ahmadi, 2013, Chen et al., 2017). Unfortunately, these aquifers are severely affected by geogenic and anthropogenic point and nonpoint sources of arsenic and other pollutants. It is estimated that 1 billion people consume polluted water all over the world (Farnsworth and Hering, 2011). A large number of studies on arsenic in groundwater have been carried out worldwide over the last decades and its elevated concentrations have been identified in 70 countries including South Asia (Mukherjee et al., 2001, Jiang et al., 2010, Bhattacharya et al., 1997, Acharya, 2000). In Pakistan Indus alluvial plain and deltaic plains (~150 km wide) aquifers are excellent groundwater source, which are severely affected by arsenic (Naseem and McArthur, 2018; Rasheed et al., 2017; Shrestha, 2002; Shah et al., 2009; Sarkar and Datta, 2004; Husain, 2009; Nickson, et al 2005; Husain, et al 2012; Khan and Husain, 2019). High concentrations of arsenic in ground water have been reported from various parts of Sindh province including Jamshoro, Matiari, Tando Allayar, Tando Muhammad Khan, Thatta, Hyderabad, Khairpur (Brahman et al., 2016, Arain et al., 2007, 2009, Rasool et al., 2016).
The study area comprised of Hyderabad and its neighboring rural areas (Fig.1). It is situated on the
eastern side of the Indus river, which along with its tributaries are the main source of water but which are highly polluted due to unchecked dumping of liquid and solid wastes (Baig, et al., 2009). Due to low precipitation rate, high evapotranspiration and highly unpredictable flow of water in Indus river, local people depend on groundwater for domestic and agricultural uses. Hyderabad and its surrounding rural areas are mainly plain, highly fertile and dominant crops are sugarcane, wheat, vegetables and mango orchards mainly irrigated by groundwater. Aquifers in the area have variable thickness and hosted in grey silty and sandy friable layers. The depth of the water table varies from 10 to 30 m. Over-extraction of groundwater has resulted in groundwater quality degradation. Due to water table decline, fresh water has been replaced by brackish water (Latif et al., 1999; Samdani, 1995).
Previous studies show that groundwater in Hyderabad region of Sindh province is highly contaminated by arsenic and other contaminants. According to Khan et al. (2008) arsenic in the groundwater of Hyderabad city ranges from 25-1286 µg/L. According to Naseem and McArthur (2018) distribution of arsenic in Indus deltaic alluvial plain is highly heterogeneous caused by microbially-mediated reductive dissolution of sedimentary iron oxyhydroxides in groundwaters. Anoxic conditions in the aquifers are caused by biodegradation of organic matter, silty clay-rich oxbow lakes and meander scars of Indus river (Nickson et al.,
ISSN: 2223-957X
2005; Husain et al., 2012a, b, Naseem and MacArthur, 2018, Naseem et al., 2018).
Present study focuses on multivariate statistical analyses, correlation coefficient and principal component analysis (PCA) to investigate hydrogeochemical processes, which would affect groundwater quality, distribution and relationship between arsenic and nature of aquifers. Therefore, that present study will help to elucidate water-rock interaction, groundwater mineralization process, distribution, occurrence and mobilization of arsenic in shallow alluvial aquifers of Hyderabad.
Fig. 1 Map of study area, showing groundwater samples collection points with arsenic polluted and As free wells.
Geology and Geomorphology of the Area
Hyderabad is the second largest city of Sindh province approximately 150 km away from Karachi and Arabian sea (Fig. 1). It lies at 25.367°N and 68.367°E with an average elevation of 13 m (43 ft). Phuleli canal is main canal in the area which originates from the left bank of Kotri barrage. It runs through the periphery of Hyderabad city and provides water for agricultural, industrial and domestic purposes to Hyderabad, Tando Muhammad Khan and Badin districts. This canal is non-perennial, but the water is released for domestic purpose in dry seasons (Kazmi and Jan, 1997; Giosan et al, 2006).
Hyderabad is located in the southern side of subdued relief alluvial and deltaic plain of Indus river. Indus Alluvial plain extends from the lower Punjab to the Arabian sea and filled with post-glacial sediments in Pleistocene incised-valley system (Kazmi, 1984; Giosan et al., 2006a Clift and Giosan, 2013; Kureshy, 1977; Kadri, 1995; Haq, 1999). Hyderabad lies at the starting point of Indus delta which extends upto Thatta district at the mouth of Arabian sea. Changing courses of the Indus river from east to west formed the present Table 1. Physical and microbiological characteristics of groundwater.
S.No. Sample ID.
Coordinates
Depth
m Color odour
Turb. NTU pH
P.Colif. /100 ml
F.Colif. MPN/100
ml
E-coli Lat. N Long. E
1 HDR-2 251851 682527 24.3 UO UO 4.8 7.2 Nil Nil -Ve
2 HDR-3 251846 682433 24.3 UO UO 8.9 7.4 26 12 -Ve
3 HDR-4 251715 682513 13.7 UO UO 4.6 7.4 17 9 -Ve
4 HDR-5 251707 682514 13.7 UO UO 4 7.5 14 11 -Ve
5 HDR-6 251438 682641 26 UO UO 3.2 7.8 7 4 -Ve
6 HDR-10 251446 682940 15.2 yellowish unpleasant 10.6 7.1 14 7 -Ve
7 HDR-12 251451 683032 16.7 yellowish UO 14 6.9 17 9 -Ve
8 H1 244647 675648 4.5 UO UO 4.8 8.2 33 17 -Ve
9 H2 245844 680751 18.2 yellowish UO 48 7.7 17 9 -Ve
10 H3 250207 681341 12.1 yellowish UO 8.9 7.4 12 9 -Ve
11 H4 251719 681231 24.3 yellowish UO 7.6 7.6 7 6 +Ve
12 H5 251442 682640 27.4 UO unpleasant 8.5 7.6 17 9 -Ve
13 H6 251316 682804 24.3 UO unpleasant 4.8 7.4 12 9 -Ve
14 H7 251316 682818 12.1 UO UO 7.9 7.7 21 9 -Ve
15 H8 251222 682712 13.7 UO unpleasant 8.7 7.2 7 6 -Ve
16 H9 251222 682712 30.4 UO UO 4.3 7.2 Nil Nil -Ve
17 H10 251243 681216 16.7 UO UO 3.9 7.5 9 4 -Ve
18 H11 251350 682739 13.7 UO UO 4.6 7.6 12 9 -Ve
19 H12 252543 682107 16.7 UO UO 4.6 8 11 7 -Ve
20 H13 252832 682356 19.8 UO UO 18 7 Nil Nil -Ve
21 H14 253011 682532 21.3 UO unpleasant 14 7.3 9 4 -Ve
22 H15 253014 682529 21.3 UO UO 6.7 7.3 Nil Nil -Ve
23 H16 253010 682525 15.2 UO UO 3.2 7.4 7 4 -Ve
24 H17 253013 682526 12.1 UO unpleasant 4.6 7.3 21 14 -Ve
25 H18 253143 682601 15.2 UO UO 4.1 7.4 17 9 -Ve
26 H19 253307 682608 21.3 UO UO 5.8 7.3 Nil Nil -Ve
27 H20 253547 682622 9.1 yellowish UO 10.6 6.9 26 14 -Ve
28 H21 253528 682631 21.3 UO UO 4.5 7.2 7 4 -Ve
29 H22 253558 682718 21.3 UO UO 27 6.9 9 4 -Ve
30 H23 253550 682739 21.3 UO UO 3.6 7.3 21 14 -Ve
31 H24 253524 682836 15.2 UO UO 3.8 7.1 12 9 -Ve
32 H25 253702 682821 18.2 UO UO 4.2 7.2 7 4 -Ve
33 H26 253747 682925 13.7 UO UO 6.8 7.6 21 14 -Ve
34 H27 253903 682953 21.3 UO UO 19 7.4 Nil Nil -Ve
35 H28 253931 682956 30.5 UO UO 22 7.3 Nil Nil -Ve
36 H29 253821 682940 30.5 UO UO 4.3 7.1 Nil Nil -Ve
37 H30 253137 682601 18.2 UO UO 4.6 6.9 9 4 -Ve
38 H31 252922 682518 16.7 UO UO 5.4 6.9 11 7 -Ve
39 H32 252346 682435 16.7 UO UO 3.8 6.8 7 4 -Ve
40 H33 252354 682451 13.7 UO UO 23 7.2 26 14 -Ve
41 H34 252437 682803 21.3 UO UO 6.3 6.9 7 6 -Ve
42 H35 252520 683108 21.3 yellowish unpleasant 17 7 Nil Nil -Ve
43 H36 252639 683500 13.7 yellowish unpleasant 7.3 7.2 21 14 -Ve
44 H37 252643 683606 24.3 UO UO 4.7 7.3 Nil Nil -Ve
45 H38 252739 684159 21.3 UO unpleasant 6.6 7 17 9 -Ve
46 H39 252805 684334 13.7 UO UO 4.3 7 13 7 -Ve
47 H40 252834 684352 55 UO UO 7.9 7.3 Nil Nil -Ve
48 H41 252700 683726 15.2 UO UO 4.4 7.8 9 4 -Ve
49 H42 252632 683453 70 UO UO 10.5 7.2 Nil Nil -Ve
delta (Wilhelmy, 1967; Holmes, 1968; Rubab et al., 2014). It constitutes a stream bed, superficial alluvium and extinct stream deposits. Most part of the study area consists of flood plain deposits of the extinct streams which consists of greenish grey to grey silt and clay with subordinate fine sand. The deposits are poorly sorted with fine to medium grained sand, silt and minute clay (Khan, 2014; Holmes, 1968). The Holocene alluvium of Indus constitutes organic matter bearing greyish brown sandy clay and grey sand brought by Indus river (Kidwai, 1963). In the southern part of Hyderabad, limestone hills (Ganjo Takkar) are the only elevated landforms (Ansari and Vink, 2007; Kazmi and Jan, 1997). The exposed cream to grey colored limestone in the study area with subordinate marl, calcareous shale, sandstone and lateritic clay belong to Laki Formation of Eocene age (Shah, 1977). However, another exposed white to grey colored limestone is mainly fossiliferous interbedded with
subordinate shale and marl belonging to Kirthar Formation of Oligocene age (HSC, 1960).
Materials and Methods
Water Sampling and Analysis
Fifty groundwater samples were collected from Hyderabad city and its surrounding villages (Fig. 1). These water samples were analyzed for various microbiological and physicochemical parameters (Table 1, 2). The pH and temperature of the groundwater were measured in the field using an Adwa (AD111) Multimeter, while, Electrical conductivity was measured with Adwa ad330 conductivity meter. Well depths were obtained from well owners, which ranges from 4.5 to 70 meters. The well locations were marked with a handheld (Garmin eTrex 20x) Global Positioning System (GPS). Samples were collected in plastic bottles. Arsenic was measured in the field using Table 2. Chemical analysis of groundwater samples.
S.N. Sample ID
Ca mg/l
Mg mg/l
Na mg/l
K mg/l
HCO3 mg/l
Cl mg/l
SO4 mg/l
Nitra. mg/l
Fe mg/l
Fl
mg/l Hard. Alkal. As Cl/HCO3 Na/Cl SI TDS mg/l
EC µ-S/cm
Water Type 1 HDR-2 120 58 106 8 340 223 108 0.3 0.03 0.37 540 6.8 0 0.68 0.47 0.36 988 1543 Ca-Cl 2 HDR-3 144 24 175 9 270 362 76 0.51 0.02 0.45 460 5.4 0 1.34 0.48 0.56 1107 1726 Na-Cl 3 HDR-4 140 29 137 5 280 286 88 1.2 0.03 0.58 470 5.6 0 1.02 0.47 0.57 1014 1584 Ca-Cl 4 HDR-5 168 85 219 6 300 472 260 0.84 0.04 1.1 770 6 0 1.57 0.46 0.76 1594 2490 Na-Cl 5 HDR-6 84 65 121 5 210 316 76 0.5 0.02 0.61 480 4.2 60 1.50 0.38 0.61 943 1473 Mg-CL 6 HDR10 160 112 447 6 540 674 324 0.5 3.44 0.99 860 10.8 0 1.24 0.66 0.48 493 770 Na-Cl 7 HDR-12 260 102 473 12 530 791 425 1.2 7.8 1 1070 10.6 0 1.49 0.59 0.43 2374 3710 Na-Cl 8 H1 88 46 442 8 290 691 115 0.411 0.04 0.79 410 5.8 5 2.38 0.07 1.15 2700 4220 Na-Cl 9 H2 76 39 104 3 230 152 126 0.614 0.01 0.89 350 4.6 5 2.66 0.68 0.56 1779 2780 Na-Cl 10 H3 220 49 210 9 250 167 700 0.33 0.01 1.61 750 5 5 0.66 0.25 0.64 744 1162 Ca-SO4 11 H4 84 61 392 11 360 574 136 1.489 0.01 1.53 460 7.2 0 1.59 0.68 0.62 1568 2450 Na-Cl 12 H5 68 24 38 4 220 78 22 0.552 0.06 0.59 270 4.4 10 0.35 0.48 0.44 1702 2660 Ca-HCO3
13 H6 40 27 33 5 200 53 12 0.491 0.5 0.27 210 4 100 0.26 0.62 -0.21 459 717 Mg-HCO3 14 H7 64 19 71 4 160 106 78 1.047 0.05 0.54 240 3.2 5 0.66 1.66 0.37 370 578 Ca-Cl 15 H8 64 78 343 4 340 427 280 0.499 0.09 1.1 480 6.8 5 1.25 0.80 0.047 508 794 Na-Cl 16 H9 96 83 452 5 340 652 314 0.299 0.01 0.94 580 6.8 0 1.91 0.69 0.19 1587 2480 Na-Cl 17 H10 56 29 59 4 220 92 44 0.315 0.11 1.02 260 4.4 5 0.41 0.64 0.24 2048 3200 Ca-HCO3 18 H11 60 24 47 3 210 64 54 0.295 0.02 0.63 250 4.2 5 0.30 0.73 0.36 509 796 Ca-HCO3 19 H12 40 17 48 4 150 71 31 0.407 0.07 0.39 170 3 5 0.47 0.67 0.477 459 717 Na-HCO3 20 H13 140 126 446 10 460 617 483 2.563 0.12 1.22 870 9.2 60 1.34 0.72 0.232 364 568 Na-Cl 21 H14 76 29 92 6 270 107 86 0.664 0.55 0.55 310 5.4 10 0.39 0.85 0.223 2381 3720 Na-HCO3 22 H15 68 41 55 6 250 99 66 0.491 0.03 0.03 340 5 5 0.39 0.55 0.148 666 1040 Ca-HCO3
23 H16 44 29 39 3 190 67 32 0.376 0.09 0.09 230 3.8 20 0.35 0.58 -0.015 589 921 Mg-HCO3 24 H17 40 19 29 4 160 54 17 0.372 0.09 0.09 180 3.2 10 0.33 0.53 -0.219 410 641 Ca-HCO3 25 H18 44 27 111 4 200 128 84 0.269 0.02 0.02 220 4 5 0.64 0.86 -0.023 327 511 Na-Cl 26 H19 76 46 127 4 300 177 104 0.411 0.03 0.03 380 6 60 0.59 0.71 0.245 600 938 Na-Cl 27 H20 236 112 217 7 260 720 248 0.529 0.01 0.01 1050 5.2 5 1.37 0.30 0.111 845 1320 Ca-Cl 28 H21 120 58 670 7 340 876 412 0.637 0.06 0.06 540 6.8 40 1.9 0.76 0.262 1971 3080 Na-Cl 29 H22 280 87 510 11 300 936 522 0.902 0.2 0.2 1060 6 10 1.6 0.54 0.262 2592 4050 Na-Cl 30 H23 68 36 61 3 260 89 61 0.506 0.03 0.03 320 5.2 5 0.27 0.68 0.169 2803 4380 Ca-HCO3 31 H24 84 36 71 8 300 96 84 0.388 0.03 0.03 360 6 5 0.25 0.73 0.086 579 905 Ca-HCO3 32 H25 76 39 66 5 270 89 81 0.533 0.09 0.09 350 5.4 30 0.25 0.74 0.114 669 1045 Ca-HCO3 33 H26 44 22 28 5 160 54 28 0.388 0.1 0.1 200 3.2 5 0.26 0.51 0.135 643 1005 Ca-HCO3 34 H27 92 44 49 6 240 131 98 0.556 0.13 0.13 410 4.8 150 0.39 0.37 0.353 340 532 Ca-Cl 35 H28 40 22 29 4 160 54 19 0.457 0.31 0.31 210 3.2 10 0.27 0.53 -0.225 675 1055 Ca-HCO3 36 H29 136 29 123 7 350 178 122 0.905 0.53 0.53 460 7 10 0.36 0.69 0.329 333 521 Ca-Cl 37 H30 88 37 147 4 370 156 102 0.38 0.06 0.06 370 7.4 0 0.42 0.94 -0.059 943 1474 Na-HCO3 38 H31 180 58 290 10 330 433 370 0.472 0.03 0.74 690 6.6 0 1.31 0.67 0.118 896 1400 Na-Cl 39 H32 480 136 620 14 350 1490 653 0.487 0.02 1.06 1760 7 5 4.25 0.41 0.331 1715 2680 Na-Cl 40 H33 180 102 542 6 320 745 640 0.867 0.06 0.96 870 6.4 0 2.32 0.72 0.395 4026 6290 Na-Cl 41 H34 68 78 217 6 440 217 205 0.43 0.7 0.57 490 8.8 0 0.49 1 -0.13 2650 4140 Na-Cl 42 H35 260 95 370 7 340 759 420 0.71 0.06 0.92 1040 6.8 0 0.23 0.48 0.366 1255 1961 Na-Cl 43 H36 60 29 60 4 230 78 50 0.418 0.03 0.41 270 4.6 5 0.33 0.76 -0.33 2394 3740 Ca-HCO3 44 H37 52 24 43 3 180 64 45 0.422 0.05 0.53 230 3.6 0 0.35 0.63 -.074 518 810 Ca-HCO3 45 H38 178 106 168 7 340 379 364 0.526 0.02 0.81 880 6.8 0 1.11 0.44 0.245 414 647 Ca-Cl 46 H39 92 49 148 7 320 167 190 0.771 0.02 0.65 430 6.4 0 0.52 0.88 0 1613 2520 Na-Cl 47 H40 48 46 140 4 290 138 130 5.414 0.06 0.85 310 5.8 30 0.47 1.01 0.040 982 1534 Na-HCO3
48 H41 28 17 24 3 110 39 29 0.652 0.02 0.51 140 2.2 5 0.35 0.61 0.009 804 1256 Mg-HCO3
a Merck test kit (0.01–0.5 mg/L) 1.17926.0001, Germany (Table 3).
For microbiological analysis, samples were collected in plastic bottles of 200ml capacity and were kept in the dark at 4°C in an ice box for analysis within 24 hours of sampling. Microbiological analysis for Total Coliforms, Fecal Coliforms and Escherichia Coli was done by Multiple-Tube Fermentation technique (MPN) (407D, Standard method, 1971). Inoculated tubes were incubated at 35 ± 0.5oC and each tube was tested for
presence of gas and acid after 24 hours of incubation and within 48±2 hours. Tubes showing acid and gas were marked as presumptive positive. Test tubes of BGLB of 10% of the positive were further shifted into the EC broth and incubated at 44 .5 ±0.2oC for 24
hours. Positive test tubes with acid and gas production were noted. The presumptive and fecal coliforms per 100 ml of sample were calculated from the MPN standard table.
Soil Sample Collection and Analysis
Eleven topsoil samples were collected from 10 cm below the surface with the help of hand shovel. Soil color, grain size, shape and texture were also recorded (Table 4). The soil sample was dried in an oven at 110°C for 24 hours. After drying the sample was ground and sieved through a mesh -200 before digestion. For digestion 1 gm of soil sample was weighed into a 250ml beaker to which 7 ml concentrated hydrochloric acid and 3 ml nitric acid were added. The suspension was kept overnight in the beaker and it was refluxed for 2 hours, followed by dilution with deionized water to 50 ml, stirring for 5 minutes and filtering (0.80µm) after cooling. The filtrate was stored in a plastic bottle and was examined for total (aqua-regia extractable) concentration of arsenic, iron and manganese using Perkin-Elmer A Analyst 600 Graphite Furnace Atomic Absorption Spectrophotometer.
The XRD analysis of soil samples were conducted in Geoscience Laboratories, Islamabad. For XRD soil samples were dried in an oven at 110°C for 24 hours. Later, dried samples were pulverized and passed through mesh -200. By scanning the sample through a range of 2θ angles, all possible diffraction directions of the lattice were attained due to random orientation of the powdered material. The d-spacing of each peak is then obtained by solution of the Bragg equation for the appropriate value of λ.
Results and Discussion
Physicochemical Characteristics
Physico-chemical characteristics of groundwater were evaluated in order to check groundwater quality (Table 1, 2). About 50% of total groundwater samples were found to have turbidity higher (5.4-48 NTU) than the WHO permissible limit for drinking water. The pH of
the groundwater ranges from 6.8 to 8.2. Groundwater geochemistry is characterized by high concentrations of bicarbonate, chloride, sulfate and sodium over other major ions and 80% were found with TDS above permissible limit of WHO (500 mg/L) in the area. The SO4 content in groundwater of Hyderabad district
shows great variability (12-700 mg/L). About half of groundwater samples contain SO4 above the
permissible limit (250 mg/L) for drinking water. Fifteen of the total 50 groundwater samples contain sodium above the WHO permissible limit of 200 mg/L for drinking water.
Multivariate Statistical Analysis
Electrical conductivity shows a strong correlation with calcium and negative correlation (-0.64) with pH suggests water-rock interaction phenomenon is dominant in the area (Table 5). In Hyderabad district chloride is dominant ion, which shows strong positive correlation with most of the major ions of sodium (r = 0.93), calcium (r = 0.84), sulfate (r = 0.78), potassium (r = 0.73) and magnesium (0.83). The plotting of Na versus Cl shows that most of the water samples fall away from 1:1 line. Na/Cl ratio, which is less than unit in most of the samples. It reflects the contribution of cation exchange phenomenon and consumption of sodium for the formation of clay minerals (Fig. 2). Low levels of Ca in water are caused by its tendency to be fixed by clay minerals and to participate in the formation of secondary minerals (Zhu, et al., 2008). This is also indicated by saturation index as most of the groundwater samples are slightly supersaturated with respect to calcite indicating the consumption of calcium for the formation of secondary minerals (Table 2). Calcium shows a significant correlation (0.67) with sodium (Table 5) which also confirms cation exchange reaction (Edet and Okereke, 2001).
Fig. 2 Relationship between sodium and chloride in groundwater samples of Hyderabad district.
Acharrya and Shah, 2007). High concentrations (160-540 mg/L) of bicarbonate in the study area indicate the weathering of carbonate minerals during recharge and to some extent in the aquifer matrix along with degradation of organic matter under local reducing conditions (Rowland et al., 2007; Mukherjee et al., 2009; Shamsudduha et al, 2008; Lang et al., 2006).
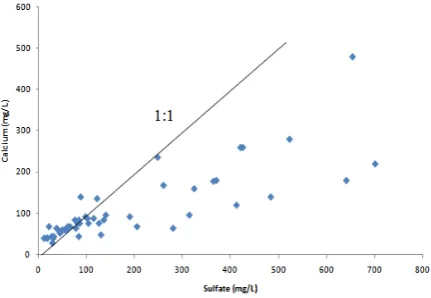
Fig. 3 Relationship between sulfate and calcium in groundwater samples of Hyderabad district.
Principal Component Analysis
PCA is used to establish a series of factorial variables that summarize all the hydrochemical information based on multivariate and complex information (Sanchez-Martozet et al., 2001). It expresses the relation or association between different chemical components in the groundwater (Mukherje-Goswami et al., 2008). Groundwater samples from different areas of Hyderabad were examined by PCA analysis which revealed 82.58% of total variance (Table 6). PCA analysis shows four principal components of which, PC1 and PC2 account for 58.76 and 9.45% of the total variance respectively. Most of the analyzed samples in the study area have strong loading (>0.78) of these two components. Further, strong positive loading (>0.78) of cations (Ca, Na, K, Mg) and anions (HCO3, Cl, SO4) associated TDS, alkalinity and
hardness represent the main dissolved load of groundwater, which explains intense water-sediment interaction in a longer time. Strongly positive correlation of EC with HCO3 and sulfate also indicates
the phenomenon of mineral dissolution (Table 5).
The abundance of carbonate rocks in the study area, rapid weathering and erosion of these rocks may add significant amounts of Ca and Mg to the groundwater. In the study area, which is a part of Indus deltaic plain, influence of tectonic forces and Holocene eustatic changes have resulted in high sedimentation rate and rapid burial of large quantities of carbonates (Ansari and Vink 2007; Clift et al., 2008; Lee et al 2003; Clift and Blusztajn, 2005). Furthermore, dissolution of halite may be responsible for high sodium and chloride contents in the groundwater. The study area comprises of Holocene alluvial aquifers dominated by silt with variable quantities of sand, clay and micas (Kazmi, 1984; Khan et al., 1993). Furthermore, dissolution of
gypsum from gypsiferous shale, belonging to Laki Formation of Eocene age is the source of SO4 and
additional Ca contents in groundwater of this area. Groundwater is highly saline, as most parts of this area are situated at offshoots of the Kirthar Range (Western High Lands) comprising of Laki, Tiyon, Kirthar and Nari formations of Eocene to Oligocene age. Dissolution of these rocks and its seepage in shallow alluvial aquifers also led to an increase in total dissolved solids in groundwater of the area (Kahlown et al, 2004; Malik, 2000). Indus River changed its course from east to west of Hyderabad and resulted in its present course within the delta (Wilhelmy, 1967). Due to the change in course, Indus River abandoned about 100 miles of its old channel in Matiari area (Holmes, 1968; Kazmi and Jan, 1997). Aquifers are located in the older river courses of Indus river, that must have left huge quantities of water, slowly turned saline, as the brackish water of the surrounding area encroached up to it (Panhwar, 1969). Over-extraction of groundwater causes the underlying highly saline water to mix with overlying freshwater and use of this poor quality water results in soil salinity problems in the area (Qureshi et al., 2008).
The NO3 content in groundwater of Hyderabad district
varies from 0.3-5.41mg/L (Table 2). Nitrate shows the
absence of a significant correlation with all major ions
in the study area. This indicates that agricultural
pollution is unlikely in the area as in all groundwater samples the concentration of nitrate is quite low (0.3 to 5.4 mg/L). Lower concentrations of sulfate in few groundwater samples in the area may be due to the reduction of sulfate to sulfide by sulfate-reducing bacteria in the presence of organic matter. It is due to organic matter content in the groundwater, as shallow wells are more subjected to contamination, particularly in areas with porous and well-drained soils. Unlined sanitation and pit toilets are also common in the area which caused the mixing of anthropogenic organic waste with the groundwater resulting in microbial contamination of groundwater.
Hydrochemical Facies
The hydrofacies reflects the effects of chemical processes occurring between the minerals within the lithologic framework and the groundwater (Pulido-Leboeuf, 2004). According to Piper diagram, the dominant water type is NaCl (40%) in the study area (Fig. 4). Which generally indicates the influence of dissolution of aquifer material. In the study area, the occurrence of Na-Cl hydrofacies is an indication of input of terrestrial salts through the process of weathering and dissolution of rocks exposed in the area. The second predominant hydrofacies in the area is CaHCO3 (fresh water) type, which occurs in 26% of
the aquifers indicating highly recharged aquifer, through meteoric water. A large proportion of Ca-HCO3 facies is found near the Indus river, where its
are Ca-Cl (16%), MgHCO3 (8%) and NaHCO3, (8%).
It indicates strong water-aquifer interaction related to
direct cation exchange between groundwater and the clay fraction of the aquifer material.
Fig. 4 Piper diagram showing hydrochemical characteristics of groundwater, Hyderabad district.
Due to the cation exchange, calcium which is absorbed on the surface of the clays is released in the saline water and in return sodium, which is a part of saline water is taken up by the clay of aquifer materials. Moreover, flushing of the freshwater aquifer by the saline water will thus result in uptake of Ca2+ with
concomitant release of Na+. This is reflected in an
increase in the salinity and formation of the NaHCO3
water type in the study area. Similarly, Mg-HCO3
water type also indicates alteration of Ca-HCO3
hydrofacies through the process of cation exchange in which magnesium is found on the surfaces of clays in the aquifer, where it exchanges with Ca and results in
the creation of Mg-HCO3 hydrofacies (Kelly, 1997).
Arsenic Distribution in Soil and Groundwater In the groundwaters of Hyderabad As ranges between 10-150 µg/L. And most of the groundwater samples found were above the 10 µg/L permissible limit (WHO, 2011) for drinking water (Table 2). Moreover, As in soil samples ranges from 77 and 137 µg/kg while, Fe and Mn ranged between 82-121 mg/kg and 3.6 to 5.0 mg/kg respectively (Table 4). Organic matter in soil samples ranges from 1.26% to 7.20 %. In the Hyderabad district, most of the near-surface sediments are silty-clay to clayey in nature; their color ranges from yellowish brown to grey. Furthermore, the XRD analyses of selected soil sediment samples show that the sediments are dominated by quartz, calcite, dolomite, albite and phyllosilicates, phlogopite and muscovite. These minerals could be the possible source of arsenic in aquifers of the study area (Table 4). According to Chakraborty et al. (2007), silt-sized micas provide an effective adsorption site for arsenate and arsenite. In Hyderabad, high concentrations of As in groundwater occur due to the desorption/dissolution of As from phlogopite and mica under reducing
conditions. Moreover, the presence of high contents of As (77-137 µg/kg) and Fe (82-121 mg/kg) in sediments of study area suggests that desorption process may occur, indicating that high arsenic in groundwater was released from Fe oxyhydroxides (Shamsudduha et al., 2008). As soil in the area is mostly clayey in nature, arsenic is concentrated in clay phases due to its adsorption onto Fe-oxyhydroxide. Consequently, the dissolution of Fe oxyhydroxide contributed to the leaching of arsenic in aquifers. According to Smedley, and Kinniburgh (2002) most of the areas with arsenic contaminated aquifers in the world are of Quaternary age. Aquifers in the study area also lie in Holocene fine-grained sediments. These late Holocene sediments (7000-1000 years B.P) were derived from Himalayan rocks and have been deposited primarily by the Indus river (Clift et al., 2008). Arsenic hot spots in the area include those through which Indus River passed during Holocene period depositing younger alluvium constituting inter-layered deposits of very fine sand, silt and clay (Husain, 2009; Husain, 2012; Kazmi and Jan, 1997).
Table 3. Water quality parameters and methods used for analysis. S.No Parameters Test Method
1. Alkalinity (m.mol/l as CaCO3)
2320, Standard method (1992)
2. Arsenic (mg/l) Merck Test Kit (0.01–0.5 mg/L) 1.17926.0001, Germany 3. Bicarbonate 2320, Standard method (1992)
4. Calcium (mg/l) 3500-Ca-D, Standard Method (1992)
5. Chloride (mg/l) Titration (Silver Nitrate), Standard Method (1992)
6. Electrical
Conductivity (mS/cm) Adwa ad330 conductivity meter
07. Fluoride (mg/l) 8029, SPADNS Method (Hach) by Spectrophotometer
08. Hardness (mg/l) EDTA Titration, Standard Method (1992)
09. Iron (mg/l) TPTZ Method (Hach-8112) by Spectrophotometer
10. Magnesium (mg/l) 2340-C, Standard Method (1992)
10. Nitrate (mg/l) Cd. Reduction (Hach-8171) by Spectrophotometer
12. pH at 25oC Adwa (AD111) Multimeter 13. Potassium (mg/l) Flame photometer PFP7, UK 14. Sodium (mg/l) Flame photometer PFP7, UK
15. Sulfate (mg/l) Turbiditimetric Method ,UV-VIS Spectrophotometer (Analytik Jena)
16. Total Coliforms
PN/100ml) 407D, Standard method (1971) 17. TDS (mg/l) 2540C, Standard method (1992)
18. Turbidity (NTU) Turbidity Meter, Lamotte, Model 2008, USA
Table 4. Mineralogical and trace elemens data of sediments collected near well sites of Hyderabad.
S.No. Mineral Sediment Characteristics pH
Mn mg/kg
Fe mg/kg
As µg/kg
Organic matter %
3 Quartz, Calcite, Albite
Medium brown, sandy to Clayey
in nature
7.8 4.1 120 100 2.29
6 Quartz, Dolomite, Phlogopite, Albite
Light brown,
Sandy – Clay 7.4 3.6 94.3 76.9 1.35
Clayey
7 Quartz, Albite, Muscovite
Dark brown to grayish brown,
Clay
8.1 5.0 121.2 99.8 2.7
15 Quartz, Albite, Dolomite, Calcite
Dark grayish brown ,Sandy to Clayey
7.8 3.9 102.5 137.5 2.66
16 Quartz, Dolomite, Sylvite
Brown Sandy
to Clayey 8.4 3.78 91.8 115.5 3.44
17
Quartz, Dolomite, Albite, Mg-Calcite,
Phlogopite
Medium brown
sandy clay 7.4 3.6 104.9 77.56 7.20
22 Quartz, Dolomite, Phlogopite
Medium brown, Sandy to
Clayey
7.7 4.17 103.2 117.1 1.73
27 Quartz, Calcite, Anorthite
Light brown,
Silty Clay 7.9 4.1 104.4 98.3 2.35
29 Quartz, Calcite, Albite
Light brown,
Silty Clay 8.0 4.3 82.4 117.9 2.84
43 Quartz, Dolomite, Albite
Medium brown, Clayey Shiny mica particles
8.2 3.6 94.14 132 1.26
Distribution of arsenic in the study area is heterogeneous may be related to the presence of a small scale redox zones in the aquifers controlled by quality, amount and distribution of natural organic matter within the aquifer (Wagener et al., 2005, Harvey, et al., 2002). These reducing zones are associated with oxbow lakes, meander scars and abandoned channels of Indus river, where degradation of organic matter creates an anoxic environment and results in the mobilization of As in the groundwater.
After the formation of a new river course due to shifting of the Indus river (Holmes, 1968), the old channels turned into oxbow lakes in which high amount of fine-grained sediments and organic matter degradation created reducing environment (Halim et al., 2009). These redox conditions and processes are key factors in the variation of As concentrations in groundwater. In, addition, arsenic distribution is also controlled by agricultural activities, as it is shown by high concentration of arsenic in the soil, mostly collected from agricultural fields in the study area. Use of arsenic contaminated groundwater and subsequently its accumulation on the sediments leads to the formation of an iron-rich subsurface horizon, which favors the accumulation of arsenic (Zang and Gong 2003). Extensive groundwater irrigation accelerates the flow of groundwater that brought dissolved degraded organic matter in contact with arsenic-bearing sediments, enhancing reduction process and triggering the release of arsenic into groundwater (Acharrya et al., 2000). Throughout the study area of Hyderabad, the concentration of iron in groundwater is low ranging between 0.01 to 7.8 mg/L. Moreover, Fe concentrations do not correlate well with As throughout the area. Notably poor correlations between Fe and As may reflect a re-oxidation of Fe (II) due to subsurface distribution of redox potential, which mainly depends upon local lithological and biogeochemical conditions and distribution of redox zones (Yan et al., 2000).
In Hyderabad groundwater, the sulfate concentrations are highly variable and range from 12 to 700 mg/L. Extreme heterogeneity of sulfate indicates supply of sulfate through gypsum dissolution by freshwater
recharge. While low concentrations of sulfate indicate decreased sulfate content due to micro biodegradation of organic matter which creates reducing conditions in the subsurface (Von Bromssen et al., 2007, Anawar et al., 2003). Furthermore, reducing conditions are also indicated by low nitrate concentration in the groundwater of the study area. This can be attributed to denitrification through nitrogen reducing bacteria causing redox conditions leading to the release of As into aquifers. Moreover, due to irrigation return flow, nitrate penetrates in the deeper parts of the aquifer along with organic matter, where it plays an important
role for mobilization of arsenic in the groundwater
(Acharyya et al., 2000). The study area is highly affected by bacteriological contamination, where 75% (n=50) wells show the presence of presumptive coliforms and fecal coliforms and E-coli. In Hyderabad city sewerage, industrial and domestic wastes are directly dumped in the Indus river and its distributary canals (Bano, 2003, Husain, 2009). Moreover, most of the handpump wells, installed on the canal banks at very shallow depths (<30 m) are severely contaminated by arsenic. The unlined sanitation in the area and presence of microbial organisms also contribute to microbial degradation of organic matter that enhances the reduction of iron oxy-hydroxides leading to release of arsenic to groundwater (Mc Arthur et al., 2001).
Acknowledgement
I am thankful to the Chairman, Department of Geology, University of Karachi for providing facilities to complete my research work. I am also grateful to my colleagues for their valuable suggestions and important discussions for the improvement of the manuscript.
Conclusion
• Aquifers in the areas are shallow, hosted in porous sediments and affected by surface and groundwater mixing, waste dumping and seepage from unlined canals as indicated by microbiological contamination in 75% water samples.
• Multivariate statistical analysis and PCA show that aquifers in Hyderabad show high salinity due to water-rock interaction, cation exchange, mineral dissolution and semi-arid climate.
• Dominant (40%) hydrofacies in the area is Na-Cl type, indicating halite dissolution, while the rest of the hydrofacies are fresh to mixed type.
• The soil in the area is fine grained silty clayey in nature and contains an appreciable amount of quartz, calcite, dolomite, albite, phlogopite, muscovite and desorption/dissolution of As from phlogopite and mica under reducing conditions plays an important role for arsenic mobilization.
• In Hyderabad districts, the arsenic mobilization seems to be controlled by geogenic factors particularly leaching of mica and Fe oxyhydroxides bearing sediments brought from the western Himalayas during the heavy monsoon of Holocene period. In addition, anthropogenic factors like poor drainage, waste dumps, unlined sanitation and flood irrigated crops promote the creation of local reducing zones by biodegradation of organic matter.
• High arsenic wells in the area are also associated with organic matter rich abandoned channels and oxbow lakes formed by Indus river during different historical periods during Holocene.
References
Acharyya, S. K., Lahiri, S., Raymahashay, B.C., Bhowmik, A. (2000). Arsenic toxicity of groundwater of the Bengal basin in India and Bangladesh: the role of Quaternary stratigraphy and Holocene sea-level fluctuation. Environ. Geol.,39, 1127–1137.
Acharyya, S. K., Shah, B. A. (2007). Groundwater arsenic contamination affecting different geologic domains in India-a review: influence of geological setting fluvial geomorphology and Quaternary stratigraphy. Environmental Science and Health part A, 42, 1795-1805.
Al-Ahmadi, M. E. (2013). Hydrochemical characterization of groundwater in wadi Sayyah, western Saudi Arabia. Appl. Water Sci.,3, p.721. Anawar, H.M., Akai, J., Komaki, K., Terao, H.,
Yoshioka, T., Shizuka, T., Safiullah, S., Kato, K. (2003). Geochemical occurrence of arsenic in groundwater of Bangladesh: sources and mobilization processes. J. Geochem. Explore, 77, 109–131.
Ansari, M. H., Vink, A. (2007). Vegetation history and palaeoclimate of the past 30 kyr in Pakistan as inferred from the palynology of continental margin sediments off the Indus delta. Review of Palaeobotany and Palynology,145, 201–216. Arain, M. B., Aslam, M., Majidano, S.A., Kuhawar,
M.Y. (2007). A preliminary study on the arsenic contamination of underground water of Matiari and Khairpur districts, Sindh province, Pakistan. Jour. Chem. Soc. Pakistan, 29, 463 – 467.
Arain, M. B., Kazi, T. G., Baig, J. A., Jamali, M. K., Afridi, H. I., Shah, A. Q., Jalbani, N., Sarfraz, R. A. (2009). Determination of arsenic levels in lake water, sediment, and food stuff from selected area of Sindh, Pakistan: estimation of daily dietary intake. Food and Chemical Toxicology, 47, 242– 248.
Baig, J. A., Kazi, T. G., Arain, M. B., Afridi, H.I., Kandhro, G.A., Sarfraz, R.A., Jamal, M.K., Shah, A. Q. (2009). Evaluation of arsenic and other physico-chemical parameters of surface and ground water of Jamshoro, Pakistan. J. Hazard. Mater,
166, 662–669.
Bano, S. (2003). Water and health issues in Sindh. Islamabad, Pakistan: United Nations System in Pakistan, 81 pages.
Bhattacharya, P., Chatterjee, D., Jacks, G. (1997). Occurrence of arsenic contaminated groundwater in alluvial aquifers from the delta plains, eastern India: options for safe drinking water supply. Water Resource Development,13, 79-92.
Brahman, K. D., Kazi, T. G., Afridi, H. I., Baig, J. M., Arain, S. S, Talpur, F. N., Kazi, A. G., Ali, J.,
Panhwar, A. H., Arain, M. B. (2016). Exposure of children to arsenic in drinking water in the Tharparkar region of Sindh, Pakistan. Sci. Total Environ., 544, 653–660.
Chakraborty, S., Wolthers, M., Chatterjee, D., Charlet, L. (2007). Adsorption of arsenite and arsenate onto muscovite and biotite mica. J. Colloid Interface Sci.,309, 392-401.
Chen, Y., Marek, G.W., Marek, T.H., Brauer, D.K., Srinivasan, R. (2017). Assessing the efficacy of the SWAT auto-irrigation function to simulate irrigation, evapotranspiration and crop response to management strategies of the Texas high plains.
Water, 9, 509.
Claire, E., Farnsworth, J., Hering, G. (2011). Inorganic geochemistry and redox dynamics in bank filtration settings. Environ. Sci. Technol.,45, 5079–5087. Clift, P. D., Blusztajn, J. S. (2005). Reorganization of
the western Himalayan river system after five million years ago. Nature,438 (7070): 1001–1003. Clift, P.D., Giosan, L. (2013). Sediment fluxes and
buffering in the post-glacial Indus basin. Basin Research, 25, 1–18
Clift, P. D. (2002). A brief history of the Indus river. In: Clift, P.D., Kroon, D., Gaedicke, C., Craig, J. (eds), Tectonic and climatic evolution of the arabian sea region. London: Geol. Soc., Spec. Pub.,
195, 237–258.
Clift, P. D., Giosan, L., Blusztajn, J., Campbell, I. H., Allen, C. M., Pringle, M., Tabrez, A., Danish, M., Rabbani, M. M., Carter, A., Leuckge, A. (2008). Holocene erosion of the lesser Himalaya triggered by intensified summer monsoon. Geology, 36, 79– 82.
analysis of geoelectrical and hydrochemical data.
Env. Geol., 40, 1278.
Giosan. L., Constantinescu, S., Clift, P.D., Tabrez, A. R., Danish, M., Inam, A. (2006). Recent morphodynamics of the Indus delta shore and shelf.
Continental shelf research, 26, 1668–1684.
Halim, M.A., Majumder, R.K., Nessa, S.A., Hiroshiro, Y., Uddin, M.J., Shimada, J., Jinno, K. (2009). Hydrogeochemistry and arsenic contamination of groundwater in the Ganges delta plain, Bangladesh.
Journal of Hazardous Materials, 164, 1335–1345. Haq, B.U. (1999). Past, present and future of the Indus
delta. In: Meadows, A., Meadows, P.S. (eds.), Indus river, biodiversity, resources, humankind. Linnaean Society of London, Oxford University Press, Oxford, UK, 231–248.
Harvey, C.F., Swartz, C.H., Badruzzaman, A.B.M., Keon-Blute, N., Yu, W., Ali, M.A., Jay, J., Beckie, R., Niedan, V., Brabander, D., Oates, P.M., Ashfaque, K.N., Islam, S., Hemond, H.F., Ahmed, M.F. (2002). Arsenic mobility and groundwater extraction in Bangladesh. Science, 298, 1602–1606. Holmes, D. A. (1968). The recent history of the Indus.
The Geographical Journal,134(3), 367–382. Hunting Survey Corporation, (1960). Reconnaissance
geology of part of west Pakistan. Toronto, Canada: Hunting Survey Corporation, a Colombo Plan-Cooperative Project, 550 pages.
Husain, V. (2009). Drinking water quality component. (Report) sindh education reform program (SERP), A study for World Bank, 58 pages.
Husain, V., Nizam, H., Arain, G.M. (2012). Arsenic and fluoride mobilization mechanisms in groundwater of Indus Delta and Thar Desert, Sindh, Pakistan. Int. Journ. Econ. Environ. Geol., 3(1), 15-23.
Jiang, H., Ding, J.H., Chang, P., Chen, Z.X., Sun, G.F., (2010). Determination of the interaction of arsenic and human serum albumin by online microdialysis coupled to LC with hydride generation atomic fluorescence spectroscopy. Chromatographia, 71, 1075–1079.
Kadri, I.B. (1995). Petroleum Geology of Pakistan. Pakistan Petroleum Limited, Ferozsons (Pvt) Limited, 275 pages.
Kahlown, M.A., Tahir, M.A., Sheikh, A.A. (2004). Water quality status in Pakistan: Second report (2002 – 2003), Pakistan Council of Research in Water Resources, Islamabad.
Kazmi, A.H. (1984). Geology of the Indus delta. In: Haq, B.U., Milliman, J.D. (eds.), Marine geology
and oceanography of Arabian sea and coastal Pakistan, Van Nostrand, New York, 71-84.
Kazmi, A. H., Jan, M.Q. (1997). Geology and Tectonics of Pakistan, Graphic Publishers, Karachi 544 pages.
Kelly, W.R (1997). Heterogeneities in groundwater geochemistry in a sand aquifer beneath an irrigated field. Journal of Hydrology,198, 154‐176.
Khan, A., Husain, V. (2019). Arsenic contamination in shallow aquifers of Holocene: A Case study from three union councils of Tando Muhammad Khan district, Sindh, Pakistan.
Int. J. of Ground Sediment & Water, 8, 383-404.
Khan, A., Husain, V., Hamid, G., Anjum, S. (2014). Arsenic contamination status in the Holocene alluvial aquifers of Indus deltaic flood plain: a case study of Tando Ghulam Hyder taluka, Sindh, Pakistan. Int. Journ. Econ. Environ. Geol., 5(2), 1-10.
Khan, S., Cao, Q., Zheng, Y.M., Huang, Y.Z., Zhu, Y.G. (2008). Health risks of heavy metals in contaminated soils and food crops irrigated with wastewater in Beijing, China. Environ. Pollut.,152, 686–692.
Khan, A.A., Memon, M.G., Danish, M., Inam, A. (1993). Distribution of surface sediments off Indus delta on the continental shelf of Pakistan. Pakistan Journal of Marine Sciences,2(1), 33–39.
Kidwai, Z.D. (1963). Geology of Rechna and Chaj Doabs, west Pakistan. West Pakistan Water and power Development Authority. Water and soil investigation Div. Bull., 5.
Kureshy, K.U. (1977). A Geography of Pakistan, 4thed.
Lang, Y.C., Liu, C.Q., Zhao, Z.Q., Li, S.L., Han, G.L. (2006). Geochemistry of surface and groundwater in Guiyang, China: Water/rock interaction and pollution in a karst hydrological system. Applied Geochemistry,21, 887–903.
Latif, M., Akram, M., Altaf, S. (1999). Groundwater contamination from nitrates in irrigated areas of Pakistan. Proceedings on water resources achievements and issues in 20th century and challenges for next millennium, Pakistan Council of Research in Water Resources, Islamabad, Pakistan.
Lee, J. I., Clift, P. D., Layne G., Blum, J., Khan, A. A. (2003). Sediment influx in the modern Indus river inferred from the trace element composition of detrital amphibole grains. Sedimentary Geology,
Malik, S.B. (2000). An overview of geothermal resources of Pakistan. In: Proceedings of the World Geothermal Congress, Kyushu, Tohoku, Japan.
McArthur, J.M., Ravenscroft, P., Safiullah, S., Thirlwall, M.F. (2001). Arsenic in groundwater: testing pollution mechanisms for sedimentary aquifers in Bangladesh, Water Resour. Res., 37, 109–117.
Mukherjee, A., Fryar, A.E., Thomas, W. A. (2009). Geologic, geomorphic, and hydrologic framework and evolution of the Bengal basin, India and Bangladesh. J. Asian Earth Sci.,34, 227–244. Mukherjee, A.B., Bhattacharya, P. (2001). Arsenic in
groundwater in the Bengal delta plain: slow poisoning in Bangladesh. Environmental Reviews,
9, 189–220.
Mukherjee-Goswami, A., Nath, B., Jana, J., Sahu, S. J., Sarkar, M. J., Jacks, G., Bhattacharya, P., Mukherjee, A., Polya, D.A., Jean, J.S., Chatterjee, D. (2008). Hydrogeochemical behavior of arsenic-enriched groundwater in the deltaic environment: Comparison between two study sites in West Bengal, India. Journal of Contaminant Hydrology,
99, 22–30.
Naseem, S. McArthur, J.M. (2018). Arsenic in groundwater and other water-quality issues, Indus alluvial plain, Pakistan. Hydrological Processes,
32, 1235-1253.
Naseem, S. Husain, V. Bano, S. (2018). Origin of salinity and other constituents in Indus deltaic plain groundwater, Thatta district, Pakistan, Journal of Coastal, Research, 34, 883–891.
Nickson, R.T., McArthur, J.M., Shrestha, B.R., Kyaw-Myint, T.O., Lowry, D. (2005). Arsenic and other drinking water quality issues, Muzaffargarh district, Pakistan, Applied Geochemistry,20, 55-68.
Nordstrom, D.K., Ball, J.W., Donahoe, R.J., Whittemore, D. (1989). Groundwater chemistry and water–rock interactions at Stripa. Geochimicaet Cosmochimica Acta,53 (8), 1727–1740.
Panhwar, M.H. (1969). Groundwater in Hyderabad and Khairpur divisions. Directorate of Agriculture, Hyderabad, region. 169 pages.
Qureshi, A.S., McCornick, P.G., Qadir, M., Aslam, Z. (2008). Managing salinity and waterlogging in the Indus basin of Pakistan. Agricultural Water Management,9(5), 1–10.
Rasheed, H. (2017). Human exposure assessment of different arsenic species in household water sources in a high risk arsenic area. Science of Total Environment, 584, 10.1016/j.scitotenv.2017.01.089
Rasool, A., Xiao., T., Farooqi, A., Shafeeque, M., Masood, S., Ali, Fahad S., Naseem, W. (2016). Arsenic and heavy metal contaminations in the tube well water of Punjab, Pakistan and risk assessment: A case study. Ecological Engineering,95, 90-100. Rowland, H.A.L., Pederick, R.L., Polya, D.A.,
Pancost, R.D., Van Dongen, B.E., Gault, A.G., loyd, J.R. (2007). The control of organic matter on microbially mediated iron reduction and arsenic release in shallow alluvial aquifers, Cambodia.
Geobiology,5(3), 281–292.
Rubab, G., Naseem. S., Khan. A., Husain. V., Murtaza. G.M. (2014). Distribution and sources of arsenic contaminated groundwater in parts of Thatta district, Sindh. Journal of Himalayan Earth Sciences,47(2), 175-183.
Samdani, Z. (1995). LBOD: A futuristic project. Economic and Business Review. Daily Dawn Karachi, III (23-29/09/1995).
Sanchez-Martoz, F., Jimenez-espinosa, R., Pulido-Bosch, A. (2001). Mapping groundwater quality variables using PCA and geostatistics: A case study of Bajo Andarax, southeastern Spain. Hydrological Sciences Journal-des Sciences Hydrologiques, 46 (2), 227-242.
Sarkar, D., Datta, R. (2004). Arsenic fate and bioavailability in two soils contaminated with sodium arsenate pesticide: An incubation study.
Bulletin Environmental Contamination and Toxicology,72, 240–247.
Shah, A.Q., Kazi, T.G., Arain, M.B., Jamali, M.K., Afridi, H.I., Jalbani, N., Baig, J.A., Kandhro, G.A. (2009). Accumulation of arsenic in different fresh water fish species potential contribution to high arsenic intakes. Food Chem.,112, 520–524.
Shamsudduha, M., Uddin, A., Saunders, J.A., Lee, M.K. (2008). Quaternary stratigraphy, sediment characteristics and geochemistry of arsenic contaminated alluvial aquifers in the Ganges– Brahmaputra floodplain in central Bangladesh. J. Contam. Hydrol.,99, 112–136.
Shrestha, B. (2002). Drinking water quality: Future directions for UNICEF in Pakistan. Consultancy report on water quality. UNICEF Pakistan, Islamabad, SWEET Project.
Smedley, P. L., Kinniburgh, D. G. (2002). A review of the source, behavior and distribution of arsenic in natural waters. Appl. Geochem.,17, 517–568. Von Bromssen, M., Jakariya, M., Bhattacharya, P.
Wagner, W.F., Berner, Z.A., Stuban, D. (2005). Arsenic in groundwater of the Bengal delta plan: geochemical evidences for small scale redox zonation in the aquifer. In Natural arsenic in groundwater, occurrence, remediation and management (eds.) J. Bundschuh, P. Bhattacharya and D. Chandra sekharam. Published by Taylor and Francis Group, London, 3-16.
Wilhelmy, H. (1967). The shifting river; studies in the history of the Indus valley. Universities,10, 53–68. World Health Organization, (2011). Guidelines
drinking water quality, Geneva. Switzerland, 564 pages.
Yan, X. P., Kerrich, R., Hendry, M. J. (2000). Distribution of arsenic (III), arsenic (V) and total inorganic arsenic in pore-waters from a thick till and clay-rich aquitard sequence, Saskatchewan, Canada. Geochim.Cosmochim.Acta., 64, 2637– 2648.
Zhang, G. L., Gong, Z. T. (2003). Pedogenic evolution of paddy soils in different soil landscapes.
Geoderma,115, 15–29.