Finding Similar Users in Social Networks by Using the
Neural-Based Skyline Region
Chun-Ching Hou
1,
Che-Kai Chang
1,
Yi-Chung Chen
1*, Heng-Yi Su
2, Yu-Liang Hsu
31 Department of Information Engineering and Computer Science, Feng Chia University, Taichung 40724,
Taiwan, R.O.C.
2 Department of Electrical Engineering, Feng Chia University, Taichung 40724, Taiwan, R.O.C.
3 Department of Automatic Control Engineering, Feng Chia University, Taichung 40724, Taiwan, R.O.C.
* Corresponding author. Tel.:+886-4-24517250; email: chenyic@fcu.edu.tw Manuscript submitted February 15, 2015; accepted May 5, 2015.
doi: 10.17706/jcp.10.5.292-299
Abstract: Finding similar users in a community network is a very important part of the recommendation system. Traditionally, algorithms of this kind are based on a single condition to search for similar users. In recent years, some scholars have proposed the popular multi-criteria algorithm Skyline Query to search for similar users. However, their proposed methods might have found users not similar to the target user and are subject to the problem of slow execution. To solve these issues, this paper introduces the concepts of neural-based skyline region and neural network. The simulation results have verified the effectiveness and execution efficiency of the target method.
Key words: Social network, skyline query, neural network.
1.
Introduction
In recent years, the personalized recommendation system [1]-[5] has gradually become an issue of concern for researchers. The system can provide customized suggestions for different users. The first step in most personalized recommendation systems is to find similar friends or users for the target user. Further, the information found from these users are provided as suggestions for the target user. For instance, the preference scores of five users A, B, C, D and E on different types of attractions are listed in Table 1. If we want to recommend A some places he may interest in. The first step of the recommendation system is to find out who has similar preferences with A among the rest of the users. User B, C and A all like knowledge- intensive attractions and dislike shopping and natural attractions. On the contrary, User D and E do not like knowledge attractions but like shopping and natural attractions. Apparently, User B and C would be more similar to A than D and E. After identifying the similarities, the recommendation system will provide A with a proposal based on the scores of B and C given to the three attractions. Since B and C like museums and dislike supermarkets and nature parks, eventually, the recommendation system will recommend A to visit the museums.
shortcoming of the current approach to searching for similar users.
Table 1. Example of the Recommendation System User knowledge-intensive shopping natural
A 9.5 1.1 1.5
B 8.7 2.0 0.4
C 9.9 0.7 2.1
D 0.1 8.9 9.5
E 0.8 9.9 9.1
Fig. 1. An example of depth-k skyline query.
In recent years, a new multi-criteria searching algorithm named Skyline Query [8]-[12] has been proposed to solve similar issues. This kind of query and its extended algorithms can separately evaluate the database information under different conditions. Chiu et al. [13] use the concept of depth-k skyline query to find similar users and effectively solve the disadvantages that the traditional recommendation system met. Figure 1 shows an inquiry example proposed by Chiu et al. [13], where X-axis and Y-axis are the differences in preference score for knowledge-intensive attractions and shopping attractions between User A and other users, respectively. In this example, we can see that User B is more similar to User A than User E. Regardless of the type of attractions, knowledge-intensive or shopping, the differences in preferences scores of user B are smaller than user E. Under this circumstance, B dominates E. The depth-k skyline query is able to find out the user who is dominated by a maximum of k users among all users. The black dots in Fig. 1 are the results of depth-2 skyline query. Obviously, the preference scores of these information points are similar to User A in knowledge-intensive attractions or shopping attractions. However, the method proposed by Chiu et al. has two fatal shortcomings. Firstly, the depth-k skyline query only counts how many times information points are dominated, without using the values in each user dimension for evaluation. Some very similar points might be deleted by the algorithm simply because they are dominated by merely one more time. Secondly, the execution time of the method will increase exponentially with data size. Hence some alternative algorithms should be proposed to effectively address these shortcomings.
skyline region. Since this region only considers the value of each dimension, without considering how many times the information points are dominated, we have solved the first disadvantage of [13]. However, we still need to resolve the second disadvantage of [13]. To check whether a point has fallen into the skyline region, this point must do domination comparison with all the virtual points that form the skyline region. The execution of the algorithm might take up a lot of time, especially when virtual points are excessive.
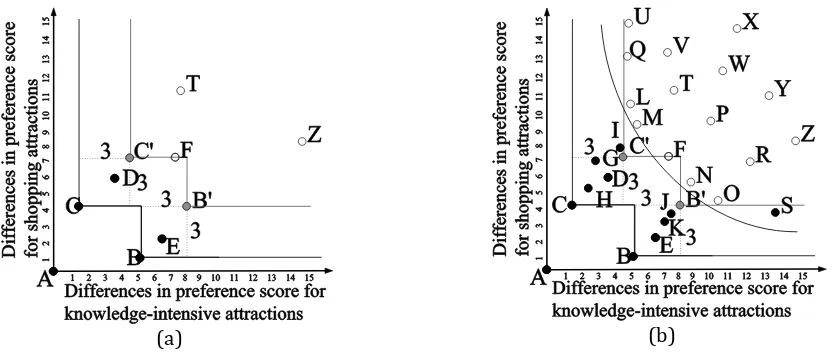
Neural network is used in this paper to simulate the skyline region in Fig. 2(b); and the neural-based skyline region as shown in the curve line of Fig. 2(b) is derived. This region is very similar to the skyline region in Fig. 2(b). It does not affect our searching for similar users in a community network. Meanwhile, it is quite simple to inspect whether an information point has fallen into the neural-based skyline region: we only need to input the information point into the neural network for inspection. Such a linear time processing will solve the second disadvantage of [13].
(a) (b)
Fig. 2. An example of neural-based skyline region. (a) Find virtual points, (b) Construct the neural-based skyline region.
The remainder of this paper is organized as follows. Section 2 will introduce how to find out skyline friends from the user's friends. Section 3 will explain how to establish a neural-based skyline region with a neural network. Section 4 deals with experimental simulation. Section 5 is for conclusions.
2.
Sorted First Skyline Algorithm
Sorted First Skyline (SFS) Algorithm [14] is one of well-known skyline algorithms. With a small amount of data which make it inconvenient to establish an R-tree, SFS algorithm can get the skyline result in a shorter time. The user data in the community network that this paper is going to process just meet these conditions. Hence this paper directly employs this method. This method is mainly designed based on the following core law, in which Manhattan distance refers to the sum of different dimensional values for an information point.
Lemma 1 The Manhattan distance of smaller information point p will not be dominated by Manhattan distance of larger information point q.
Proof We use reductio ad absurdum (contradiction method) to prove this law. Suppose that q dominates
p and the Manhattan distance of q is greater than p. First of all, according to the definition of domination, if
q dominates p, the values of q in all dimensions are all lower than p. It means that the sum of all dimensional values of q (i.e., Manhattan distance) must be smaller than p. It contradicts with our hypothesis. Hence our proof is valid.
distances, starting from User p with the smallest Manhattan distance, and we sequentially conduct domination comparison with User q with a larger Manhattan distance. In each comparison, there are possibilities as follows.
p and q are incomparable: Under this condition, q may become a skyline friend and will be retained for subsequent inspection.
p dominates q: Under this condition, q is no longer eligible to become a skyline friend and will be removed directly from the data set.
3.
Math Neural-Based Skyline Region
3.1.
Training Data of the Proposed Neural Network
Training data in this paper will come from the data of the target user's friends, and training inputs will be the coordinate locations of the friends’ data. For instance, in Fig. 2(b), the training inputs of Point B and F will be (5, 1) and (7, 7). The training output will be the result of whether the friend falls into the skyline region. In Fig. 2(b), training outputs of Point B and F will be 1 and -1; 1 means that A falls into the skyline region. While -1 means that F does not fall into the region.
3.2.
Structure of the Proposed Neural Network
The neural network to be used in this paper including input layer, one hidden layer, and output layer, as shown in Fig. 3. The node count of input layer and hidden layer will be equal to the dimension count of information points. The output layer only has a node. It is responsible for outputting the result of information point Q falling into the neural-based skyline region. First, we analyze the input layer. Since the input layer has no action, its output will be directly designated as the input:
outi(1)=ui. (1)
Next, in the hidden layer, the input will be calculated by tangent sigmoid. The equation of this layer can be written as:
1 (1) 1 (1)
1 1
(2)
1 (1) 1 (1)
1 1
exp( ) exp( )
,
exp( ) exp( )
d d
ij j i ij j i
j j
i d d
ij j i ij j i
j j
w out b w out b
out
w out b w out b
(2)where w is the weight value between layers; b is the bias value; exp(۰) is the exponential function. Finally, we look at the output layer. The information in this layer integrates the data values from the aforementioned hidden layer; and outputs the final result. The formula is:
(3) 2 (2)
1
.
d
j j j
y out w out
(3)3.3.
Training Algorithm of the Proposed Neural Network
This paper is expected to use back propagation algorithm [15], [17] to train the neural network. Suppose that the target function that the training network is required to attain is:
2 2
1 1
2 2
( , ) ( d( ) ( )) ( ) ,
Error wi y i y i error i (4)
following equation from this error value:
( ) ( Error)+ ( 1),
w i w i
w
(5)
( ) ( 1) ( ),
w i w i w i (6)
where ξ is the training ratio used to adjust the magnitude of parameters in each modification and to complete the back propagation algorithm. The neural network referred to in this plan can be optimized through adjusting the parameters of this algorithm. Firstly, the update rule for w2 is
2 2
2 ( )
( ) ( 1) ( E i ),
w i w i
w
(7)
where
2 exp( ( )) exp( ( ))
( ) ,
exp( ( )) exp( ( ))
i i
i i
s i s i
E w error i
s i s i
(8)
1
1
( ) ( ) ,
d
i ij i
j
s i w i b
u (9)Secondly, the update rule for w1 is
1 1
1 ( )
( ) ( 1) ( E i ).
w i w i
w
(10)
Similarly, 1 E w
can be calculated as
1 2
4
( ) ( ).
(exp( ( )) exp( ( )))
E
e i i
w i i
2
w u
s s (11)
Next, the parameter b can be updated by the following equations.
( ) ( ) ( 1) ( E i ).
b i b i
b
(12)
2
4
( ) .
(exp( ( )) exp( ( )))
E e i
b i i
2
w
s s (13)
With thesethree phases, we are able to construct the proposed Neural-Based Skyline Region.
4.
Simulation
counts. The comparison object was the depth-k skyline algorithm proposed by Chiu et al. All of the experiments were performed on a computer running Microsoft Windows XP on an Intel i7-3770 CPU at 3.40GHz with 4 GB main memory. All programs were written in MATLAB®.
Fig. 3. The time cost considering the effect of number of data dimensions.
Fig. 3 shows our simulation results. This diagram clearly indicates that our proposed algorithms (i.e., neural-based skyline region) are much faster than the depth-k skyline (i.e., SFDS) algorithm proposed by Chiu et al. Besides, in Fig. 3, we also observed that the required searching time of this algorithm would grow with data dimensions. This is because the higher the dimensional number, the greater the number of skyline information points (i.e., users). The algorithm needs to spend more time finding all the hits.
5.
Conclusions
This paper introduces the concept of neural-based skyline region to search for users similar to a specific user in the community network. This new approach overcomes the shortcomings of the depth-k skyline algorithm proposed by Chiu et al.. Its shortcomings are: (1) it merely considers the number of dominated information points, without judging the similarity based on the dimensional values of information points; and (2) it does not use the neural network to speed up the search of similar users. Ultimately, the Simulation section verified the effectiveness and efficiency of our approach.
Acknowledgment
This work was supported in part by the Ministry of Science and Technology of Taiwan, R.O.C., under Contracts MOST 103-2218-E-035-018 and MOST 103-2221-E-035-101.
References
[1] Hsieh, H. P., Li, C. T., & Lin, S. D. (2012). Exploiting Large-scale check-in data to recommend time-sensitive routes. Proceedings of the ACM SIGKDD Int. Workshop on Urban Computing (pp. 55-62). [2] Lu, E. H. C., Chen, C. Y., & Tseng, V. S. (2012). Personalized trip recommendation with multiple
constraints by mining user check-in behaviors. Proceedings of Int. Conf. on Advances in Geographic Information Systems.
[3] Yang, D. N., Shen, C. Y., Lee, W. C., & Chen, M. S. (2012). On socio-spatial group query for location-based social networks. Proceedings of International Conference on Knowledge Discovery and Data Mining (pp. 949-957).
[4] Ying, J. J. C., Lu, E. H. C., Kuo, W. N., & Tseng, V. S. (2012). Urban point-of-interset recommendation by mining user check-in behaviors. Proceedings of ACM SIGKDD International Workshop on Urban Computing (pp. 55-62).
recommendation system. Proceedings of International Symposium on Spatial and Temporal Databases. [6] Li, M. J., Ng, M. K., Cheung, Y. M., & Huang, J. Z. (2008). Agglomerative fuzzy K-means clustering
algorithm with selection of number of clusters. IEEE Transactions on Knowledge and Data Engineering,
20(11), 1519-1534.
[7] Shamir, O., & Tishby, N. (2010). Stability and model selection in k-means clustering. Machine Learning,
80(2-3), 213-243.
[8] Borzsonyi, S., Kossmann, D., & Stocker, K. (2001). The skyline operator. Proceedings of IEEE Int. Conf. on Data Engineering (pp. 235-254).
[9] Papadias, D., Tao, Y., Fu, G., & Seeger, B. (2003). An optimal and progressive algorithm for skyline queries. Proceedings of SIGMOD.
[10]Zhang, W., Lin, X., Zhang, Y., & Wang, W. (2009). Probabilistic skyline operator over sliding windows.
Proceeding of IEEE International Conference on Data Engineering (pp. 1060-1071).
[11]Zhang, Z., Guo, X., Li, H., Tung, A. K. H., & Wang, N. (2005). Discovering strong skyline points in high dimensional spaces. Proceedings of ACM International Conference on Information and Knowledge Management (pp. 247-248).
[12]Zhang, Z., Cheng, R., Papadias, D., & Tung, A. K. H. (2009). Minimizing the communication cost for continuous skyline maintenance. Proceedings of ACM SIGMOD International Conference on Management of Data (pp. 495-508).
[13]Chiu, S. M., Chen, Y. C., Su, H. Y., & Hsu, Y. L. (2015). Finding similar users in social networks by using the depth-k skyline query. Proceedings of IEEE conf. on Consumer Electronics.
[14]Bartolini, I., Ciaccia, P., & Patella, M. (2006). SaLSa: Computing the skyline without scanning the whole sky. Proceedings ofCIKM (pp. 405-414).
[15]Hagan, M. T., Demuth, H. B., & Beale, M. (1997). Neural Network Design. Boston: PWS.
[16]Wang, J. S., & Chen, Y. C. (2008). A hammerstein-wiener recurrent neural network with universal approximation capability. Proceedings of IEEE International Conference on Systems, Man and Cybernetics (pp. 1832-1837).
[17]Yam, J. Y. F., & Chow, T. W. S. (2000). A weight initialization method for improving training speed in feedforward neural network. Neurocomputing, 30(1-4), 219-232.
[18]Pelechrinis, K., & Krishnamurthy, P. (2012). Location affiliation networks: Bonding social and spatial information. Proceedings of European Conf. Learning and Knowledge Discovery in Databases.
Chun-Ching Hou is a university student in the Department of Information Engineering and Computer Science at Feng Chia University, Taiwan. His research interests include databases and artificial intelligences.
Che-Kai Chang is a university student in the Department of Information Engineering and
Yi-Chung Chen received the B.S. and M.S. degrees in electrical engineering from National Cheng Kung University, Tainan, Taiwan, in 2007 and 2008, and the Ph.D. degree in the Department of Computer Science and Information Engineering from National Cheng Kung University, Tainan, Taiwan, in 2014. He is currently an assistant professor in the Department of Automatic Control Engineering, Feng Chia University. His research interests include databases and artificial intelligences.
Heng-Yi Su was born in Taipei, Taiwan, R.O.C., in 1980. He received the M.S. and Ph.D. degrees in electrical engineering from National Taiwan University (NTU), Taipei, Taiwan in 2005 and 2014, respectively. Currently, he is an assistant professor of electrical engineering at Feng Chia University (FCU). His research interests include applications of PMUs to power system voltage stability monitoring and control.