Application of Data Mining in the Colleges’ in-Class
Teaching Quality Evaluation System
Aifeng Li
*, Kui Liu, Zhiyou Ge
Network & Modern Education Technique Center, Guangzhou University, Guangzhou 510006, P.R.China.
* Corresponding author. Tel.: (+86)-20-39396390-306; email: [email protected] Manuscript submitted January 30, 2014; accepted May 8, 2015.
doi: 10.17706/jcp.10.3.166-175
Abstract: In this paper, we explore the characteristics of teaching quality evaluation of our university. Based on an effective dataset from teacher evaluation system, we apply data mining (DM) technique to teaching quality evaluation system and give related case analysis. The analyzed results show there exists the hidden relationship between the teacher’s attributes, such as title, degree, age, seniority, and load, and the in-class teaching quality evaluation results. In addition, we reveal how the course’s attributes, such as property, credit, week hour, and number of students, impact the in-class teaching quality evaluation results. The mined rules are basically accorded with the reform of educational system made recently in our university, thus providing effective guidance to talent development, teaching management, and input of talent in higher education system.
Key words: Data mining, teaching evaluation, decision tree, association rule.
1.
Introduction
Teaching quality is core for a university to survive and develop, and is a measure tendency toward international higher education. Currently, teaching quality evaluation is simply made by only weighting the teachers’ scores from their students, peers, themselves, leaders and so on. However, in fact, which factors impact the teaching quality is often more important. With the wide and deep application of digital campus system, a large amount of evaluation data from students is accumulated in educational management system. Conventional methods used to analyze these data are of simple and statistical concept. Also, the deep association analysis is not made to mine the various factors of impacting the teaching quality evaluation results. However, these factors are very vital for the educational administrator to make policy. It is an urgent task to provide decision support for the administrator by effectively analyzing and processing these data so that the valuable hidden information can be mined.
Data mining (DM) technique is an effective mean to obtain valuable information from mass data and has been widely applied to various fields [1], [2], such as telecommunication, retail sale, insurance, and finance, since a large amount of data is usually accumulated in these fields. For example, in retail sale, in order to improve sales performance, technicians from market analysis department exploit DM to analyze market basket and consumer’s habit [3]-[5]. Up to now, many teaching quality evaluation systems based on DM technique have also been developed [6], [7]. However, there are few published works focusing on analyzing the evaluation results. Besides, the practical applications of the obtained rules are not well investigated in literature.
management system and discover the inherent rule and knowledge hidden behind these data, this paper focuses on investigating DM technique and its application in digital campus educational management system. To be specific, we employ the association rule algorithm and the classification technique to analyze the evaluation data on teacher’s teaching quality. We then exploit C4.5 algorithm to construct the decision tree of course’ attributes, which can be used to mine the potential relationship between the course’ attributes and the teaching quality. In the last, we employ Aprior algorithm to discover some important rules between the teacher’s attributes and his in-class teaching quality evaluation results. As a result, we expect that our mined rules can provide great help for the educational policymaker.
2.
DM Technique
2.1.
Backgrounds of DM
DM, also known as knowledge discover in database (KDD), is currently hot topic in artificial intelligence and database area [8]-[11]. DM is an unordinary process of revealing the hidden, previously unknown and valuable information from mass data in database [12]-[14]. It is also a kind of decision supporting process, which is mainly built upon machine learning, pattern recognition, statistics, database and visualization. With help of DM technique, analytical deduction, mining potential pattern, adjusting marketplace strategy, decreasing risks and true decision can be made effectively for the policymakers.
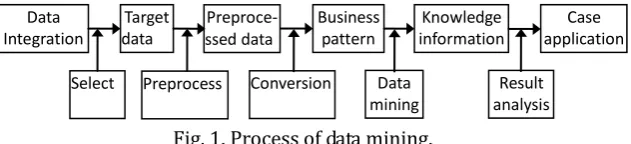
In general, DM can be divided into the following several steps: determining mined object, data preparation, creating model, data mining, and result analysis and its applications, as shown in Fig. 1 [5], [6]. In the first step, data from various databases, files, and media and so on, are selected as the mining object. However, the obtained data in the first step may have incorrect or missing data. The data preparation (a.k.a. data preprocessing) can correct and remove these erroneous data. Next, a common data format can be obtained by data conversion. Then, based on the data mining task being performed, data mining step applies algorithms to the transformed data to generate the desired results. Finally, the mined results are presented to the users by various visualization or graphical user interface (GUI). The implementations of DM technique include prediction, clustering, association rule analysis, classification, and neural network, etc. In this paper, we employ only the two of them, namely association rule and classification methods, to analyze our issues. In what follows, we first discuss the two methods.
Fig. 1. Process of data mining.
2.2.
Association Rule
Association rule is a kind of DM methods which can effectively discover the hidden correlation in data. Technically speaking, some rules satisfied with certain conditions can always be found in large-scale database. Here, to make the paper self-contained, we first give the related definitions of association rule as follows [15].
Definition 1: Given a set of items I={I1, I2, …, Im} and a database of transactions D={ t1, t2, …, tn} where ti ={ Ii1, Ii2, …, Iik} and Iij∈I, an association rule is an implication of the form X=>Y where X,Y
I are sets of items called itemsets and X∩Y=ø.Definition 2: The support (s) for an association rule X=>Y is the percentage of transactions in the database that contain X∪Y.
Definition 3: The confidence or strength (α) for an association rule X=>Y is the ratio of the number of
Business pattern Data
Integration
Target data
Preproce- ssed data
Knowledge information
Case application
Select Preprocess Conversion Data mining
transactions that contain X∪Y to the number of transactions that contain X.
We, in general, are not interested in all implications but only these that are important. The importance usually is measured by two features called support and confidence as defined in Definitions 2 and 3, respectively. In other word, if the support of a rule is very low, this rule will just appear occasionally. Therefore, we think this rule is basically meaningless. The confidence reflects the reliability of a rule. Only the rules whose confidences are larger than a certain threshold are reliable. Therefore, the user can employ these two thresholds to further refine the mined rules. The finally obtained rules are called the strong rules. This refined procedure can be illustrated by the following definition [15].
Definition 4: If Support (X=>Y)≥minsup and Confidence (X=>Y)≥minconf, X=>Y is a strong rule, where minsup and minconf are the two corresponding threshold.
The commonly used association rule algorithms include Apriori, FP-Growth, etc. Apriori is the most typical one among them, which is proposed by Agrawal et al. in 1993 [16]. The main idea of Apriori is illustrated as follows:
Inputs:
D //Database of transactions I //Items
L //Large itemsets s //Support α //Strength Outputs:
R //Association rules satisfying s and α
(1) R=ø ;
(2) L1=find_frequent_1_itemset(D);//find first itemset (3) for (k=2; Lk-1ø; k++) do begin
(4) Ck=apriori-gen(Lk-1,minsup); //new candidate set (5) for all transactions tD do begin
(6) Ct=subset(Ck,t);
(7) for all candidates cCt do (8) c.count++;
(9) end
(10) Lk={cCk |c.countminsup} (11) end
(12) R=R∪Lk; (13) end
We can see from the above that Apriori is based on a priori knowledge of frequent itemsets. It adopts a layer-by-layer iteration searching. In Apriori algorithm, all frequent 1 itemsets are first searched by scanning the transaction records. All of the frequent 1 itemsets are denoted as the set L1. Then, L1 is used to search the set L2 of frequent 2 itemsets, and L2 serves as L3 in the same way. The iteration continues until no frequent K itemset is found. Finally, we extract the strong rules from all the frequent itemsets. These strong association rules are interest for the users [17], [18].
2.3.
Classification
and leaf. Node and leaf represent attribute and type respectively. The top node of the tree is called root node. Any route from root node to leaf node forms a classification rule. In various implementations of decision tree algorithm, C4.5 is the most commonly used one. It adopts information gain ratio [19] to overcome the drawback of tending to select the attributes with many values when only using information gain in ID3 [19]-[22]. Using C4.5, the continuous attribute can be discretized and the incomplete data can be also processed. In the following, we give the detailed description.
Definition 5: Given probabilities p1, p2, …, pN where
1 1
Ni
i p , entropy is defined as [19]
1 2 1
(
,
,...,
N)
N ilog(
i)
i
H p p
p
p
p
. (1)Given a database state D, H(D) is to find the amount of order in that state. When that state is split into N new states S={D1, D2, …, DN}, the entropy of those states can be computed. Each iteration in C4.5 aims at choosing the state that orders splitting the most. A database state is totally ordered if all tuples in it are in the same class. C4.5 chooses the splitting attribute with the highest gain in information, where gain is defined as the difference between how much information is needed to make a correct classification before and after the split. Certainly, the split should reduce the information needed by the largest amount. This is calculated by determining the differences between the entropies of the original dataset and the weighted sum of the entropies from each of the subdivided datasets. The entropies of the split datasets are weighted by the fraction of the dataset being placed in that division. The gain of a particular split is calculated by the following formula:
N
=1
( , ) ( )-
( i) ( i)i
Gain D S H D P D H D . (2)
The gain ratio of C4.5 is defined as
1 ( , ) ( , )
| |
| | ,...,
| | | |
N
Gain D S GainRatio D S
D D H
D D
. (3)
For splitting purposes, C4.5 exploits the largest GainRatio so that a larger than average information gain can be ensured. This is a compensation for the fact that the GainRatio value is skewed toward splits where the size of one subset closes toward that of the starting one.
3.
Applications of DM in Teaching Quality Evaluation System
3.1.
Setting Mined Goals
Determining the mined goals is an important step in data mining. Over the years, the in-class teaching quality evaluation system has been applied to supervise the undergraduate teaching quality of Guangzhou University. Subsequently, a large amount of evaluation data from students is accumulated and continues to be fast increased. It is common attention for both administrators and teachers how to analyze the problem with the teachers’ in-class teaching from these complicated data and how to improve the in-class teaching quality so as to effectively run teaching management.
Based on the above demand, we set the goals as the following steps: 1) analyzing the teaching quality evaluation data and its related data, 2) mining the potential factors of impacting the teaching quality evaluation results, and 3) proposing the method of improving the teaching quality based on the mined rules.
3.2.
Setting DM Model
3.2.1.
Mining model of teacher’s attributes
It is expected that there exits the hidden relationship between the teaching quality and the teacher’s attributes such as sex, age, title, degree. Thus, we construct mining model of teacher’s attributes. Then, we attempt to mine the inherent rules so that we can find the most important factors of impacting the teaching quality.
3.2.2.
Mining model of course’s attributes
In practice, except the teacher’s attributes impact the teaching quality evaluation results, the course’s attributes such as week hours, number of students selecting the course, credit, property, and style, may have a certain effect on the evaluation results. So we construct mining model of course’s attributes.
3.3.
Determining Data Source
After the mining models are selected, the data source is naturally determined. In this paper, our data source mainly comes from the databases of the in-class teaching quality evaluation system, human resource management system, and educational system. In order to implement data mining on these complicated data from various databases, we need to construct datahouse to preprocess and transform these data to a proper format. The size of datahouse is large and its update is unusual. So we must optimize the datahouse to obtain its high speed inquire performance. To exploit OLAP, we build an inter-database, as shown in Fig. 2.
Fig. 2. Process of data extraction, transform, and loading.
3.4.
Case Analysis
3.4.1.
Mining rules between the teacher’s attribute and the teaching quality evaluation
result
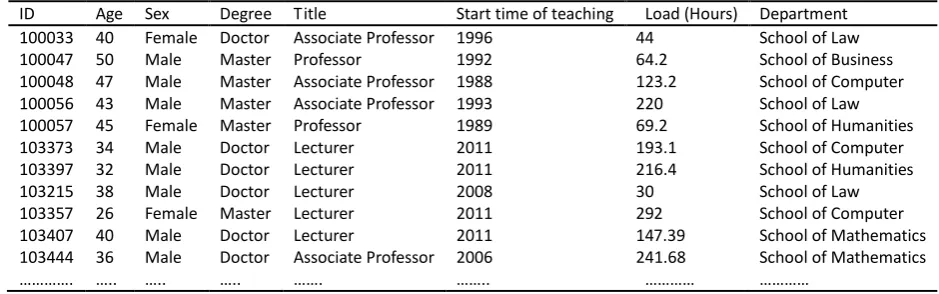
Data collection and preprocessing: This section focuses on exploring the relationship between the evaluation result and the teacher’s attribute including title, degree, age, seniority, and load. We select the teacher’s attribute and the teaching evaluation results from the first semester of 2012 to 2013 year as the test dataset. Part of them is shown as Tables 1 and 2.
Table 1. Basic Information of Teacher
ID Age Sex Degree Title Start time of teaching Load (Hours) Department 100033 40 Female Doctor Associate Professor 1996 44 School of Law
100047 50 Male Master Professor 1992 64.2 School of Business
100048 47 Male Master Associate Professor 1988 123.2 School of Computer 100056 43 Male Master Associate Professor 1993 220 School of Law 100057 45 Female Master Professor 1989 69.2 School of Humanities
103373 34 Male Doctor Lecturer 2011 193.1 School of Computer
103397 32 Male Doctor Lecturer 2011 216.4 School of Humanities
103215 38 Male Doctor Lecturer 2008 30 School of Law
103357 26 Female Master Lecturer 2011 292 School of Computer
103407 40 Male Doctor Lecturer 2011 147.39 School of Mathematics
103444 ………….
36 …..
Male …..
Doctor …..
Associate Professor …….
2006 ……..
241.68
…………
School of Mathematics …………
Teaching quality evaluation database
Human resource management
database Educational adminis-tration
database
Inter-
database Datahouse
Table 2. Teacher’s Evaluation Results in the First Semester of 2012-2013 Year
ID Course Code Year Semester Score Grade
100047 10435051 2012~2013 1 92.7 Excellent
100048 160003014 2012~2013 1 97.5 Excellent 100056 160003005 2012~2013 1 97.3 Excellent
100057 10405016 2012~2013 1 94.6 Excellent
103373 3001 2012~2013 1 88.2 Good
103397 3041557 2012~2013 1 82.6 Good
103215 120325011 2012~2013 1 80.8 Good
103357 220104002 2012~2013 1 90.7 Excellent 103407 160003001 2012~2013 1 91.8 Excellent 103444
………….
230004007 ……
2012~2013 …..
1 …..
83 ……
Good ……..
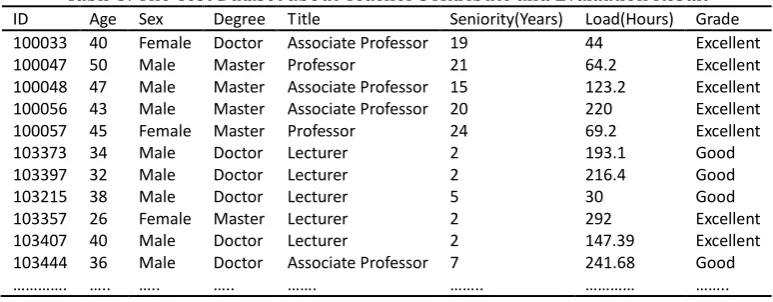
Table 3. The Test Dataset about Teacher’s Attribute and Evaluation Result
ID Age Sex Degree Title Seniority(Years) Load(Hours) Grade 100033 40 Female Doctor Associate Professor 19 44 Excellent
100047 50 Male Master Professor 21 64.2 Excellent
100048 47 Male Master Associate Professor 15 123.2 Excellent 100056 43 Male Master Associate Professor 20 220 Excellent
100057 45 Female Master Professor 24 69.2 Excellent
103373 34 Male Doctor Lecturer 2 193.1 Good
103397 32 Male Doctor Lecturer 2 216.4 Good
103215 38 Male Doctor Lecturer 5 30 Good
103357 26 Female Master Lecturer 2 292 Excellent
103407 40 Male Doctor Lecturer 2 147.39 Excellent
103444 ………….
36 …..
Male …..
Doctor …..
Associate Professor …….
7 ……..
241.68 …………
Good ……..
We perform a data joint on Table 1 and Table 2 to obtain the to-be-mined object data, as shown in Table 3. It is clear that the data format in Table 3 cannot be directly used to perform Apriori algorithm. They must be converted into transaction database. In conversion, all of the attribute values are first discretized to the corresponding code formats. The codes of various attribute values are as shown in Table 4.
Each row in Table 3 is acted as a transaction record. Every field of a record is converted to the corresponding item using codes table (Please refer to Table 4). For instance, a record is as follows:
ID 103215 Age 38 Sex Male Degree Doctor
Title Associate professor Seniority 7
Load 241.68 Grade Good
This record is then converted to the corresponding transaction as follows:
{A16, A1, A5, A7, A9, A21, A23}
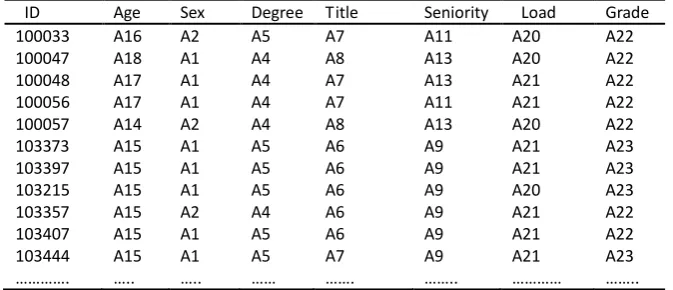
After processed in the above, we can finally obtain a transaction database about the in-class teaching evaluation result as shown in Table 5.
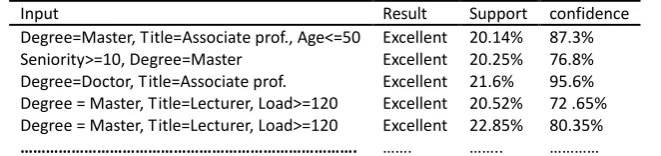
0.7, and 5, respectively. The final mined association rules consist of 40 items, part of which is shown in Table 6. We can see from Table 6 that according to the rule 3 the team which consists of young and middle-aged teachers with title of associate professor and doctor degree play an important role in teaching staff. Therefore, these teachers should be placed on the teaching front line so that they can play a vanguard and exemplary functions in teaching. It can still be observed that the teachers with age of lower than 50, title of associate professor, and master degree have very rich teaching experience. The young teachers can ally with these old teachers so as to learn from them. In so doing, the teaching ability of the young teachers can be improved fast and fully. In recruit, the young doctors and the experienced teachers with title of professor should be superiorly considered so as to improve the level of the whole teacher team. The trend of the reform of education system recently made in our university is well accordance with these mined rules. Therefore, our mined rules can provide great supports for education policymaker.
Table 4. Attribute Values and Their Codes
Attribute Value Code Attribute Value Code
Sex Male A1 Load 0~120 A20
Female A2 Larger than 120 A21
Degree
Bachelor A3
Title
Lecturer A6
Master A4 Associate Prof. A7
Doctor A5 Professor A8
Seniority
1~10 A9
Age
0~35 A15
11~20 A11 36~40 A16
21~30 A13 41~45 A17
More than 30 A14 46~50 A18
Grade
Excellent A22 50~65 A19
Good A23
Average A24
Pass A25
Table 5. Transaction Database about Teacher’s Attribute and Evaluation Result
ID Age Sex Degree Title Seniority Load Grade
100033 A16 A2 A5 A7 A11 A20 A22
100047 A18 A1 A4 A8 A13 A20 A22
100048 A17 A1 A4 A7 A13 A21 A22
100056 A17 A1 A4 A7 A11 A21 A22
100057 A14 A2 A4 A8 A13 A20 A22
103373 A15 A1 A5 A6 A9 A21 A23
103397 A15 A1 A5 A6 A9 A21 A23
103215 A15 A1 A5 A6 A9 A20 A23
103357 A15 A2 A4 A6 A9 A21 A22
103407 A15 A1 A5 A6 A9 A21 A22
103444 ………….
A15 …..
A1 …..
A5 ……
A7 …….
A9 ……..
A21 …………
A23 ……..
3.4.2.
Mining rules between the course’s attributes and teaching quality evaluation
results
Teaching quality evaluation model based on C4.5 decision tree:We choose TipDM tool [24] to construct DM model [25]. C4.5 decision tree module of TipDM is used for evaluating the test 3000 records. In the experiments, the target decision tree is finally generated through data inputting, parameters set, and model training. We extract the part of these rules as follows:
Rule 1: course property=basic course and week hour>22 THEN the ratio of excellent is 31.3%.
Rule 2: course property=required course and examination style=check and score <=1.5 and week hour<=24 THEN the ratio of excellent is 21%.
Rule 3: course property=selective course and week hour<=45 and numbers<=42 THEN the ratio of excellent is 33.8%.
It can be observed from our mined rules that there is not necessary connection between the number of students and the evaluation grades. However, these courses with 22-45 week hours obtain relatively better evaluation grades. This is because the week hours of these courses are moderate and match the tolerable force of the student very well. We can still see that the basic and required courses have high grades. It is mainly due to the facts that these courses are professional and their credits are high. Naturally, these courses are very crucial for students, thus resulting in better evaluation grades. The mined rules imply that the comprehensive evaluation on the teacher is not just referred to the final grades since the course’s attribute also play an important effect on the result. As a heuristic consequence, our mined rules should be careful considered when the policymaker performs the reform of educational system.
Table 6. The Obtain Rules under Support of 0.2 and Confidence of 0.7 Conditions
Input Result Support confidence
Degree=Master, Title=Associate prof., Age<=50 Excellent 20.14% 87.3% Seniority>=10, Degree=Master Excellent 20.25% 76.8% Degree=Doctor, Title=Associate prof. Excellent 21.6% 95.6% Degree = Master, Title=Lecturer, Load>=120 Excellent 20.52% 72 .65% Degree = Master, Title=Lecturer, Load>=120 Excellent 22.85% 80.35%
………. ……. …….. …………
Table 7. The Test Dataset about Course’s Attribute and Evaluation Result
ID Credit Week hour Property Style Numbers Grade 100033 2 36 Required Exam 26 Excellent 100047 2 36 Selective Check 27 Excellent 100048 1.5 54 Basic Check 27 Excellent 100056 2.5 72 Basic Check 28 Excellent 100057 2 36 Selective Exam 27 Excellent
103373 3 54 Basic Exam 40 Good
103215 2 36 Selective Check 43 Good
103357 1 28 Required Exam 27 Good
103407 3.5 72 Basic Check 35 Excellent 103444
…………. 4 ……
72 …….
Required ………
Exam ……..
37 …..
Excellent ……
Table 8. The Final Training Data for C4.5
ID Credit Week hour Property Style Numbers Grade 100033 [1,2] [28,36] Required Exam [20,30] Excellent 100047 [1,2] [28,36] Selective Check [20,30] Excellent 100048 [1,2] (36,54] Basic Check [20,30] Excellent 100056 [2.5,3] (54,72] Basic Check [20,30] Excellent 100057 [1,2] [28,36] Selective Exam [20,30] Excellent 103373 (2.5,3] (36,54] Basic Exam (30,40] Good 103215 [1,2] [28,36] Selective Check (40,50] Good 103357 [1,2] [28,36] Required Exam (20,30] Good 103407 (3,4] (54,72] Basic Check (30,40] Excellent 103444
…………. (3,4] ……
(54,72] …….
Required ………
Exam ……..
(30,40] …..
4.
Conclusions
The in-class teaching quality evaluation is an important way to assess the teacher’s teaching skill, thus becoming a vital part of the higher education management. This paper attempts to apply data mining technique to discover some hidden rules and valuable information. The teaching quality evaluation data accumulated over the years are selected as the test data. We create the two DM models, which are about how the teacher’s attribute and the course’s attribute affect the evaluation results, respectively. In contrast, the two DM algorithms, namely association analysis and decision tree, are respectively used to analyze the corresponding DM model. The experimental results show that our mined rules are reliable and practical. Therefore, these rules can significantly improve the efficiency of policymaker of higher education system.
Acknowledgment
This work was supported in part by the education science planning project of Guangzhou city (12A029). The authors would like to thank Dr. Y.-G. Wang of Zhongkai University of Agriculture and Engineering for his value discussions.
References
[1] Chen, M., Han, J., & Yu, P. (1996). Data mining: An overview from database perspective. IEEE Transactions on Knowledge and Data Engineering, 8(6), 866-883.
[2] Han, J., & Kamber, M. (2005) Data Mining Concepts and Techniques. San Francisco: Morgan Kaufmann Publishers.
[3] Hu, H., Dai, W., Dai, Y., Zhang, P., & Liu, X. (2012). Flexible business support system for stock index futures transaction. Journal of Software, 7, 2630-2639.
[4] Han, D., Dai, Y., & Zhang, Z. (2013). Early warning and monitoring system of the economic situation in real estate market. Journal of Software, 8, 2064-2071.
[5] Shen, C., Lee, H., Chou, C., & Cheng, C. (2011). Data mining the data processing technologies for inventory management. Journal of Software, 6(4), 784-791.
[6] Romero, C., & Ventura, S. (2007). Educational data mining: a survey from 1995 to 2005. Expert Systems with Applications, 33(1), 135-146.
[7] Romero, C., Ventura, S., & Enrique, G. (2008). Data mining in course management systems: Moodle case study and tutorial. Computers & Education, 51(1), 368–384.
[8] Beck, J. E. (2005). Engagement tracing: Using response times to model student disengagement. Proceedings of the 12th International Conference on Artificial Intelligence in Education (pp. 88-95). [9] Han, H., Shi, Y., Wang, W., & Dai, Y. (2013). Research on multi-level association rules based on
geosciences data. Journal of Software, 8(12), 3269-3276.
[10]Wang, Q., & Megalooikonomou, V. (2010). A performance evaluation framework for association mining in spatial data. Journal of Intelligent Information Systems, 35(3), 465-494.
[11]Zhang, M. (2011). Application of data mining technology in digital library. Journal of Software, 6(4), 761-768.
[12]Usama, F., Gregory, P., & Smyth, P. (1996). From data mining to knowledge discovery in databases. AI Magazine, 17(3), 23-34.
[13]Wang, D., Hu, X., & Liu, X. (2009). Research on attribute-oriented induction based on quantitative extended concept lattice and multi-granule association rule mining. Journal of Systems Engineering, 24, 54-61.
[15]Dunham, M. H. (2003). Data Mining Introductory and Advanced Topics, New Jewry: Prentice Hall Press. [16]Bradley, P., Gehrke, J., Ramakrishnan, R., & Srikant, R. (2002). Scaling mining algorithms to large
databases. Communications of the ACM, 45(8), 38-43.
[17]Han, J., Pei, J., Yin, Y., & Mao, R. (2004). Mining frequent patterns without candidate generation: A frequent-pattern tree approach. Data Mining and Knowledge Discovery, 8, 53-87.
[18]Zhang, L., Wang, M., Zhai, Z., & Wang, G. (2014). Mining frequent closed patterns using sample-growth in resource effectiveness data. Journal of Software, 9(5), 1150-1158.
[19]Liu, J., & Wang, X. (2008). An improved C4.5 algorithm and experiment analysis. Computer Applications and Software, 9, 260-262.
[20]Paul, W., Dirk, V., & Dennis, P. (2004). Average-case performance of the Apriori algorithm. SIAM Journal on Computing, 33(5), 1223-1260.
[21]Quinlan, J. R. (1993). C4.5: Programs for Machine Learning. Burlington: Morgan Kaufmann Publishers. [22]Leung, Y., & Li, D. Y. (2003). Maximal consistent block technique for rule acquisition in incomplete
information systems. Information Sciences, 153, 85-106.
[23]SPSS Tool. From http://www-01.ibm.com/ software/analytics/spss/ [24]TipDM Tool. From http://www.tipdm.com.cn/
[25]Agrawal, R., Imielinski, T., & Swami, A. (1993). Mining association rules between sets of items in large databases. Proceedings of the ACM SIGMOD Conference on Management of Data (pp. 207-216).
Aifeng Li is an engineer at Guangzhou University. She completed her master degree and bachelor degree at South China Normal University and Jiangxi Normal University in 2006 and 1999, respectively. Her research interests include data mining and data warehouse. She has published more than 10 refereed national and international journal papers in this area.
Kuai Liu is a senior engineer at Guangzhou University. She received her master degree from South China University of Technology in 2003. She is a director of Project Application Center at Guangzhou University. Her research interests include data mining and software engineering.