ISSN (Online): 2320-9364, ISSN (Print): 2320-9356
www.ijres.org Volume 7 Issue 2 Ser. I ǁ 2019 ǁ PP. 58-70
Evaluation of electric power Faults on11KV Distribution Network
in NigeriaUsing Electrical Transient Analyzer Program
Eluozor, A. C., Idoniboyeobu, D.C.,Braide, S. L.
Department of Electrical Engineering, Rivers State University, Nkpolu-Oroworukwo, Port Harcourt, Nigeria Corresponding Author: Eluozor
ABSTRACT
:-
The epileptic electricity power supply in Woji Village 11KV distribution network in Port Harcourt, Rivers State, Nigeria is never-ending following inadequate power distribution, human error fault, malfunctioning of power equipment and poor distribution infrastructure upgrade, etc. WojiVillage feeder is connected to Woji Injection substation. The Capacity, Voltage Ratio, Active Power, Reactive Power, Frequency, Power Factor, Complex Power, Transformer Percentage Loading, and Current Rating on each Transformerwere determined. The pre-upgrade and post-upgrade of the system was simulated using Electrical Transient analyser program (ETAP) software.Correction factor of 95% was usedfor the post-upgrade of the highly over loaded transformers in networksince it is verygood and economical for industrial purposes.Furthermore, 10Mvarcapacitor bank compensation was recommended for Woji Village 11KV distribution networkfor improved performance for the affected buses ( B-9, B-14, B-20, B-45) with optimal placement capacity of B-9=2100KVAR, B-14=2500KVAR, B-20=2200KVAR, B-45=2200KVAR respectively. In conclusion, Port Harcourt Electricity Distribution (PHED) should do proper upgrading of their facility in WojiVillage feeders or develop another injection substation for Woji, Port Harcourt, Nigeria, for proper distribution of electricity to its customers.An effective monitoring of the network through load flow analysis should be activated to ensure that the connected load on the network is always equal to the capacity of the installed distribution transformer, thus conforming to IEE regulation of deviation not exceeding ±10% of the nominal voltage.Keywords:-Capacitor bank, Complex Power, Pre-upgrade and Post-upgrade, Power world, System analysis --- --- Date of Submission: 02-08-2019 Date of acceptance:13-08-2019 --- ---
I.
INTRODUCTION
Fault can be as a result of human error or due to malfunctioning of the equipment, electrical fault means an accidental electrical connection made between an energized component and something at a different potential leading to a short circuit.Faults occur when there is short circuit between phases, or phase to ground faults leading to unintended opening of fuses or circuit breakers used for protection within a power distribution system (Akintola, 2017). According to Elmir, et al., 2016), Single to-earth fault may become double line-to-earth faults. The inefficiency of Port Harcourt Electricity Distribution Company (PHEDC) accounts for why power interruption exists in our society. It is a well-known fact that PHEDC power supply has not been reliable for many years now and even till date, according to Okorie, 2016. Replacement or repair of any faulty electrical component such as transformer usually takes time, sometimes hours or days and as such may lead to longer hours of service interruption to the consumers. The transformers are electrical devices used for energy transfer by electromagnetic induction between two or more circuits, like all electrical devices faults also happen in the transformers which cause failures (Shayan, et al., 2015).
This research work identified fault as a result of active power, reactive power, Power Factor, Complex Power, Transformer Percentage Loading and the current rating on each Transformers in Woji Village11KV distribution feeder.
II.
MATERIALS AND METHODS
Direct patrol and inspection of the distribution network, as well as personal visits to the injection substations for on the spot assessment of the state of equipment. Three years (2015-2017) transformer load readings were gotten from the Port Harcourt Electricity Distribution Company of Nigeria (PHEDN) in Rivers State. Newton-Raphson method was used to determine the active power, reactive power, power factor, complex power, transformer percentage loading and the current rating on each transformer in Woji Village 11KV distribution feeder and line impedance while Microsoft Excel was used to justify the current and Electrical Transient analyzer program (ETAP) was used for the simulation.
Description of Woji, 33/11KV Distribution Network
Woji Injection substation receives electricity supply from Port-Harcourt Mains (Z2), a garden city industrial Transmission station in Port-Harcourt Town and its capacity rating is 2x15MVA, 33/11KV which consists of one HV bus bars, two HV/MV transformers, two grounding transformers, one MV bus bars and two outgoing feeders (Woji Village Feeder and Woji Estate feeder), as shown in Figure 1 below, the distribution of electricity to the load centres within the network is through the respective 11KV feeders.
Figure 1: The Existing Network of Woji, 33/11KV Distribution Feeders
The 33 KV and 11 KV Woji, distribution networks in Rivers State are radial type system which is commonly used. It encompasses isolated feeders with, each feeder serving a given area, the circuits radiating out of the substation or source (Olusuyi, et al., 2014). Woji, distribution networks are large interconnected system with several buses and transformers connected through distribution lines, as shown in figure 2 below.
Figure 2: Post-Upgrade Single Line Diagram of Woji Village 11KV Network
There are links between HV/LV substations implemented by using link boxes. While some of these allow the maximum demand of the substation to be transferred, generally they are designed to assist maintenance and hence can only be used to transfer lower load levels. Modern LV fuse boards/cabinets have facilities for the connection of standby generation to assist maintenance and supply restoration following faults.
Current Data Collected on 33 KV Primary and Secondary Transformer in Woji Substation
The data used in this research work were collected from Port Harcourt Electricity Distribution Company (PHED) substations visited. The data collected includes; line impedance, bus voltage ratings, transformer data and transformer load readings:
Core 1=400/1A=10P10 Core 2=10P10 400-1A Core 3=10P10 400-1A
Calculation of Load Current in Woji Feeder
Power Triangle was used in analyzing the reactive power, apparent power and power factor.
Transformer load in SVA= 3IV (1)
Active power in watts or kW= 3IV cos θ (2)
Reactive power in VAR or kVAR= 3VI sin θ (3)
Apparent power in VA or kVA= kW2+ kVAR2 (4)
Power factor, cos θ = Active power
Apparent power = kW
kVA (5)
Complex power, S = P + JQ (6)
Current 𝐼 =𝑃(𝐾𝑉𝐴)
3𝐼𝑉 (7)
Where, I, represent Current. V, represent Voltage and 𝑐𝑜𝑠 𝜃 represent the power factor at primary and secondary of transformers respectively.
Using the above equation (1 -7) to determine the transformer connection in Delta/Star since the system, consists of 15MVA, 33/11KV transformer and a 200KVA, 33/0.415KV transformer to explain the above formula deductions.
(i) The 15MVA, 33/11KV transformer is connected in Delta/Star,
Equation (5) above was used in determining the primary and secondary current of the 15MVA, 33/11KV transformer, we have
Power (P) in KVA = 3𝐼𝑉 (8)
Hence, 𝐼 =𝑃(𝐾𝑉𝐴)
3𝐼𝑉
Primary Load current𝐼𝑝= 𝑃(𝐾𝑉𝐴)
3𝐼𝑉 (9)
While,
Secondary load current 𝐼𝑠= 𝑃(𝐾𝑉𝐴 )
3𝐼𝑉 (10)
(ii) 200KVA, 33/0.415KV Transformer
Equation (9 and 10) above was used in determining the primary and secondary current of the 200KVA, 33/0.415KV transformer, we have
Primary Load current𝐼𝑝= 𝑃(𝐾𝑉𝐴)
3𝐼𝑉
While,
Secondary load current 𝐼𝑠= 𝑃(𝐾𝑉𝐴 )
3𝐼𝑉
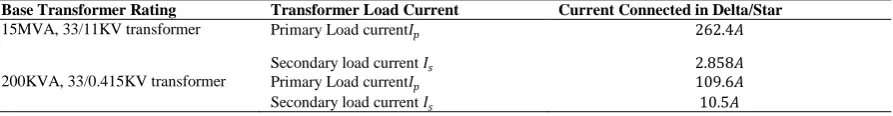
Table 1 below, shows the 15MVA, 33/11KV transformer load current rating in the primary and the load current rating on 200KVA, 33/0.415KV secondary transformer in Woji Substation.
The Table 1: The Transformer Load Current Rating in the Primary and Secondary Transformer in Woji Injection Substation (Source: Port-Harcourt Electricty Distribution Company)
Base Transformer Rating Transformer Load Current Current Connected in Delta/Star 15MVA, 33/11KV transformer Primary Load current𝐼𝑝 262.4𝐴
Secondary load current 𝐼𝑠 2.858𝐴
200KVA, 33/0.415KV transformer Primary Load current𝐼𝑝 109.6𝐴
Secondary load current 𝐼𝑠 10.5𝐴
CT Ratio on the Secondary Side of 15 MVA Transformer in Woji Substation Product Of 𝐶. 𝑇 = 𝐴𝑏𝑏 400: 5
C.T ratio = 400: 5
(i) C.T Ratio for the H.V side of the Transformer = 400: 1𝐴
Equation (7) above was used in determining the primary and secondary current of the 15MVA, 33/11KV transformer, we have
Secondary full load current 𝐼 =𝑃(𝐾𝑉𝐴)
3𝐼𝑉
Name plate reading = 789𝐴
Secondary full load current in primary 𝐶. 𝑇 = 262 .4∗1
400 = 0.656𝐴
Secondary full load in secondary 𝐶. 𝑇 = 787 .3∗5
On the low voltage side of the main transformer winding are connected in star, so equation (8) below was used in determining the phase voltage, we have
𝑃ℎ𝑎𝑠𝑒𝑣𝑜𝑙𝑡𝑎𝑔𝑒 = 𝑙𝑖𝑛𝑒𝑣𝑜𝑙𝑡𝑎𝑔𝑒
3 (11)
𝑃ℎ𝑎𝑠𝑒𝑣𝑜𝑙𝑡𝑎𝑔𝑒 = 11
3 = 6.351𝐾𝑉
On the high voltage side of the transformer, the main transformer windings are connected in Delta, hence
𝑃ℎ𝑎𝑠𝑒𝑣𝑜𝑙𝑡𝑎𝑔𝑒 = 𝑙𝑖𝑛𝑒𝑣𝑜𝑙𝑡𝑎𝑔𝑒 = 33𝐾𝑉
Current transformer on 11KV side are connected in delta and the turn ratio = 400/5 = 80
Distribution Line Parameters in Woji Injection Substation Feeders Resistance of line per kilometer
𝑅𝑜 =
𝜌ℓ
𝐴Ω/km (12)
Where;
Is the resistivity of aluminum = 2.65 × 10⁻⁸Ωm
A = Area of conductor
Reactance of line per kilometer
𝑋𝑜= 0.1445𝑙𝑜𝑔10
𝐷𝐺𝑀𝐷
𝑟 + 0.0157
𝑛 Ω/𝑘𝑚 (13)
Where n=3 (number of phases on the line)
𝐺𝑀𝐷 = 𝐷3 𝑎𝑎× 𝐷𝑎𝑏 × 𝐷𝑎𝑐 = 1.26𝐷
(14)
𝑟 = 𝐴
𝜋 (15)
Where:
A, represent the conductor cross sectional area of the aluminium conductor steel reinforced with galvanized, (A = 182mm2ACSR/GZ). GMD, represent the geometric mean distance of conductor in m. 𝑟 represent the radius of conductor in metre (m). While 𝐷 is the distance between adjacent conductor (D=0.88m).
Impedance of line per kilometer
𝑍𝑜 = 𝑅𝑜+ 𝐽𝑋𝑜 (16)
Admittance of line per kilometer
𝑌𝑜= 𝐺𝑜+ 𝐽𝐵𝑜 (17)
Where; 𝐺𝑜 represent the conductance of the line in Siemens while 𝐵𝑜 is the susceptance of the line in Siemens.
Determination of Distribution Line parameters in Woji Village Feeder Data on Woji Village Feeder:
L = 9.88km (the route length of Woji Village feeder), converting the value to metre, we have L = 9.88 × 10³m, while A = 150mm2 (cross sectional area of Woji Village feeder),
A = 150 × 106m2 and = 2.8 ×10⁸ohm/m
Equation (12) above was used in Calculating the value of the resistance of WojiVillageFeeder, we have
𝑅 =𝜌𝐿
𝐴
Equation (13) above was used in calculating for per kilometre inductive reactance X of the Woji Village feeder, we have;
𝑋𝑜= 0.1445𝑙𝑜𝑔10
𝐷𝐺𝑀𝐷
𝑟 +
0.0157 𝑛
Note that
𝐷𝐺𝑀𝐷 = 1.26D, and the value of 𝐷 = 880mm, 𝐷 = 0.88m (horizontal space)
Since 𝐷𝐺𝑀𝐷= 1.26D, hence the value of D above was used to determine the geometric mean distance of
conductor, has shown below
𝐷𝐺𝑀𝐷 = 1.26D, then 𝐷𝐺𝑀𝐷 = 1.26 × 0.88 = 1.108m
Equation (15) above was used in ccalculating the radius of the conductor, we have
𝑟 = 𝐴
𝜋
Calculating for per kilometre inductive reactance X of the Woji Village feeder, using equation (13), we have
2
200
mm
𝑋𝑜= 0.1445 𝑙𝑜𝑔10
1.108
0.0069+
0.0157
𝑛 Ω/𝑘
Multiplying the route length of Woji Village feeder with the inductive reactance of the WojiVillage feeder, we have
𝑋𝑜= 0.3239Ω/𝑘𝑚 × 9.88𝑘𝑚
Equation (16) above was used to determine for the impedance of the Woji Village feeder, we have
𝑍𝑜 = 𝑅𝑜+ 𝐽𝑋𝑜
Equation (18) below was used in calculating the per kilometre capacitive susceptance B, we have
𝐵 = 7.5
𝑙𝑜𝑔10 𝐷 𝐺𝑀𝐷𝑟
× 10−6 (18)
Multiplying the route length of Woji Village feeder with the capacitive susceptance of the WojiVillage feeder, we have
𝐵 = 3.4 × 10⁻⁶Ω/𝑘𝑚 × 9.88𝑘𝑚
Using equation (17) above to determine the admittance (𝑌𝑜) of Woji Village feeder, we have
𝑌𝑜= 𝐺𝑜+ 𝐽𝐵𝑜
Determination of Overloaded Transformers on Woji Feeders
The apparent power performance index is used to determine the percentage loading of transformers in the network. Based on the principle of loading of distribution transformers being 60% on rating for design purpose, transformers with loadings in excess of this figure are considered overloaded.
%𝐿𝑜𝑎𝑑𝑖𝑛𝑔 = 𝑆𝑀𝑉𝐴
𝑆𝑀𝐴𝑋
𝑁𝑇
𝑖=1 × 100 (19)
Where;
𝑆𝑀𝐴𝑋Represent the MVA rating of the transformer
𝑆𝑀𝑉𝐴Represent the operating MVA from power flow calculation
𝑁𝑇Represent the number of transformers
Table 2 below, shows the transformer current reading in Woji Village.
Table 2: The Location of Transformers and its rating on 11KV Feeder in Woji Village (Source: Port-Harcourt Electricity Distribution Company)
LOAD READING FOR WOJI VILLAGE 11KV FEEDER
LOAD READING (Amps)
S/N NAME, CAPACITY AND VOLTAGE RATIO R Y B N 1 WOJI HEALTH CENTER, 300KVA, 11/0.415KV 234 217 301 36 2 PEACE VALLEY, 500KVA, 11/0.415KV 325 276 309 97 3 ONU OKOLO, 500KVA, 11/0.415KV 281 278 289 78 4 GOLDEN VALLEY, 500KVA, 11/0.415KV 231 178 276 67 5 KING SOLOMON EST., 500KVA, 11/0.415KV 267 256 289 71 6 UNITY ROAD, 500KVA, 11/0.415KV 231 278 273 99 7 POST OFFICE, 500KVA, 11/0.415KV 342 367 401 123 8 DENISE UFOT, 300KVA, 11/0.415KV 267 231 267 129 9 MAJOR OBI, 500KVA, 11/0.415KV 231 342 245 38 10 FAITH AVENUE S/S I, 500KVA, 11/0.415KV 231 215 230 40 11 FAITH AVENUE S/S II, 300KVA, 11/0.415KV 134 201 198 78 12 FAITH AVENUE S/S III, 300KVA, 11/0.415KV 235 255 321 32 13 CREEK VIEW, 500KVA, 11/0.415KV 231 198 241 68 14 WOJI NEW LAYOUT, 500KVA, 11/0.415KV 186 203 187 126 15 ELITOR S/S III, 500KVA, 11/0.415KV 234 198 213 42 16 ENDLESS S/S, 500KVA, 11/0.415KV 198 245 278 167 17 JERRY LANE, 500KVA, 11/0.415KV 189 267 261 121 18 WOJI STREET S/S I, 500KVA, 11/0.415KV 195 245 231 68 19 WOJI STREET S/S II, 500KVA, 11/0.415KV 324 271 287 131 20 AMADI ODUM, 500KVA, 11/0.415KV 325 289 267 213 21 PALACE STREET, 500KVA, 11/0.415KV 200 189 201 85
Determining each Transformer loading and its percentage load in Woji Village 11KV Feeder. The loading reading data collected in table 3.4 above on each transformer in Woji Village
Feeder was determined as follows,
1. Woji Health Center, 300KVA, 11/0.415KV
Equation (7) with the load reading data collected in table 2 above, was used in calculatingthe total current that flows through this transformer, we have
Current, 𝐼 =𝐶𝑢𝑟𝑟𝑒𝑛𝑡𝑙𝑜𝑎𝑑𝑟𝑒𝑎𝑑𝑖𝑛𝑔
3 =
234 +217 +301 +36
3 =
788
Equation (1) above was used in calculating transformer-loading SVA:
𝑆𝑉𝐴 = 3 × 𝑉 × 𝐼 = 3 × 0.415 × 263 = 1.7320 × 0.415 × 263 = 189KVA
Since 60% rating was used for design purpose, calculating for overloaded transformer using equation (1) above, we have% 𝑙𝑜𝑎𝑑𝑖𝑛𝑔 = 𝑆𝑉𝐴
𝑆𝑀𝐴𝑋 × 100% =
188 .81
300 × 100% = 63%
Equation (3) above was used in calculating for the reactive power (kVAR), we have The reactive power, kVAR= 3𝑉𝐼𝑠𝑖𝑛𝜃; Note that 3 × 𝑉 × 𝐼 = 189KVA,
Since𝑠𝑖𝑛𝜃 = 0.6; Hence, 𝑘𝑉𝐴𝑅 = 189 × 0.6 = 113.4KVAr
Equation (2) above was used in calculating for the active power (kW), we have The active power, 𝑘𝑊 = 3 × 𝑉 × 𝐼𝑐𝑜𝑠𝜙; Note that 3 × 𝑉 × 𝐼 = 189KVA, since 𝑐𝑜𝑠𝜙 = 0.8; Hence,𝑘𝑊 = 189 × 0.8 = 151.048 ≅ 151.2kW
Using equation (5) above in determining for the value of Complex power S, we have Complex power, S = kW + jkVAR = 151.2 + j113.4
Using equation (4) above in determining for the value of apparent power kVA, we have Apparent power in VA or kVA= kW2+ kVAR2= 151.22+ 113.42= 189kVA
Using equation (5) above in determining for the value of Power factor (cos θ), we have Power factor, cos θ = Active power
Apparent power = kW kVA =
151 .2
189 = 0.8
This same method was used in determining the active power, reactive power, frequency power factor, complex power and transformer percentage loading on each transformer in Woji Village 11kv Feeder.
III.
RESULTS AND DISCUSSION
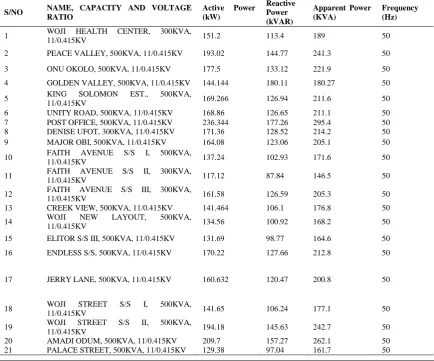
Result on Transformers in Woji Village 11KV FeederThe Active Power, Reactive Power, Frequency Power Factor, Complex Power and Transformer Percentage Loading on each Transformer in Woji Village 11KV Feeder that was determination in Chapter 3 was put into table 3a and b.
Table 3a: The Name, Capacity, Voltage Ratio, Active Power, Reactive Power andFrequency on each Transformer in Woji Village 11KV Feeder.
S/NO NAME, CAPACITY AND VOLTAGE RATIO
Active Power (kW)
Reactive Power (kVAR)
Apparent Power (KVA)
Frequency (Hz)
1 WOJI HEALTH CENTER, 300KVA,
11/0.415KV 151.2 113.4 189 50
2 PEACE VALLEY, 500KVA, 11/0.415KV 193.02 144.77 241.3 50
3 ONU OKOLO, 500KVA, 11/0.415KV 177.5 133.12 221.9 50
4 GOLDEN VALLEY, 500KVA, 11/0.415KV 144.144 180.11 180.27 50
5 KING SOLOMON EST., 500KVA,
11/0.415KV 169.266 126.94 211.6 50
6 UNITY ROAD, 500KVA, 11/0.415KV 168.86 126.65 211.1 50 7 POST OFFICE, 500KVA, 11/0.415KV 236.344 177.26 295.4 50 8 DENISE UFOT, 300KVA, 11/0.415KV 171.36 128.52 214.2 50 9 MAJOR OBI, 500KVA, 11/0.415KV 164.08 123.06 205.1 50
10 FAITH 11/0.415KV AVENUE S/S I, 500KVA, 137.24 102.93 171.6 50
11 FAITH AVENUE S/S II, 300KVA,
11/0.415KV 117.12 87.84 146.5 50
12 FAITH AVENUE S/S III, 300KVA,
11/0.415KV 161.58 126.59 205.3 50
13 CREEK VIEW, 500KVA, 11/0.415KV 141.464 106.1 176.8 50
14 WOJI NEW LAYOUT, 500KVA,
11/0.415KV 134.56 100.92 168.2 50
15 ELITOR S/S III, 500KVA, 11/0.415KV 131.69 98.77 164.6 50
16 ENDLESS S/S, 500KVA, 11/0.415KV 170.22 127.66 212.8 50
17 JERRY LANE, 500KVA, 11/0.415KV 160.632 120.47 200.8 50
18 WOJI 11/0.415KV STREET S/S I, 500KVA, 141.65 106.24 177.1 50
19 WOJI STREET S/S II, 500KVA,
11/0.415KV 194.18 145.63 242.7 50
Table 3b: The Name, Capacity, Voltage Ratio, Power Factor, Complex Power, Transformer Percentage Loading and Current Rating on each Transformer in Woji Village 11KV Feeder
S/NO NAME, CAPACITY AND VOLTAGE RATIO
Power factor Cos Ø
Complex power S
Transformer %Loading
Current (A) Rating
1 WOJI HEALTH CENTER, 300KVA, 11/0.415KV 0.8 151.2 + j113.4 63% 263
2 PEACE VALLEY, 500KVA,
11/0.415KV 0.8 193.02 + j144.77 48% 336 3 ONU OKOLO, 500KVA, 11/0.415KV 0.8 177.5 + j133.12 44% 308.67
4 GOLDEN VALLEY, 500KVA,
11/0.415KV 0.8 144.14 + j180.11 36% 250.67
5 KING SOLOMON EST., 500KVA,
11/0.415KV 0.8 169.26 + j126.65 42% 2943 6 UNITY ROAD, 500KVA, 11/0.415KV 0.8 168.86 + j126.65 42% 293.67 7 POST OFFICE, 500KVA, 11/0.415KV 0.8 236.34 + j177.26 59% 411 8 DENISE UFOT, 300KVA, 11/0.415KV 0.8 171.36 + j128.52 43% 298 9 MAJOR OBI, 500KVA, 11/0.415KV 0.8 164.08 + j123.06 41% 285.33
10 FAITH AVENUE S/S I, 500KVA,
11/0.415KV 0.8 137.24 + j102.93 34% 238.67
11 FAITH AVENUE S/S II, 300KVA,
11/0.415KV 0.8 117.12 + j87.84 49% 203.67 12 FAITH AVENUE S/S III, 300KVA,
11/0.415KV 0.8 161.58 +j126.59 67% 281 13 CREEK VIEW, 500KVA, 11/0.415KV 0.8 141.46 + j106.10 35% 246
14 WOJI NEW LAYOUT, 500KVA,
11/0.415KV 0.8 134.56 + j100.92 34% 234 15 ELITOR S/S III, 500KVA, 11/0.415KV 0.8 131.69 + j98.77 33% 229
16 ENDLESS S/S, 500KVA, 11/0.415KV 0.8 170.22 + j127.66 43% 296 17 JERRY LANE, 500KVA, 11/0.415KV 0.8 160.63 + j120.47 40% 279
18 WOJI STREET S/S I, 500KVA,
11/0.415KV 0.8 141.65 + j106.24 35% 246
19 WOJI STREET S/S II, 500KVA,
11/0.415KV 0.8 194.18 + j145.63 49% 37.67
20 AMADI ODUM, 500KVA,
11/0.415KV 0.8 209.7 + j157.27 52% 364.67 21 PALACE STREET, 500KVA,
11/0.415KV 0.8 129.38 + j97.04 32% 225
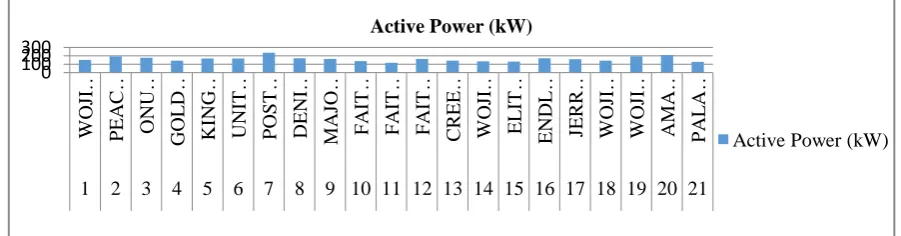
The result in Figure 3 shows that the active power (KW) on each Transformer in Woji Village 11KV Distribution Network, were in Table 3a, No. 7, the active power (KW) on transformer located at Post Office was very high while the active power on transformer located in Table 4.2, No. 11 (Faith Avenue S/S II) has the lowest.
Figure 3: The Active Power (KW) Chart on each Transformer in Woji Village 11KV Network
The result in Figure 4, shows that the reactive power (KVAR) on each Transformers in Woji Village 11KV Distribution Network, were in Table 3a, No. 4 above the active power (KW) on transformer located at Golden Valley was very high while the reactive power on transformer located in table 3a, No. 11 (Faith Avenue S/S II) has the lowest.
0 100 200 300
W
OJ
I …
P
EA
C
…
ONU
…
GOL
D
…
KI
NG
…
UNI
T
…
P
OST
…
DE
NI
…
MA
JO
…
FA
IT
…
FA
IT
…
FA
IT
…
C
R
E
E
…
W
OJ
I …
E
L
IT
…
E
NDL
…
JE
R
R
…
W
OJ
I …
W
OJ
I …
A
MA
…
P
A
L
A
…
1 2 3 4 5 6 7 8 9 10 11 12 13 14 15 16 17 18 19 20 21 Active Power (kW)
Figure 4: The Reactive Power (KVAR) Chart on each Transformer in Woji Village 11KV Network The result in Figure 5 shows that the apparent power (KVAR) on each Transformer in Woji Village 11KV Distribution Network, were in Table 3a, No. 7 above the apparent power (KW) on transformer located at Post Office was very high while the apparent power on transformer located in Table 3a, No. 11 (Faith Avenue S/S II) has the lowest.
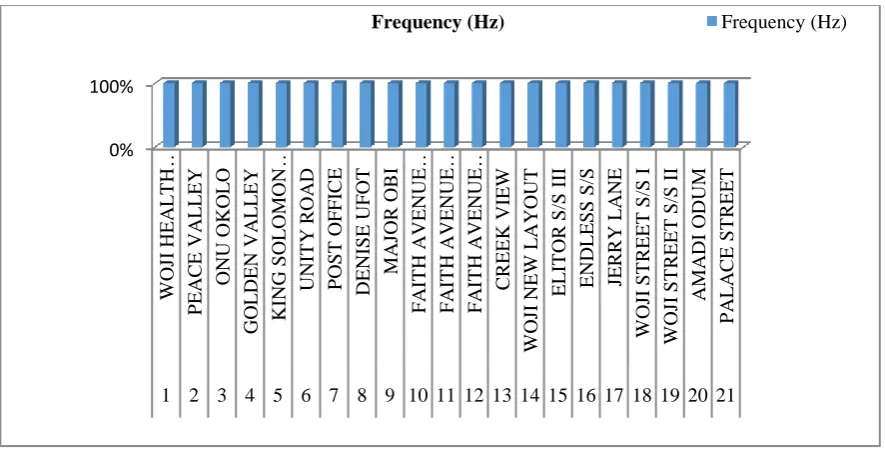
Figure 5: The Apparent Power (KVA) Chart on each Transformer in Woji Village 11KV Network The result in Figure 6, shows that the Frequency (HZ) on each Transformer in Woji Village 11KV Distribution Network, which is gotten from Table 3a were all equal.
Figure 6: The Frequency (Hz) Chart on each Transformer in Woji Village 11KV Network
The result in Figure 7 shows that, the Power Factor (Cos Ø)on each Transformer in Woji Village 11KV Distribution Network, which is gotten from Table 3b were all equal.
0 100 200 W OJ I … P E A … ONU … GOL … KI N … UNI T … P OST … DE NI … MA J… FA IT … FA IT … FA IT … CRE … W OJ I … E L IT … E ND … JE R R … W OJ I … W OJ I … A MA … P A L …
1 2 3 4 5 6 7 8 9101112131415161718192021 Reactive Power (kVAR)
Reactive Power (kVAR)
0 500 W O JI … P EA C E … O N U O K O L O G O L D EN … K IN G … U N IT Y R O A D P O S T O F F IC E D EN IS E U F O T M A JO R O BI F A IT H … F A IT H … F A IT H … C R EEK V IEW W O JI N EW … EL IT O R S /S I II EN D L ESS S /S JER R Y L A N E W O JI … W O JI … A M A D I O D U M P A L A C E …
Apparent Power (KVA)
Apparent Power (KVA)
0% 100% W OJ I HE A L T H … P E A C E VA L L E Y ONU OKOL O GOL DE N VA L L E Y KI NG SOL OM ON … UNI T Y R OA D P OST OFFICE DE NI SE UFOT MA JOR OB I FA IT H A VE NUE … FA IT H A VE NUE … FA IT H A VE NUE … C R E E K VI E W W OJ I NE W L A YOUT E L IT OR S/S I II E NDL E SS S/S JE R R Y L A NE W OJ I ST R E E T S/S I W OJ I S T R EE T S /S I I A MA DI ODUM P A L A C E ST R E E T
1 2 3 4 5 6 7 8 9 10 11 12 13 14 15 16 17 18 19 20 21
Figure 7: The Power Factor Chart on each Transformer in Woji Village 11KV Network
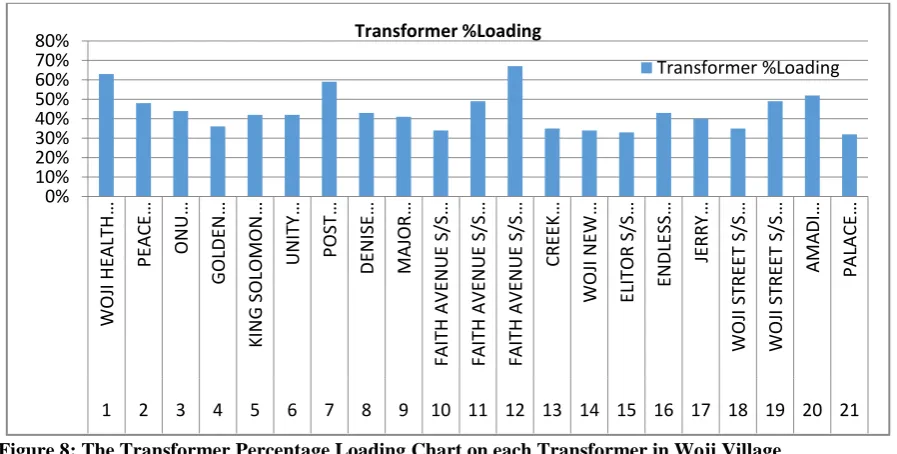
The result in Figure 8 shows that the transformer percentage loading in table 3b, No. 1, Faith Avenue S/S III and andWoji Health Center has 67% and 63% transformer loadings respectively, representing the highest transformer percentage loading on the network. While the transformer on Post Office Street has 59% and the one at AmadiOdumis52% showing that the transformers are high, while the transformer loading of Palace Street has 32%, representing the lowest transformer percentage loading on the network.
Figure 8: The Transformer Percentage Loading Chart on each Transformer in Woji Village 11KVDistribution Network
The result in Figure 9represents the current (A) rating on each Transformer in Woji Village 11KV distribution network in table 3b, No. 5, which shows that the current (A) rating on the transformer in King Solomon EST, was very high, while the current (A) rating on Woji Street S/S II, was the lowest in Woji Village 11KV Feeder. 0 0.1 0.2 0.3 0.4 0.5 0.6 0.7 0.8 0.9 W OJ I HE A L T H … P E A C E VA L L E Y ONU OKOL O GOL DE N VA L L E Y KI NG SOL OM ON E ST . UNI T Y R OA D P OST OFFICE DE NI SE UFOT MA JOR OB I FA IT H A VE NUE S/S I FA IT H A VE NUE S/S I I FA IT H A VE NUE S/S … C R E E K VI E W W OJ I NE W L A YOUT EL IT OR S /S I II E NDL E SS S/S JER R Y L A NE W OJ I ST R E E T S/S I W OJ I S T R EE T S /S I I A MA DI ODUM P A L A C E S T R EE T
1 2 3 4 5 6 7 8 9 10 11 12 13 14 15 16 17 18 19 20 21 Power factor Cos Ø
Power factor Cos Ø
0% 10% 20% 30% 40% 50% 60% 70% 80% WOJ I H EALT H … PE AC E … ON U … G OLDE N … KIN G SOLOMON … U N IT Y … POST … DE N ISE … MAJ OR … FAIT H AVE N U E S/S … FA IT H AV EN U E S/S … FAIT H AVE N U E S/S … CR EE K … WOJ I N EW … ELITOR S/S … EN DLE SS … JE RR Y … WOJ I ST RE ET S/S … WOJ I ST RE ET S/S … AMADI … PALACE …
1 2 3 4 5 6 7 8 9 10 11 12 13 14 15 16 17 18 19 20 21
Transformer %Loading
Figure 9: The Current (A) Rating on each Transformer in Woji Village 11KV Distribution Network The Determination of Post Upgrade Bus Voltage Operating Condition for Woji Village Feeder
The result in Figure 10 represents the post-upgrade of each transformer in Woji Village 11KV distribution network, which was corrected using 10 MVAR capacitor bank.
Figure 10: The Post Upgrade of each transformer in Woji Village 11KV distribution network.
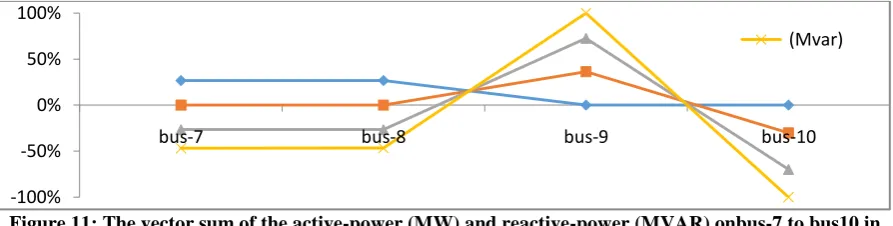
The result in Figure 11 indicates that the highest value of 0.278MW load flow was on 9 while bus-10 was the least with the value of -0.446MW load flow before introduction of capacitor; hence it became zero (0) after capacitor bank was introduced respectively. Bus-9 has the highest value of 0.21Mvar while bus-10 was the lowest (-0.338Mvar) before the introduction of capacitor bank. Hence, bus-9 became 0.278Mvar and bus-10 became -0.338 after capacitor bank was introduced respectively in 11KV Distribution Network of Woji Village.
Figure 11: The vector sum of the active-power (MW) and reactive-power (MVAR) onbus-7 to bus10 in 11KV Distribution Network of Woji Village.
The result in Figure 12 indicates that bus-14 has the highest value of 0.17MW load flow before capacitor bank was introduced; hence it became 0.2MW after capacitor bank was introduced to it. Bus-14 has the highest value of 0.2Mvar while point 5 was zero 0Mvar before and after capacitor bank was introduced. The values of bus-11, bus-12 and bus-13 were almost equal before and after capacitor bank correction was applied on it respectively in 11KV Distribution Network of Woji Village.
0 500 1000 1500 2000 2500 3000 3500
WOJ
I H
EALT
H
CE
N
TE
R
PE
AC
E
VALLE
Y
ON
U
OKOLO
G
OLDE
N
VALLE
Y
KIN
G
SOLOMON
E
ST
.
U
N
IT
Y ROAD
POST
O
FFIC
E
DE
N
ISE
U
FOT
MAJ
OR O
BI
FAIT
H
AVE
N
U
E S/S
I
FAIT
H
AVE
N
U
E S/S
II
FAIT
H
AVE
N
U
E S/S
III
CR
EE
K
VIE
W
WOJ
I N
EW
LAY
OUT
ELITOR S/S III EN
DLE
SS
S/S
JE
RRY
L
AN
E
WOJ
I ST
RE
ET
S/S I
WOJ
I ST
RE
ET
S/S II
AMADI O
DU
M
PALACE
ST
RE
ET
Current (A) Rating on each Transformers in Woji Village 11KV Feeder
Current (A) Rating
-100% -50% 0% 50% 100%
bus-7 bus-8 bus-9 bus-10
Figure 12: The Vector Sum of the Active-Power (MW) and Reactive-Power (MVAR) on Bus-11 toBus-14 in 11KV Distribution Network of Woji Village
The result in Figure 13 indicates that bus-15 was the least value (-0.205MW) of load flow while bus-16 was the highest (-0.117MW) before capacitor bank was introduced, hence it became 0.205MW and 0.104MW respectively after the introduction of capacitor bank. Bus-15 has the least value of -0.556Mvar while bus-17 was 0.089Mvar before capacitor bank was introduced. Hence, the vector sum of the reactive-power (MVAR) on bus-15 became 0.bus-154Mvar and bus-17 became 0.143Mvar after capacitor bank was introduced in 11KV Distribution Network of Woji Village.
Figure 13: The Vector Sum of the Active-Power (MW) and Reactive-Power (MVAR) on Bus-15 to Bus-18 in 11KV Distribution Network of Woji Village
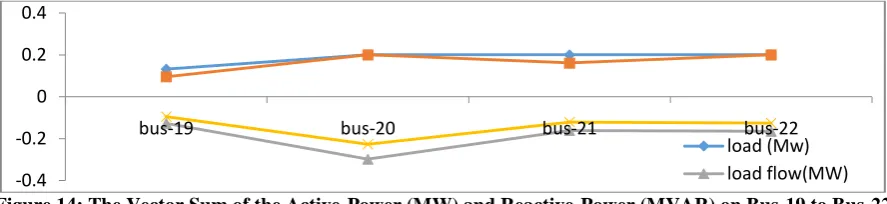
The result in Figure 14 indicates that bus-20 has the least value of -0.298MW load flow while bus-19 was the highest (-0.127MW) before capacitor bank was introduced, hence it became 0.2MW and 0.132MW after capacitor bank was introduced respectively. Bus19 has the highest value of 0.095Mvar while bus20 has -0.227Mvar value before capacitor bank was introduced. Hence, bus-19 became 0.095Mvar and bus-20 became 0.2Mvar after capacitor bank was introduced in 11KV Distribution Network of Woji Village.
Figure 14: The Vector Sum of the Active-Power (MW) and Reactive-Power (MVAR) on Bus-19 to Bus-22 in 11KV Distribution Network of Woji Village
The result in Figure 15 indicates that bus-24 has the highest value of -0.163MW load flow and bus-26 has the lowest value of -0.752 before capacitor bank was introduced, hence it became 0.2MW and 0.2MW after capacitor bank was introduced to it respectively. Bus-23 has the value of 0.121Mvar and point 5 became zero (0) before and after capacitor bank was introduced.
0% 20% 40% 60% 80% 100%
bus-11 bus-12 bus-13 bus-14
load flow(MW)
(Mvar)
load (Mw)
-1 -0.5 0 0.5
bus-15 bus-16 bus-17 bus-18
load (Mw)
-0.4 -0.2 0 0.2 0.4
bus-19 bus-20 bus-21 bus-22
Figure 15: The Vector Sum of the Active-Power (MW) and Reactive-Power (MVAR) on Bus-23 to Bus-26 in 11KV Distribution Network of Woji Village
The result in Figure 16 indicates that the percentage voltage magnitude on bus-9 was the highest with the value of 100.288%, while 7 and 8 has a stabilized voltage angle of -0.6 respectively. More so, Bus-9 and Bus -10 has a stabilized voltage angle of -0.3 respectively in 11KV Distribution Network of Woji Village.
Figure 16: The Percentage Voltage Magnitude and Voltage magnitude on Bus-7 to Bus-10 in 11KV Distribution Network of Woji Village
The result in Figure 17 indicates that the load current on bus-13 was the value of 295.5A before the upgrade, but it became 96.3A after the upgrade. Furthermore, the load current before capacitor bank introduction on bus-20, bus-23, bus-25, bus-26 and bus-29 was 19.7A, 28.6A, 30.2A, 49.5A and 40.9A respectively, but it increased to 105.6A, 284.9A, 101A, 95A and 97.2A respectively when capacitor bank was introduced in 11KV Distribution Network of Woji Village.
Figure 17: The Load Current before and after Capacitor Bank was Introduced on Bus-7 to Bus-30 in 11KV Distribution Network of Woji Village
V.
CONCLUSION
The epileptic electricity power supply in Woji Village 11KV distribution network in Port Harcourt, Rivers State, Nigeria is never-ending following inadequate power distribution, human error fault, malfunctioning of power equipment and poor distribution infrastructure upgrade, etc. The active power, reactive power, frequency, power factor, complex power and transformer percentage loading on each transformer allocated to WojiVillage 11KV distribution network was determine. The pre-upgrade and post-upgrade of the system was simulated using Electrical Transient analyzer program (ETAP) software, the pre-upgrade of each transformers in Woji Village, 11KV distribution network, indicate that the transformer at location in Woji Health Center has 63%, Post Office has59% while Faith Avenue has 67% representing the pre-upgrade transformer in the single line diagram, Woji Village 11KV Network.
The post-upgrade of Village Woji was corrected using capacitor bank. 10MVAR was recommended for Woji Village 11KV distribution network for improved performance for the affected buses (9, 14, 20, 45) with optimal placement capacity of 9=2100KVAR, 14=2500KVAR, 20=2200KVAR and B-45=2200KVAR respectively.I recommend that Port Harcourt Electricity Distribution (PHED) should do proper upgrading of their facility in WojiVillage feeders or develop another injection substation for Woji, Port Harcourt, Nigeria, for proper distribution of electricity to its customers. More so, an effective monitoring of the
-50% 0% 50% 100%
bus-23 bus-24 bus-25 bus-26
load flow(MW) load(Mvar)
-50% 0% 50% 100%
bus-7 bus-8 bus-9 bus-10
% voltage magnitude
voltage angle
0 200 400 600
bus
-7
bus
-8
bus
-9
bus
-10
bus
-11
bus
-12
bus
-13
bus
-14
bus
-15
bus
-16
bus
-17
bus
-18
bus
-19
bus
-20
bus
-21
bus
-22
bus
-23
bus
-24
bus
-25
bus
-26
bus
-27
bus
-28
bus
-29
bus
-30
www.ijres.org 70 | Page] network through load flow analysis should be activated to ensure that the connected load on the network is always equal to the capacity of the installed distribution transformer, thus conforming to IEE regulation of deviation not exceeding ±10% of the nominal voltage.
REFERENCES
[1]. Ahmad, S., Zakria, N. M., Elahi, A. -U., &Biswas, G. A. K. (2011). Contingency Analysis and Reliability Evaluation of Bangladesh Power System.Thesis Report, BRAC University, Dhaka, Bangladesh.
[2]. Bakar, A. H. A, Ng, Y. Y., & Tan, C. K. (2014).Analysis of Overload Conditions on Generator Loss of Excitation Relay under Severe Contingencies.AORC Technical meeting, C4-1013
[3]. A.O Balogun: Impact Sector Reforms on Nigeria Electricity, Conference proceedings of the International Conference and Exhibition in Power Systems, Nigeria, July 2007, pp 123-128.
[4]. C.C. Okoro and K.C Achugbu: Contingency Evaluation of the 330kV National Grid, Proceedings of the International Conference and Exhibition in Power Systems, Lagos, Nigeria, July 2007, pp 137-146.
[5]. Transmission Company of Nigeria: Grid Network for the Evacuation of the Proposed 10, 000MW Power Generation, 2003. [6]. Archive of Course Presentation on Power System Design and Protection: Grid Distant Protection Training Course Organized by
ENERGO Nigeria Limited for PHCN Staff, 2004.
[7]. KPMG Handbook. (2013, December).A guide to Nigeria power sector.
[8]. Izuegbunam, F. I., Duruibe, S. I., &Ojukwu, G. G., (2011). Power flow and Contingency Assessment Simulation of the expanding 330KV Nigeria Grid Using Power World Simulator.Journal of Emerging Trends in Engineering and Applied Sciences (JETEAS) 2(6), 1002-1008.
[9]. Nonyelu, C. J., &Madueme, T. C. (2013). Power System Contingency Analysis: A Study of Nigeria’s 330KV Transmission Grid. In proceeding of Energy Source for Power Generation, At Electrical Engineering, University of Nigeria, Nsukka, (Volume4). [10]. Sadiq, A.A.; and Nwohu, M.N.2013. Evaluation of inter-area available transfer capacity of Nigeria 330kv network international
journal of Engineering and Technology 3(2): 148-58.