Abstract
Exchanges are market places for trading financial instruments like equities, bonds, commodities, currencies and other derivative instruments. Indian Exchange landscape has evolved over the years from 'only equity' into an inclusive blend of asset classes (Commodities, Bonds, Currencies, Power, and Interest Rates etc). Exchanges have become demutualized and fully electronic entities. This paper describes the present state of Indian exchanges. Varied asset classes - commodities, currencies, equities are analyzed in the context of their market places in India. Indian Exchanges have caught the eye of global players. Exchanges like NSE, BSE, MCX have attracted investment from foreign entities. This paper attempts to analyze the evolution cycle of exchanges-electronic, demutualization, listing and consolidation. We explore the exchanges in India and the underlying markets.
Keywords : Exchanges, Demutualization, Asset Classes, NSE, BSE, MCX
1. Introduction
Stock Exchanges play a vital role in economic development of a country. Exchanges, primarily demutualised companies and implementers of national economic policy and company law have been compared to "news papers, national airlines, large broadcasters, major automobile companies, oil companies and major commercial and investment banks" in terms of their "sustained institutional prominence in the lives of nations" according to 'Focus', by the world federation of exchanges(WFE). Around the world, exchanges are demutualizing, becoming publicly owned , consolidating and forming power blocks in the international and regional arena. The global market capitalization reached USD 64 trillion(+17%) and Value of share trading reached USD 55 trillion (+12%) in 2013.
* PhD Research Scholar, Acharya Nagarjuna University, G untur, Andhra Prades h- 522510. E-mail : [email protected]
** HoD, Dept.Of Commerce and Buss.Admn, Acharya Nagarjuna University
Exchanges in India: A Perspective
In India, Capital markets are playing an increasingly important role, with the stock exchanges acting as their fulcrum. Stock Exchange as an institution has long history in India dating back 100 years ago. Over the years, price discovery has become more efficient, transactions have become faster, safer and cheaper, number of investors has risen and markets have become globalized. Indian markets have become larger, deeper, diversified and more modernized.
Global Exchanges
The following table depicts largest domestic equity market capitalization at year-end 2013.
Table 1 : Largest domestic equity market capitalizations at year-end 2013
USD billion USD billion %Change Exchange end-2013 end -2012 in USD
1. NYSE Euronext (US) 17950 14086 27%
2. NASDAQ OMX (US) 6085 4582 33%
3. Japan Exchange Group 4543 3681 23%
4. London Stock Exchange 4429 3397 30%
5. NYSE Euronext (Europe) 3584 2832 27%
6. Hong Kong Exchanges 3101 2832 9%
7. Shanghai SE 2497 2547 -2%
8. TMX Group 2114 2059 3%
9. Deutsche Borse 1936 1486 30%
10. SIX Swiss Exchange 1541 1233 25%
Table 2 : Top Ten Exchanges By No of Transactions (measured in Millions)
Exchange 2012 2012 2013 2013 Change(%) Transactions Rank Transactions Rank
1. NSE India 1407 1 1449 1 3.04 2. NYSE Euronext 1375 2 1188 3 -13.59 3. NASDAQ OMX 1268 3 1151 5 -9.17 4. Korea Exchange 1219 4 1032 6 -15.38 5. Shenzen SE 936 5 1289 2 37.82 6. Shanghai SE 926 6 1153 4 24.61 7. BSE India 356 7 345 8 -3.07 8. Tokyo 350 8 599 7 71.39 Exchange
9. London 222 9 211 10 -4.87 10.TMX Group 216 10 235 9 9.15
Source: www.ajayshahblog.blogspot.com
NSE was # 1 in the world in both 2012 and 2013 in number of Transactions.
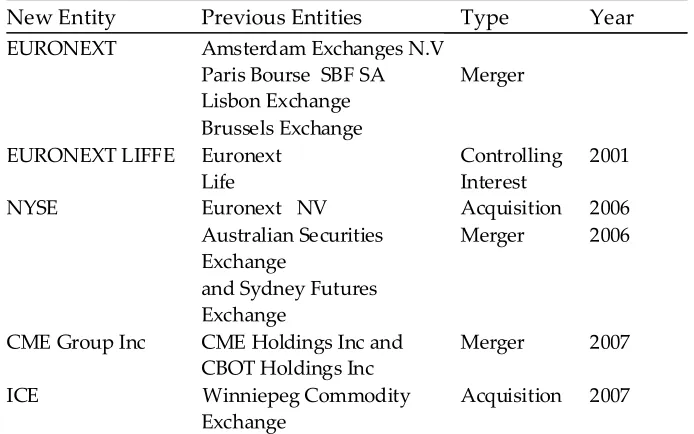
Consolidation and Cross-border linkages among Exchanges
Table 3 : Some Examples of Consolidation, cross-border linkages & partnerships
New Entity Previous Entities Type Year
EURONEXT Amsterdam Exchanges N.V Paris Bourse SBF SA Merger Lisbon Exchange
Brussels Exchange
EURONEXT LIFFE Euronext Controlling 2001 Life Interest NYSE Euronext NV Acquisition 2006
Australian Securities Merger 2006 Exchange
and Sydney Futures Exchange
CME Group Inc CME Holdings Inc and Merger 2007 CBOT Holdings Inc
ICE Winniepeg Commodity Acquisition 2007 Exchange
Exchange have all become publicly traded, for-profit exchanges in the last decade.The competition among global exchanges has resulted in linkages and partnerships between national and international exchanges.
2. Literature Review
There are extensive studies, reports and books available on Indian Exchanges & trading practices. We have reviewed some recently published literature pertaining to Trading & Exchanges in India.
Shah, etal (2008) in the book titled " India's Financial Markets" observes that the public equity market within India, both spot and derivatives, takes place almost entirely at the two exchanges - NSE and BSE. There is an open electronic limit order book (ELOB) with order matching by the trading computer. The author reports that the processes of organized financial trading in India have focused on Exchanges. According to the author, SEBI needs to take a larger view of the business of organized financial trading, which needs to evolve into a three-tier system: a) Exchanges patronized by the public b) professional exchanges c) OTC Trading.
Lee(2002) in the paper titled " The future of securities exchanges" presents a range of predictions about securities exchanges. The author analyzes that historically,exchanges have had seven main types of revenues :1) Membership subscription, fees for 2) Listing, 3) Trading 4) Clearing and 5) Settlement and charges for the provision of 6) Company news and for 7) quote and trade data. In the paper four broad themes related to securities exchanges are discussed concerning information, industry, governance and politics. The following ten predictions are made by the author in his paper : 1)securities exchanges will become media companies 2) there will be many years of legal and regulatory battles over whether exchanges on their quote and trade data 3) only if a market wide consenses is reached , will such battles stop . 4) marginal cost pricing for information dissemination will be neither sustainable or optimal 5) a few exchanges will dominate trading 6) most exchanges linkages will fail unless they lead to a merger or acquisition 7) vertical integration by securities exchanges into clearing will lead to anti competitive behavior 8) demutualization will be neither necessary nor sufficient for the prosperity, or even survival of security exchanges 9) demutualized exchanges will require regulation than mutual exchanges - not because of the difficulties of self regulation, but rather due to likely anti competitive behavior 10) political intervention in securities exchanges activities will grow.
unreformed equity market microstructure. The author argues that India eventually adopted many latest innovations, leapfrogging from archaic market institutions and practices in the early 1990s to international best practices at the beginning of new millennium. The paper further elucidates that by 2001,reforms brought India upto par with the global standards for every aspect of its equity market microstructure. The paper argues that technological change in the form of electronic trading systems and the development of new financial products created substantial opportunity costs to maintaining status quo. According to the author, the NSE developed important institutional innovations for clearing and risk management.
Report on Indian Exchanges (2009) by IDFC research describes that transparency, annuity revenues , high operating leverage and solid entry barriers make exchanges a near-perfect business. The report further argues that Indian Exchanges are almost on par with global peers in terms of corporate structure and sophistication of systems, Indian Exchanges are gathering scale. As elucidated in the report exchanges have been around for centuries ,but the business model continues to strengthen with the industry increasingly gaining depth.
Draft Red Herring Prospectus of MCX(2011) submitted to SEBI states there are over 30 commodity futures and options exchanges worldwide that trade commodities ranging from energy ,metals, agriculture to livestock in many countries including the United States, China,Japan and Malaysia and the UK. The report opines that the recent trend in global futures and options may be attributable to the following factors: 1) impressive growth of the Asian Exchanges especially in India and China 2) Emergence and acceptance of new products offered by the exchanges 3) increasing awareness of the importance of risk management. The report further describes the technological advances and migration to fully electronic trading markets. The major trends observed are a)decentralization b) Algorithmic trading c) Direct Market Access d) Co-location facility e) Move to commercially oriented business practices at exchanges and consolidations.
Annual Report (2013) of Futures Market Commission reports that out of 19 recognised commodity exchanges, MCX Mumbai, NCDEX Mumbai, NMCE Ahemdabad, ACE Derivatives and Commodity Exchange Mumbai, Indian Commodity Exchange Mumbai contributed 99.71% of the total value of commodities traded during 2012-13.
Indian Securities Market. India holds a significant place in the arena of world derivatives markets. Currently, India's NSE,MCX group and BSE were found to be among the top 30 derivative exchanges when positioned by the number of contracts traded and/or cleared. The equity derivative markets have experienced shifts in the product shares in the recent years. Till 2006-07, single stock futures were the most traded product in India. During 2012-13, the largest share in the total derivatives turnover has been contributed by index options with 77%. Share of single stock futures have declined substantially over the years and now constitute a mere 10.9% in 2012-13. The report elucidates on currency derivatives market regarding the currency derivatives exchanges NSE, MCX-SX,USE.The product-wise share in currency derivatives volume shows that USD-INR futures dominated with 76.4% followed by USD-INR options (20.2%).
3. Objectives of the Study
3.1 To analyze the evolution cycle of Exchanges in India.
3.2 To describe the business model of Indian Exchanges
4.
Exchanges in India
Key Stages of Evolution Cycle
Indian Exchanges are able to compress the evolution cycle and fast track into transforming from mutually-owned market places to demutualised, fully-electronic ones. Global Exchanges have evolved from being member-owned entities into publicly listed commercial business houses. Extant literature identifies four key stages of the evolution cycle - electronization, demutualization, listing and consolidation.
Electronic Demutualization Listing Consolidation Commodity Exchanges in India
Commodity Derivatives Market in India has a very long history though chequered and filled with intermittinent bans on futures trading. The market began in 1875 with the starting of Bombay Cotton Trade Association Ltd. Presently only commodity futures are traded in India's Commodity Exchanges. Commodity Futures are derivative products that are tools for fulfilling the objectives of price-discovery and risk management. India started moving towards having commodity futures trading in the late 1990s, after a long and turbulent history of commodity derivatives trading. Commodity futures market was liberalized in India in 2003. The main legal framework governing Commodity Derivatives Market in India is the Forward Contracts ( Regulation) Act 1952(FCRA).
Table 4: Commodity derivatives market in india: Transformation
2000 2013
Modern Exchanges Absent High ( 6 Multi-Commodity
National Exchanges)
Commodity Stakeholders Low High
Institutional Brokers Absent High
Banks Absent Low ( not allowed)
FIs Absent Low
FIIs Absent Absent(not allowed)
Companies Absent Medium
Independent Clearing Low High
Electronic Trading Absent High
Settlement Guarantee Fund Absent High
Usage of Warehouse receipt Absent High
Trading Volumes Low High
Products available for Trading Single
Commodity Multi Commodity
Governance of Exchanges Low High
Trading Localized National
Commodity Derivatives Market witnessed huge increase in volumes after reforms in trading, clearing and settlement processes and risk management. Price discovery has improved and hedging effectiveness of futures market had also risen considerably. The following table depicts the total traded volumes in India's commodity derivatives market.
Table 5: Volumes in India's Commodity Derivatives Market
Total Traded Volumes ( USD billion)
Market 2003 2008 2013
Commodity Derivatives 29 1019 3330 Of which
Agriculture 28(96%) 244(24%) 400(12%)
Non-Agriculture 1(4%) 775(76%) 2930(88%)
Equity Derivatives 92 3281 5793
Equity Spot 128 890 498
There continued to be government interventions on commodity futures trading. The following table lists the instances of suspended commodities between 2003 and 2014.
Table 6 : Suspension in commodity futures trading after 2003
Commodity Trading suspended on Suspension revoked
Tur, Urad 23rd Jan 2007
Suspension continues (86 months)
Rice 27th Feb 2007
Suspension continues (85 months)
Wheat 27th Feb 2007 14th May, 2009 (27 months)
Chana, Soya oil, 7th May 2008 30th Nov, 2008 (6 months)
Rubber, Potato
Sugar 26th May 2009 30th Sep, 2010 (16 months)
Guar seed and Guar gum 27th Mar 2012 10th May, 2013 (14 months)
Source: Committee to suggest steps for fulfilling the objectives of price discovery and risk management of commodity derivatives market, department of economic affairs,ministry of finance,government of India,
New Delhi (April,2014)
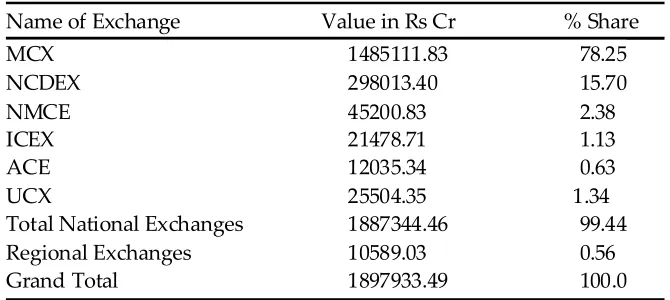
There are 17 commodity exchanages (6 National and 11 Regional Exchanges) regulating futures trading in commodities. The six national commodity exchanges contributed 99.44% to the total value of trade in the commodity futures market. These are MCX Mumbai (78.25%), NCDEX Mumbai (15.7%), NMCE Ahemdabad(2.38%), ICEX Mumbai(1.13%), ACE Mumbai (0.63%) and UCX Navi Mumbai (1.34%).
The following table indicates percentage share of exchanges in major commodity exchanges.
Table 7: Value of trade during Jan-mar 2014 in the major commodity exchanges
Name of Exchange Value in Rs Cr % Share
MCX 1485111.83 78.25
NCDEX 298013.40 15.70
NMCE 45200.83 2.38
ICEX 21478.71 1.13
ACE 12035.34 0.63
UCX 25504.35 1.34
Total National Exchanges 1887344.46 99.44
Regional Exchanges 10589.03 0.56
Grand Total 1897933.49 100.0
Equity Exchanges in India
Indian Equity Market had outdated practices in trading, clearing and settlement as of 1990. Stock Exchanges in India at that time had a doubtful reputation in their role as transparent price discovery mechanisms .Exchanges were run as self-regulating organizations (SROs),typically as brokers associations. Equity markets were fragmented across multiple regional exchanges, before economic reforms. After the reforms, NSE and BSE are only two stock exchanges for all practical purposes.
Table 8 : Market Share of Indian Equity Exchanges
Indian Equity Exchanges Market Share
NSE 83.96
BSE 16.03
MCX-SX Negligible
Source: SEBI Memorandum to the board ( Mar 2014- May 2014)
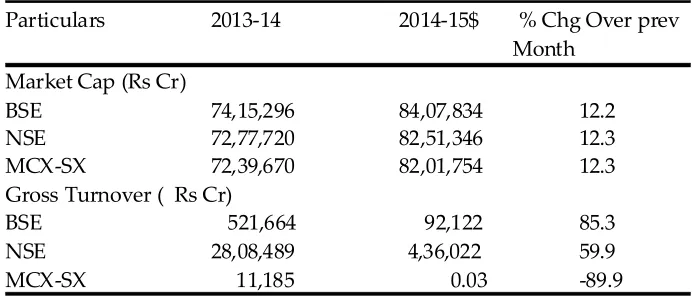
Table 9 : Basic Indicators in Cash Market
Particulars 2013-14 2014-15$ % Chg Over prev Month
Market Cap (Rs Cr)
BSE 74,15,296 84,07,834 12.2
NSE 72,77,720 82,51,346 12.3
MCX-SX 72,39,670 82,01,754 12.3
Gross Turnover ( Rs Cr)
BSE 521,664 92,122 85.3
NSE 28,08,489 4,36,022 59.9
MCX-SX 11,185 0.03 -89.9
Currency Exchanges
Trading in Exchange Traded Currency Derivatives ( ETCD) began in India in 2008.
Table 10 : Details of Currency Exchanges and their commencement of Operations
EXCHANGE Date of Operations
NSE Aug 29,2008
MCX-SX Oct 7,2008
BSE Oct 8,2008
USE Sept 20,2010
Table 11: Market Share of Currency Derivatives ( Oct-Dec 2013)
Exchange Market Share
NSE 61.59%
MCX-SX 29.98%
USE 6.64%
BSE 1.79%
Source : MCX -SX Market Update www.mcx-sx.com
5.
Findings and Conclusions
5.1 The global market capitalization reached USD 64 tn(+17%) and Value of share trading reached USD 55 tn (+12%) in 2013.
5.2 Four key stages of the evolution cycle - electronization, demutualization, listing and consolidation.
5.3 The six national commodity exchanges contributed 99.44% to the total value of trade in the commodity futures market. These are MCX Mumbai (78.25%), NCDEX Mumbai ( 15.7%),NMCE Ahemdabad (2.38%), ICEX Mumbai (1.13%), ACE Mumbai (0.63%) and UCX Navi Mumbai (1.34%).
5.4 Market Share of NSE, BSE and MCX-SX in equity segment is 83.96,16.03, negligible respectively.
5.5 Market Share of NSE, BSE, MCX-SX,USE in currency derivatives is 61.59, 29.98, 6.64, 1.79 respectively.
References
1. Ajay Shah, S. T. (2008). India's Financial Markets. Guragaon, India: Elsevier.
2. Department Of Economic Affairs. (April,2014). Report of the Committee to suggest steps for fulfilling the objectives of price-discovery and risk management. New Delhi: Minstry of Finance, Government of India.
3. FTKMC. (2013). The progressive growth of Indian Power market. Mumbai: www.iexindia.com.
4. IDFC-SSKI Research. (June 2009). Indian Exchanges. Mumbai: IDFC-SSKI Securities. 5. Jalan, B. (Nov 2010). Review of ownership and governance of market infrastructure
institutions. Mumbai: www.sebi.gov.in.
8. MINISTRY OF CONSUMER AFFAIRS. (2013). ANNUAL REPORT 2012-13. MUMBAI: GOVERNMENT OF INDIA, FORWARD MARKETS COMMISSION.
9. SEBI. (2014). Handbook of statistics on Indian securities market 2013. Mumbai: www.sebi.gov.in.
10. SEBI. (June 2014). Monthly Review of Financial markets. SEBI Bulletin .
11. SEBI. (2014). Status Report on the Developments in the Derivatives Market. Mumbai: www.sebi.gov.in.