An Analysis on Mercury (Hg) Metal Elements in
River Water Surrounding Gold Mines in North
Sumatra
Efbertias Sitorus Zul Alfian
PG Student Lecturer
Department of Mathematics and Natural Science Department of Mathematics and Natural Science
Universitas Sumatera Utara Universitas Sumatera Utara
Cut Fatimah Zuhra Lecturer
Department of Mathematics and Natural Science Universitas Sumatera Utara
Abstract
Heavy metal contamination has become a global problem, especially in the developing countries. The objective of this research was to analyze the content of mercury heavy metal in river water surrounding gold mines in North Sumatera. The samples of water were taken from twelve stations in the vicinity of gold mines in North Sumatera. Determining mercury in the water was done by using Atomic Absorption Spectroscopy (AAS). Pollution status was determined through the calculation of Hg ratio in water samples. The result of the research on the canal water indicated that Hg heavy metal value concentration was under the acceptable threshold according to the Decree of the Minister of Environment No. 115/2003 so that it can be used for its purpose based on SNI (6989.78: 2011). It is recommended that the people in North Sumatera who reside by the rivers use water often for their daily needs such as taking a bath, washing, fishing, and so on. The risk for health problems for the people who reside by rivers can occur when the polluting status of mercury water is affected by amalgamation process units.
Keywords: Gold Mine, Heavy Metal, Mercury, River Water
________________________________________________________________________________________________________
I. INTRODUCTION
The quality of water because industrial waste flows to the water which leads to the increase in metallic content in river water now becomes the problem since river water disperses to urban area [10][[22]. The damage of fresh water can be caused by industrial waste, mining waste, hospital waste, household waste, and urban waste, or by forming residue which is processed well [1][4]. The main environmental problem in many parts of the world is pollution of rivers, lakes, and seas caused by various kinds of chemical compound, including heavy metal, hydrophobic organic compound, and pathogenic organism which become a threat for river water resources throughout the world [14][21].
Side-effect on local environment and water resources occurred when there is mining activity and artisanal mineral exploitation so that they can cause dramatic metal contamination on water surface, sediment, soil, and biota [12]. Mining activities in so me parts of the world which not managed well can potentially bring about threats against environmental damages and human health which produce a large number of heaps of corals containing ores and low content tailing [20].
Amalgamation is a method which is used for gold extraction from its ores. Amalgam gold is roasted to remove mercury and to focus on the gold [6]. Methyl mercury in water and mercury oxide in air is the result of amalgam process in human beings through the chainof food such as swallowing mercury which has been contaminated by food, fish, and vegetables through inhalation [3][17]. The main risk in environment and human beings is infiltration into ground water and contaminant remobilization from sediment to water column; its accumulation in organism or plants which live in water will return to the chain of human food [17].
These rivers are used for some activities of human beings such as taking a bath, fishing, industrial waste, and urban waste, urban farming, and some household waste. The objective of this research was to analyze mercury content in water surrounding the mines in North Sumatera, to determine whether it had reached the level of pollution which became quality standard specified by the Decree of the State Minister of Environment No. 115/2003. Besides that, this would help determine situation, and environmental strategy which was appropriate to solve the problem was suggested, plus problem solving was recommended.
II. MATERIALS AND METHODS
Area of Study and Location of Taking the Samples
The research was done in one of the areas in North Sumatera. The research samples were water which were collected from 12 (twelve) locations of study areas (Table 1).
NO Code Coordinate Depth 1 ST 1.1
N 1O28’05.9’’ E 99O03’15.6’
Surface
2 ST 1.2 0.6855 m
3 ST 1.3 1.371 m
4 ST 2.1
N 1O28’06.2’’ E 99O03’15.3’’
Surface
5 ST 2.2 0.8235 m
6 ST 2.3 1.647 m
7 ST 3.1
N 1O28’05.8’ E 99O03’14.1’’
Surface
8 ST 3.2 0.876 m
9 ST 3.3 1.756 m
10 ST 4.1
N 1O29’25.5’ E 99O01’31.4’
Surface
11 ST 4.2 0.7355 m
12 ST 4.3 1.417 m
Collecting and Analysis on Samples
Water samples were collected randomly from 4 locations of taking the samples in 12 area stations in rivers surrounding gold mines in North Sumatera. The sites of taking the samples were located in various directions and ranges from the town center. The samples in each location of the river flow were put into plastic vessels/jerry cans after they had been washed cleanly and sealed. The samples were sent to a laboratory to be analyzed. They were collected and preserved with 0.5 ml thick nitrate acid and stored in refrigerator in the temperature of 4oC.
Sample Destruction
The water samples were in normal temperature after they were taken from the refrigerator. They were added with HNO3 (thick), the
solution was heated until the volume of 20% from the initial volume. The samples were made cold (room temperature) in acid cupboard. After that, they were added with acid aquadest with the total volume of 100 mL and made them homogenous. They were filtered by using filtered paper which filtrate had been tested before using it. They were then analyzed by using Atomic Absorption Spectrophotometer (AAS) in analyzing mercury metal.
III. RESULT AND DISCUSSION
Analyzing mercury (Hg) in water is one of the most important and significant challenge against analytic chemistry because water is complex and important transportation and the lane of mercury transformation to environment and finally to human beings. Mercury occurs naturally; it is a volatile element which has been used by human beings for over 3,500 years [7][19], besides it is related to environmental problems because of its venomous nature [2].
Mercury can become a threat for environment and human health as well as poisonous concentration for some living organism [7][9]. Specifically, mercury is connected with malignant effect or even death in human beings because its absorption can cause the change in its chemical structure of DNA and the damage in digestive system, body and nervous immune; the last thing becomes the most vulnerable [11][23]. The testing was done by using H2SO4(thick), HNO3(thick), and SnCl2 reactor. The result was as follows:
Table – 2
Results of measurements of temperature, pH and levels of mercury (Hg)
Station Parameter
Determining Mercury (Hg) Standard Curve
The result of the analysis, using Atomic Absorption Spectroscopy (AAS) showed that there was the absorption of maximum wave length (λ max), Mercury Wave Length (Hg) of 253.7 nm. Mercury Standard Curve (Hg) was obtained from the measurement of Mercury (Hg) standard solution absorption toward Mercury (Hg) standard solution concentration; then, the standard curve linearity was calculated by using Least Square data method.
Fig. 1: Results of Measurement of Mercury Standard Curves.
The result of the calculation, using standard curve, showed that the linear regression equity was Y = 0.03655 X + 0.00125, with correlation coefficient (r) = 0.9998. This correlation coefficient could be accepted since it had fulfilled the specified requirement of 0.9500. From this result, it could be concluded that there was positive correlation between content and absorption; in other words, the increase in concentration would increase the absorption.
Acid or pH Standard
The result of measuring acid standard of river water in the surrounding gold mines in North Sumatera showed that the pH value of the waters tended to be stable, it was about 6.44 – 7.57 values. Based on this range of values, it could be concluded that the condition of river water surrounding gold mines in North Sumatera was in good category according to the quality standard. The Decree of the Minister of State of Environment No. 4/2007, it should be around pH 6 – 9 SNI 06-6989.11-2004 [16].
Fig. 2: Histogram The pH value of each sample station.
The pH value of the waters was closely related to the nature of heavy metal solution. In the pH of the sea, heavy metal is difficult to break down; it is in the form of particles or suspended solid. It also influences toxicity of chemical compound. In general, the toxicity of heavy metal will increase in low pH while in high pH, it will undergo sedimentation [18].
0,0 0,5 1,0 1,5 2,0
0,7304
0,5858
0,4398
0,3015
0,1416
Absorban
ce
Concentration (ppb)
0,0022
ST 1.1. ST 1.2. ST 1.3 ST 2.1. ST 2.2. ST 2.3 ST 3.1. ST 3.2. ST 3.3 ST 4.1. ST 4.2. 6.68 7.22
6.61 7.30 7.47
7.47 7.57
7.39 7.38
7.20
pH
Sample Code
Histogram of The Value of pH
Temperature
Temperature is one of the physical factors which is very important in waters area. The change in the temperature of the waters will influence the process of physics, waters chemistry, and waters biota. The increase in temperature can bring about the increase in metabolism acceleration and water biota respiration which will eventually increase oxygen consumption.
Fig. 3: Histogram of the temperature value of the sample
The increase in temperature will not only increase biota metabolism of the waters but will also increase the toxicity of heavy metal in that waters. Based on the measurement of water temperature during the observation, it was found that the temperature of the rivers surrounding gold mines in North Sumatera was around 29.1oC – 30.6oC while based on the quality standard of Kepmen LH
No. 51/2004 for sea biota [13]. It could be concluded that the range of the temperature of the river water surface in the surrounding gold mines in North Sumatera during the observation was in normal category and could be tolerated by the biota of the waters.
Content of Mercury Heavy Metal
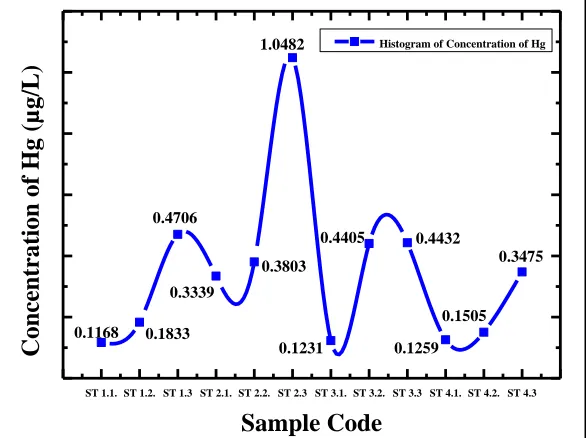
Heavy metal was detected in the water samples in the various concentrations on the rivers in the surrounding gold mines in North Sumatera. Table 1 indicated the concentration of the average traced metal in the water samples. The concentration of pollutant was measured in the Hg concentration in μg / L. In Figure 4, it could be seen that the concentration of average traced metal showed varied trends in different stations. The following was the result of the analysis on the content of mercury (Hg) heavy metal which was done in 12 stations of taking river water samples in the vicinity of gold mines in North Sumatera presented in Figure 4.
Fig. 4: Histogram values of metal mercury (Hg) concentrations in water in rivers around gold mining in North Sumatra ST 1.1. ST 1.2. ST 1.3 ST 2.1. ST 2.2. ST 2.3 ST 3.1. ST 3.2. ST 3.3 ST 4.1. ST 4.2.
29.4
29.1 30.1
30.0 30.3 30.4 30.6
30.1
29.4
29.2
Temperature
(o
C
)
Sample Code
Histogram of the Value of Temperature
29.2
ST 1.1. ST 1.2. ST 1.3 ST 2.1. ST 2.2. ST 2.3 ST 3.1. ST 3.2. ST 3.3 ST 4.1. ST 4.2. ST 4.3
0.3475
0.1505 0.1259
0.4432 0.4405
0.1231 1.0482
0.3803 0.3339
0.1833 0.4706
Concentration of
Hg
(µg/L)
Sample Code
Histogram of Concentration of Hg
The study was intentionally conducted to value the weight of metal contamination in the river water in the vicinity of the gold mines in North Sumatera. Since water pollution is dangerous for the water itself and for human health, the need for the value of water quality becomes very important concerning human beings and environment. Therefore, the 12 water samples were gathered from some locations. The water samples were the target of the analysis on heavy metal and also intended for the chemical parameter, including pH and temperature. When they were gathered and analyzed for heavy metal (Hg), it was found that the concentration of heavy metal (Hg) which had little value was allowed by the Decree of the Minister of State of Environment. It was concluded in this study that the heavy metal content in water was not dangerous to be consumed by human beings.
The analysis on the chemical parameter of the water showed that water pH was in normal category which was in accordance with the Decree of the Minister of State of Environment. The reason why its value was a little was that urban industrial waste was directly thrown away to the rivers. This is in accordance with a study [8] which states that the value level of heavy metal increases in the river because drainages of industrial waste and pollution are varied which will worsen the quality of water so that it is not suitable for the life of human beings and the water itself.
IV. CONCLUSION
The elements of water concentration samples were analyzed to value heavy metal content. The result of the study showed that there was the concentration of the average heavy metal, either in the water or surrounding the gold mines in North Sumatera. The data revealed that in ST 2.3 which had the value of 1.0482 μg/L (ppb) was higher than all of the data, but it did not exceed the threshold specified by the Government (0.02 ppm). This reality will increase discussion and understanding on the effect of industry and the activity of removing urban waste in the environment and its implication for the people’s health. Even though the concentration was little, the condition of the river water surrounding the gold mines in North Sumatera should be safeguarded. It is recommended that the other heavy metal contents in the rivers in the vicinity of gold mines in North Sumatera be analyzed and also the other heavy metal contents which are close to the gold mines.
REFERENCES
[1] Atibu, E.K., Devarajan, N., Thevenon, F., Mwanamoki, P.M., Tshibanda, J.B., Mpiana,P.T., Prabakar, K., Mubedi, J.I., Wildi, W., Poté, J., 2013.
Concentration of metalsin surface water and sediment of Luilu and Musonoie Rivers, Kolwezi-Katanga,Democratic Republic of Congo. Appl. Geochem. 39, 26–32.
[2] Barbosa, U.A.; Silva, L.O.B.; Santos, I.F.d.; Ferreira, S.L.C.; Santos, A.M.P.d. 2015. Determination of Mercury in Iron upplement Using Slurry Sampling
and Cold Vapor Atomic Absorption Spectrometry. Curr. Anal. Chem., ,11, 44-49.
[3] Cobbina, S.J., Myilla, M. and Michael, K. (2013) Small Scale Gold Mining and Heavy Metal Pollution: Assessment ofDrinking Water Sources in Datuku in
the Talensi-Nabdam District. International Journal of Scientific & TechnologyResearch, 2, 96.
[4] Devarajan, N., Laffite, A., Ngelikoto, P., Elongo, V., Prabakar, K., Mubedi, J.I., Piana,P.T., Wildi, W., Poté, J., 2015. Hospital and urban effluent waters as
a source ofaccumulation of toxic metals in the sediment receiving system of the CauveryRiver Tiruchirappalli, Tamil Nadu, India. Environ. Sci. Pollut. Res. Int. 22,12941–12950.
[5] Effendi, H. 2003. Review of Water Quality for Management of Aquatic Resources and Environment. Fifth print. Yogyakarta: Kanisius.
[6] Ezeh (2007) Environmental Significance of Heavy Metals Distribution. Ebonyi River Drainage System, Abakaliki andOhaozara Areas, South Eastern Nigeria.
Ph.D. Thesis, Nnamdi Azikiwe University, Awka.
[7] Gray, J.E. 2003. Geologic studies of mercury, Circular 1248; U.S. Geological Survey: Reston Virginia, USA, Qvarnström, J. 2003. On the reliability of
methods for the speciation of mercury based on chromatographic separation coupled to atomic spectrometric detection. Department of Chemistry, Umeå University, Sweden, Doctoral thesis,
[8] Hassan Z, Zubair Anwar, Khalid Usman Khattak, Mazhar Islam, Rizwan Ullah Khan ,Jabar Zaman Khan Khattak; et al. (2012), “Civic Pollution and Its
Effect on Water Quality of River Toi at District Kohat, NWFP” , Research Journal of Environmental and Earth Sciences, vol 4, 5
[9] Javanbakht, M.; Khoshsafar, H.; Ganjali, M.R.; Badiei, A.; Norouzi, P.Hasheminasab, 2009 A. Determination of Nanomolar Mercury( II) Concentration by
Anodic-Stripping Voltammetry at a Carbon Paste Electrode Modified with Functionalized NanoporousSilicaGel. Curr. Anal. Chem., 5, 35-41.
[10] Khadse, G.K., Patni, P.M., Kelkar, P.S., Devotta, S., 2008. Qualitative evaluation of Kanhan river and its tributaries flowing over central Indian plateau.
Environ. Monit. Assess. 147, 83–92.
[11] Krabbenhoft, D.P.; Rickert, D.A. 1995. Mercury Contamination of Aquatic Ecosystems, Fact Sheet FS-216-95; US Geological Survey, Water Resources
Division: Wisconsin, USA,
[12] Liu, W., Moran, C.J., Vink, S., 2011. Quantitative risk-based approach for improvingwater quality management in mining. Environ. Sci. Technol. 45, 7459–
7464.
[13] Minister of Environment Decree Number 51 of 2004 concerning Sea Water Quality Standards. Appendix 2
[14] Mubedi, J.I., Devarajan, N., Le Faucheur, S., Mputu, J.K., Atibu, E.K., Sivalingam, P.,Prabakar, K., Mpiana, P.T., Wildi, W., Poté, J., 2013. Effects of
untreated hospital effluents on the accumulation of toxic metals in sediments of receiving systemunder tropical conditions: case of South India and Democratic Republic of Congo. Chemosphere 93, 1070–1076.
[15] Nartey, V.K., Klate, R.K., Hayford, E.K., Doamekpor, L.K. and Appoh, R.K. (2011) Assessment of Mercury Pollutionin Rivers and Streams around Artisanal
Gold Mining Areas of the Birim North District of Ghana. Journal of EnvironmentalProtection, 2, 1227-1239.
[16] National Standardization Agency. 2004. How to Test the Degree of Acidity (pH) by Using a pH Meter SNI 06-6989.11-2004. National Standardization
Agency. Jakarta.
[17] Ngelinkoto, P., Thevenon, F., Devarajan, N., Birane, N., Maliani, J., Buluku, A.,Musibono, D., Mubedi, J.I., Poté, J., 2014. Trace metal pollution in
aquaticsediments and some fish species from the Kwilu-Ngongo River, DemocraticRepublic of Congo (Bas-Congo). Toxicol. Environ. Chem. 96, 48–57.
[18] Novotny, V. and H. Olem. 1994. Water Quality, Prevention, Identification, and management of diffuse Pollution. Van Nostrans Reinhold, New York. 1054
p
[19] Qvarnström, J. 2003. On the reliability of methods for the speciation of mercury based on chromatographic separation coupled to atomic spectrometric
detection. Department of Chemistry, Umeå University, Sweden, Doctoral thesis,
[20] Silva, M.M.V.G., Lopes, S.P., Gomes, E.C., 2014. Geochemistry and behavior of REE instream sediments close to an old Sn-W mine, Ribeira, Northeast
[21] Thevenon, F., Poté, J., 2012. Water pollution history of Switzerland recorded bysediments of the large and deep Perialpine Lakes Lucerne and Geneva. WaterAir Soil Pollut. 223, 6157–6169.
[22] Venugopal, T., Giridharan, L., Jayaprakash, M., Velmurugan, P.M., 2009. A comprehensive geochemical evaluation of the water quality of River Adyar,
India. Bull. Environ. Contam. Toxicol. 82, 211–217.
[23] Zhu, M.; Wang, Y.; Deng, Y.;Yao, L.; B. Adeloju, S.; Pan, D.; Xue, F.; Wu, Y.; Zheng, L.; Chen, W. 2014. Ultrasensitive detection of mercury with a novel