Analysis on Clustering Method for HMM-Based
Exon Controller of DNA Plasmodium falciparum for
Performance Improvement
Alfred Pakpahan
1, Suhartati Agoes
2, Binti Solihah
31Department of Biology, Faculty of Dentistry, Trisakti University 2
Electrical Engineering Department, Faculty of Industrial Technology, Trisakti University 3Informatic Technology Department, Faculty of Industrial Technology, Trisakti University
Trisakti University, Jalan Kyai Tapa Grogol Jakarta 11440, Indonesia Email: [email protected], [email protected] , [email protected]
Abstract--
Improved performance of exon controller of
Deoxyribo Nucleic Acid (DNA) Plasmodium falciparum based on Hidden Markov model (HMM) can be done with the application of clustering methods on data in the process of training and testing the HMM. Some Coding Sequence (CDS) data of DNA Plasmodium falciparum as the input data can be used during training to establish the model and the result of the formed model are tested by a sequence of data and the calculated level of familiarity to the data with a certain number of exons. Some amount of state models can be implemented on HMM structure to get the value of the model's performance is Correlation Coefficient (CC) is optimal. This research also identified the protein product similarity prediction results HMM models using the Open Reading Frame (ORF) and the identification of patterns of insertion and deletion of products associated with the predicted results of exon length. The simulation results indicate that increasing the number of states in the model is not linear to the increase in the value of the performance of the model compared to doing the clustering process HMM training and testing have increased the value of the CC with the simulation processing time is relatively short.
Index Term
--
HMM, Plasmodium falciparum DNA, CDS,clustering, CC
1. INTRODUCTION
The objective of this study is to control exon Deoxyribo nucleic acid (DNA) in the coding sequence (CDS) to a protein produced after going through the process of transcription and translation has not changed so there is no indication that changes generated against the protein. Exon controlling process is similar with gene finding technique. As mention in [1,2], there are two classes of method in gene prediction, sequence similarity search and ab initio gene finding (gene structure and signal based search. The limitation of the first approach, as mention in [1] is the fact that only half of genes being discovered have significant homology to genes in data base. In ab initio method, there are several algorithms have been developed, such as dynamic programming, Neural Network, Markov Model, Hidden Markov Model. The most successful program is Hidden Markov Model [1, 2].
One method that can be used to control the exon DNA is the method of Hidden Markov model (HMM) which has some of the parameters used are the number of states, the value of the transition state, state emissions values and algorithms used for training and testing process which Baum-Welch algorithm and Viterbi. In this study implemented HMM to control exons with simulation trials in the MATLAB programming environment and one of the developed model performance is expressed by the Correlation Coefficient (CC). Model accuracy in controlling exon is indicated by the value of the CC. Among the ways that have been used to increasethe value of the CC is to add the number of HMM states until a certain amount of state [3,4,5] and classify the training data based on the number of exons in the CDS [6]. Increasing the value by adding the value of state CC takes time training with the tendency of the model and logarithmic search state composition difficult. On the development of clustering models with state despite an increase in the number of CC but constrained by the limited training data. Therefore it is necessary to identify other ways to optimize the model. The goal of this study is to identify the relationship between the value of the CC with the protein product similarity prediction results compared to the original product , identifying the insertions and deletions on the results of the model predictions compared with the original CDS , then do the Fuzzy C-Mean clustering the training data to obtain improved performance of the model existing and clustering result is used to obtain a model that is specific to the characteristics of the data. The results of the trial showed an increase in the value of the CC compared with previous test results in the same model structure.
2.MARKOV MODEL TO CONTROL EXON HIDDEN
Hidden Markov Model (HMM) is one of the stochastic models consisting of a signal (the signal of DNA) that is modeled as a Markov chain state (state) and a finite observation corresponding observation process modeled on
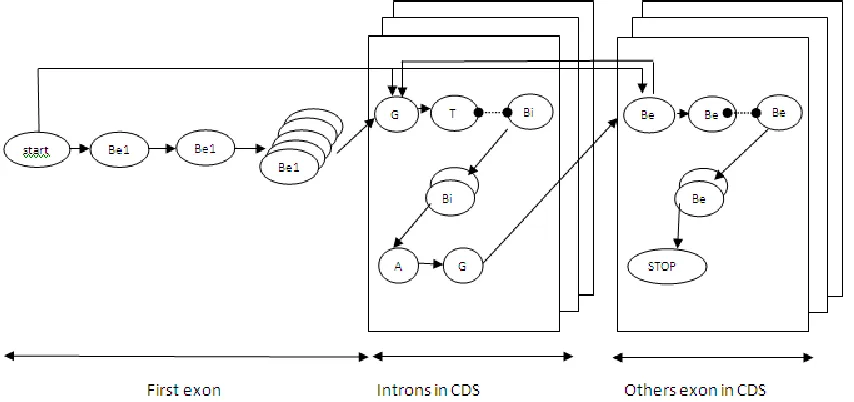
Fig. 1. HMM models for Plasmodium falciparum
Markov chains. Some outline the method consists of Markov chain HMM, HMM elements, the basic problems HMM and HMM basic problems solutions [5,6,7,8].
Markov chain (Markov Chain) is the probability of transition from one state to another can be determined according to the number of state and HMM topology use. Markov chain in the HMM method in accordance with the structure of the exons and introns are present in the DNA where the location of exons and introns should alternate (alternately located) that also affect the values of the transition state were randomly assigned so that will affect the performance of the model on the results. Performance comparison between the models is determined by decoding the state estimation results (testing) with the original state sequence according to the number of states that in designing the model structure. HMM model structure developed as in Figure 1. During the state definition phase, coding sequence area is devided in three areas, i.e first exon, introns area and others exon area. Each area is populated with a numbers of states defined in first stage. First exon base (Be1) is development of number state model in first exon area, each bases (GT bases the beginning in intron base area, intron base Bi and ended by AG bases) are located in the intron CDS, finally exon bases Be are performed by number of state and ended by one of three Stop codon in the other exons in CDS area. If seen from the structure, the position of the base in exon determines the model number in the state [3]. For the first exon, the bases after a certain sequence of numbers will have the same state. Next to the bases with the same serial number of an exon or intron in addition to the first exon state will also have the same number.
HMM model accuracy is expressed with CC values that are formulated as in equation (1) below:
TP FP
TP FN
TN FP
TN FN
FNFP TN TP CC
……….. (1)
Where TP: True Positive, TN: True Negative, FP: False Positive and FN: False Negative.
3.RESEARCH METHODOLOGY
The methodology used in this study is experimental simulations of various models of HMM with MATLAB software application contained on the Personal Computer Bioinformatics toolbox that can convert DNA sequences of data into a digital sequence and can be made of various forms of structural simulation models are processed in a computerized.
3.1. Model development
Development of the model structure is done by using the basic structure of part of exon sequences contained in the coding (CDS), thus increasing the number of state determination made in accordance with the location of exons and introns are located alternately.
Testing is done with the simulation process for HMM structures that have been designed in accordance with the basic structure of the exons in the CDS with the addition of a model state in this randomized study that may affect the determination of the values of random transition state. Simulations were also performed to calculate the total value of state in accordance with the shape of the model structure, HMM training process using the Viterbi algorithm and HMM testing using Viterbi algorithm and Baum-Welch to obtain one of the performance parameters of the model is the value of CC.
Plasmodium falciparum GenBank format in accordance with the existing database on http://www.ncbi.nlm.nih.gov/entrez/ sites with long sequences of at least 684 base pair (bp) and a maximum of 10095 bp.
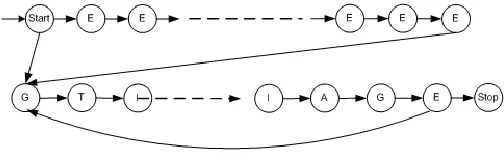
Implementation HMM method for controlling a model structure of this DNA has a basic structure as the location of exons in the CDS that can be known is that part of the intron between the two exons so that the basic structure can be described as Figure 2.
EXON INTRON EXON
Fig. 2. The basic structure of the model based on the structure of DNA
Model development is done by increasing the number of random state in the exons and introns. Opportunities transition values for each state are also done randomly with respect to the optimal value of the CC. The testing done by trial and error on the value of state transition model to obtain optimal performance. Structural form model development using HMM method for controlling DNA exons in general as in Figure 3 below.
Fig. 3. Structure Model Development with HMM method
3.2. Clustering Method
At this stage of the simulation process is carried out using fuzzy-C Mean for grouping data based on similarity of characteristics, the data further classification results are used to build new models and do testing to identify the presence or absence of increase in CC on a new model compared to the old model. Similarity analysis of protein-based product of Open Reading Frame (ORF) is more of a concept in biology and computation comparison ORF gene is defined as the area defined by a start codon, a set of codons which can be translated, and the stop codon. There are several aspects that need to be considered in the determination of the ORF [8], the first, each codon has three nucleotides called a triplet or amino acids that form, so that the reading frame ORF or this can be done from position 1, position 2, and 3 positions. The second aspect to be considered is the length ORF encodes a protein which has a length of more than 100 amino acids or 300 nucleotides, although the ORF is a computational concept, but in this case the use of ORF assessed sufficient, because the
data are used as testing data that is already known genes positions
The similarity analysis aims to identify similarities initial protein products compared with products of protein identification results in terms of controlling exon is due to the fact that the CC does not state how similarity levels of protein product produced, or how much resemblance to the original protein products predicted results for a certain value of CC. The process of mutation in the DNA there are three types of substitution or change one letter of the DNA sequence (point mutation), insertions and deletions, in real conditions is the most common substitution. Furthermore, at this stage do the identification process insertion and deletion in the model test results, related to how the model can precisely control the exons. Insertion process occurs if there is a base or set of bases in the DNA chain insert, while the deletion process occurs when one or a number of missing or truncated bases of the DNA chain. [8]
In this study, insertions and deletions in the DNA strands beshownto see how the model effectiveness in controlling exon, in the sense that the position of exons and introns can be retained as its origin. This process is done by juxtaposition of exons to identify the presence or absence of the insertion or deletion of one or more bases in exon prediction results. As a function of input DNA strand, the original position of exons and exon position prediction result. Output functions are stored in a file. Txt with component line number on the DNA strand, the original exon bases followed the sign ' - ' followed by exon prediction results. Implementation to perform this analysis is done by MATLAB with input in the form of DNA strand, the position of the first exon is exon position data is used as test data, and the position of the second exon is exon positions predicted results. So that the output of this function is the number of insertion and number of deletion.
4.SIMULATION RESULTS AND ANALYSIS OF SIMULATION RESULTS
HMM to control exon implemented in the MATLAB programming environment and a controller model building exons done through two stages, namely the stage of training and testing phases. In the clustering process of testing, done in two stages, the first stage of the model is tested with data containing sequences with any number of exons or general sequences, and then in the second phase of testing is done to sequence with a certain number of exons. In the clustering process of training and testing done specifically to DNA sequences with two exons. The data used for testing is
Plasmodium falciparum sequence data that have CDS with Genbank format. The use of such data in the training process must meet four criteria, namely the complete CDS, does not contain an element of the unknown, not a pseudo gene, and contains only one CDS in a single sequence.
4.1. Results of development model
Sequence data classification is based on the number of exon sequences are in Table 1 and the most widely used data
is the data sequence containing two exons and contain at least 10 exons.
Table I
The number of exon sequences of DNA
No Total DNA exon
In the sequence
Total
1 2 69
2 3 27
3 4 13
4 5 13
5 6 14
6 7 4
7 8 4
8 9 7
9 10 1
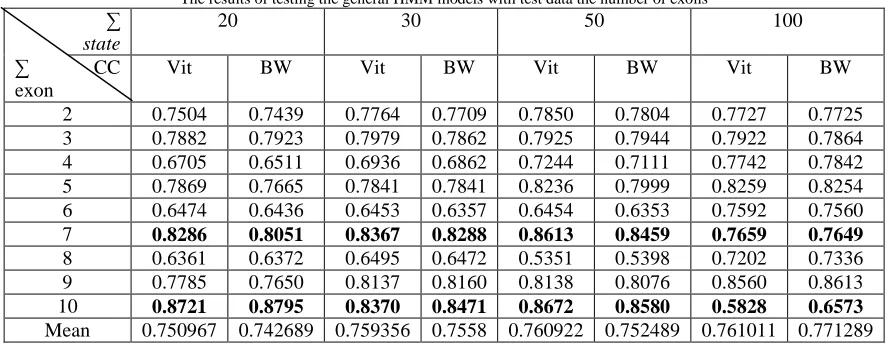
The test results are expressed with CC values contained in Table II with the value of CC for a certain amount of state models at each number of exons present in the same column.
Table II
The results of testing the general HMM models with test data the number of exons ∑
state
20 30 50 100
∑ exon
CC Vit BW Vit BW Vit BW Vit BW
2 0.7504 0.7439 0.7764 0.7709 0.7850 0.7804 0.7727 0.7725
3 0.7882 0.7923 0.7979 0.7862 0.7925 0.7944 0.7922 0.7864
4 0.6705 0.6511 0.6936 0.6862 0.7244 0.7111 0.7742 0.7842
5 0.7869 0.7665 0.7841 0.7841 0.8236 0.7999 0.8259 0.8254
6 0.6474 0.6436 0.6453 0.6357 0.6454 0.6353 0.7592 0.7560
7 0.8286 0.8051 0.8367 0.8288 0.8613 0.8459 0.7659 0.7649
8 0.6361 0.6372 0.6495 0.6472 0.5351 0.5398 0.7202 0.7336
9 0.7785 0.7650 0.8137 0.8160 0.8138 0.8076 0.8560 0.8613
10 0.8721 0.8795 0.8370 0.8471 0.8672 0.8580 0.5828 0.6573
Mean 0.750967 0.742689 0.759356 0.7558 0.760922 0.752489 0.761011 0.771289
In the Table II the position of the line explained in a row for the test results to the CC value using the Baum - Welch algorithm and Viterbi algorithm in the structure of the model with a certain amount of state.
In general it can be said from the results of the development of the model with the HMM method is that the value of the CC with Viterbi algorithm is better when compared with the value obtained from the CC model development using Baum Welch algorithm. If the amount of training data associated with CC values obtained relationship, the less data entered for the training process at the time of the testing process with the same data results will be better because the process is easy or generalization would be worst if the system fails to generalize.
4.2. Clustering Method Result
Fig. 4. Example of a triplet identification results
Results iidentification of iinsertion and deletion of model results obtained with the initial alignment and exon prediction results from a sequence as shown in Figure 5 with following explanation:
- a-a means that a recognized as an exon bases in the original DNA strand and the DNA strand prediction results.
- -a means there is a base insertion in exon prediction results
- a- means a process of elimination of a base in exon prediction results.
Fig. 5. Examples of insersion and deletion of exon base
Clustering results in some of the data used in the model building process of the HMM can be seen in Table III.
Table III
Example of clustering results in some training data No 1st exon
length
2nd exon length
Intron length
Classification result
1 5319 1311 888 0
2 1284 195 153 1
3 80 1753 675 1
4 51 387 511 1
5 913 3191 195 1
6 54 912 246 1
7 3003 843 178 0
8 2728 83 213 0
9 304 362 513 1
10 391 911 224 1
11 69 702 210 1
12 1855 353 305 1
13 72 978 98 1
From the total number of experimental data used 69 sequences of data, classification results indicate that the data are classified as cluster 1 are 57 data and cluster 0 are 12 data. The amount of 69 data is then used as training data in a model-based controller exon HMM. CC values obtained using the amount of 69 data is 0.7077 whereas after 12 data item is not used; the CC value obtained is 0.7970. The increase in the value of the CC is larger than the number of state added to the model as is done in [3] is equal to 0.7845. Other performance improvements are also obtained when training is required for the establishment of a model with amount of 20 states, it only takes no more than 0.2 hours to form a model while the number of state 100 it took more than 5 hours.
5. RESULTS AND DISCUSSION
The success rate of model building using training data created for testing the data sequences that have a certain number of exons that result in variations in the value of the CC controller application by exon DNA HMM method can be developed in the form of the model structure of DNA sequences that have any number of exons. FCM is effective enough to classify the data forming the HMM-based model of control exons. Test results show that a model built with training data derived from a single cluster (i.e. cluster 1) resulted in a greater CC compared with an increase of the addition amount of the state. In exon controller models are built with HMM obtained by insertion in exon number is smaller than the number of exon deletions because the model controller can maintain intron position as the intron, but the number of large deletions suggests that many bases in exon position moves to the position of introns.
ACKNOWLEDGEMENTS
research can be conducted and the Trisakti University Research Institute for their supports.
R
EFERENCES[1]. Wang, Z., Chen, Y., Li, Y., A Brief Review of Compu- tational Gene Prediction Method, Geno. Prot. Bioinfo, vol 2 No 4 2004
[2] Mathe, C., Sagot, M.F., Schiex, Rouzhe, C., Survey and and Summary Current Method of Gene Prediction their Strength and Weaknesess, Nucleic Acid Research, Vol 30 No 19. Oxford University Press, 2002.
[3]. Bruce Alberts, Dennis Bray, Julian Lewis, Martin Raff, Keith Roberts, James D Watson, Biologi molekuler sel: Mengenal sel, 2nd
ed (Translate), PT Gramedia Pustaka Utama, pp. 145-165, 1994. [4]. Solihah B., Agoes S.,Pakpahan A, Optimization Structure of Hidden
Markov Model for Plasmodium falciparum Gene Prediction, (IJEIT-Online), 2012.
[5] Malcolm J Gardner, The genome of the malaria parasite. Current Opinion in Genetics and Development 9,704-708 (1999).
[6]. Tapas Kanungo, Hidden Markov Model, Center for Automation Research, University of Maryland, 2003. http://www.kanungo.com /software /hmmtut.pdf, November 2005.
[7]. Andrew W Moore, Hidden Markov Models. School of Computer Science, Carnegie-Mellon University, 15 November, 2005
[8]. Jose Renau, Hidden Markov Models: Fundamentals And applications to bioinformatics. http://web.mst.edu/ ~shoukat/IPDPS2007-BoA.pdf, July 2005
[9]. Tulyakov, Introduction to Hidden Markov models, 2003.
[10]. Gopal, S., Haake, A., Jones, R.P., Tymann, P., 2009, “Bioinformatics A Computing Perspective”, McGraw Hill, New York.
[11]. Yang, Y., Huang, S., 2007, “Image Segmentation By Fuzzy c-Means Clustering Algorithm With A Novel Penalty Term”, Computing and Informatics, Vol. 26, page 17-31.