Research on Risk Evaluation in Supply Chain
Based on Grey Relational Method
Peide Liu
Information Management School, Shandong Economic University, Ji’nan, China Email: [email protected]
Tongjuan Wang
Information Management School, Shandong Economic University, Ji’nan, China Email: [email protected]
Abstract—Supply chain risk evaluation is a multi-criteria decision making problem under fuzzy environments. To tackle the problem, this paper firstly identifies and discusses some of the important and critical decision criteria and constructs the evaluation indicator framework. Then this paper presents a modified grey relational analysis method based on the concepts of ideal and anti-ideal points. In the method, the weight information is partially known and the vagueness and subjectivity are handled with linguistic terms parameterized by triangular fuzzy numbers. Besides, a single objective programming model is developed to determine the relation degree between every alternative and positive ideal point or negative ideal point. By solving the programming model, the weight vector of criteria is calculated. The alternatives are ranked by the relative relation degree. Finally, a case study is given to demonstrate the proposed method’s effectiveness.
Index Terms—supply chain, risk evaluation, multi-criteria decision making, grey relational analysis
I. INTRODUCTION
Any organization in business today is under pressure to stay competitive and make profit. Over the last 10 to 15 years, many companies urged to focus their energy on core value-adding activities by employing new supply chain strategies for this reason. Apparently, this will help companies to reduce the cost of goods, develop new markets and free-up resources. However, these benefits are often accompanied by greater supply chain complexity and exposure to new risks. Terrorist strikes, natural disasters, industrial actions and political instability in Third World countries have awakened managers as never before to supply chain risks. The fact is that supply chain are not only more efficient but also riskier. Although it’s impossible to eliminate risk entirely, companies still try to learn about and mitigate risk by evaluating the supply chain risk. Up to date, supply chain risk evaluation has become a key link of supply chain management.
The objective of supply chain risk evaluation is to alert the manage team to potential harm posed by internal and external sources. Meanwhile, systematic supply chain risk evaluation provide a baseline for risk control planning. It goes without saying that risk evaluation is vital for effective risk control. The big disasters, such as supply chain disruption or break, always result from undervaluing the element and complexity of risk. So being aware of the importance of supply chain risk evaluation is important for supply chain risk management.
Risk is the possibility of suffering harm or loss and born of uncertainty. Supply chain risk refers to uncertainty or unpredictable event affecting one or more of the parties within the supply chain or its business setting, which can influence the achievement of your own business objectives [1,2]. Generally, there are two steps to take to evaluate the supply chain risk.
The first step of supply chain risk evaluation is to identify the risks in supply chain, namely risk identification. Risk identification means discovering, defining, describing, documenting and communicating risks before they become problems and adversely affect the supply chain. In order to manage supply chain risks effectively and mitigate them to the most degree, the important thing is to know what they are. This seems simple, but actually to capture all the possible risks is rather difficult, even impossible. Owing to the complexity of the environment and limitation of the human’s knowledge, what can be done is to capture as many risks as possible and make sure that as less risks as possible will be missed out. Besides, risk identification is a very subjective process, and to avoid the subjectivity, it is usually best to involve outsiders as well as people who are familiar with the business and know it well. In this case, people’s expertise could be made good use of and fresh viewpoint’s benefits will be reaped.
In regard to risk identification, there have been a lot of research. Sunil Chopra and Sodhi surveyed a variety of risks threatening supply chains and explained each of nine categories of risk, along with their specific drivers: disruption, procurement, intellectual property, delay, systems, forecast, receivables, inventory, and capacity
[3]. Simons regarded that the supply chain risk can be classified four categories: strategy risk, operation risk, asset damage risk and competition risk [4]. Meulbrook stated five kinds of supply chain risk: customer risk, financial risk, accounting risk and legal risk [5]. Smallman illustrated two kinds of risk: reputation risk and legal risk [6]. Zhang Bingxuan studied and analyzed the risk factors of supply chain: market risk and cooperation risk, profit distribution risk, profit fluctuation risk, technique risk, information resource risk and moral risk [7]. Dang Xianing classified supply chain risk into four categories: efficient risk, information risk, capital risk and external risk [8].
In brief, majority of these researches classify supply chain risk from two perspectives: the first perspective with natural environment and social environment dimensions, Zhang Bingxuan [7], Han Dongdong [9], Lin Zhaoyang [10] illustrated their views respectively from this perspective; and the other with internal and external dimensions, Ding Weidong et. al., George A. Zsidisin [11] expressed their points from this perspective.
The second step of supply chain risk evaluation is determining which method should be used to measure the risk level. Harland et al. pointed out the possibility of risk event relied on the risk exposure degree and occurrence possibility of trigger factors [12]. Crockford thought the result of risk event can be measured by the possibility of risk occurrence and severe degree [13]. Mitchell agreed that it was a common way to measure the risk from possibility and influence two aspects [14]. Stan smith classified the risk into five rank from the possibility of risk occurrence and severe level two aspects and constructed a risk evaluation matrix with 25 panes. So according to the evaluation matrix, the identification results of the risk in supply chain can be classified, and different methods can be used to handle different degrees of risk [15]. Fu Yu et al. applied case-based reasoning technology in supply chain risk evaluation, and designed an incidental risk estimation system [16]. Ding Weidong proposed a fuzzy comprehensive evaluation method and measured the risk of supply chain system by the reliability of supply chain system [17]. Jiang Youling presented Ann-based comprehensive evaluation model to assess supply chain risk and studied its application [18]. Jiang Xiaogan, Chen Fenglin, Wang feng investigated from three aspects: the inner risk of the enterprise in supply chain network, the cooperative risk between enterprises, the external environment of supply chain network. Besides, they adopted fuzzy evaluation method to define the probability and the influence degree so that risk can be evaluated by the product of these two factors [19]. Xiao Meidan, Li Congdong and Zhang Yugeng used the uncertainty and fuzzy method to calculate risk possibility and risk loss, then applied a comprehensive evaluation model to evaluate the risk level [20].
Considering the advantages and disadvantages of above methods, this paper will employ a modified grey relational analysis method to evaluate the supply chain risk. In the method, the weight information is partially known, and a single objective programming model is
developed to determine the weight vector. Then the relative relation degree can be calculated, and the alternatives will be ranked by it.
II.CRITERIA SELECTION FOR SUPPLY CHAIN RISK
EVALUATION
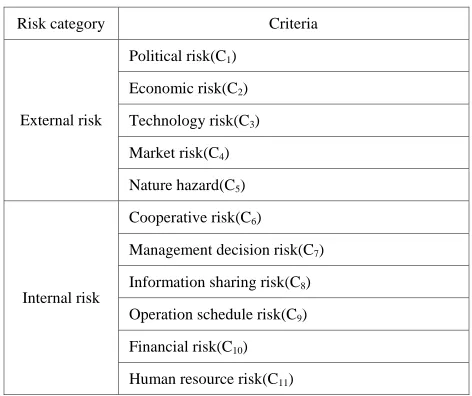
This paper analysis the influence factors to supply chain risk from the single corporation perspective. And it divides the factors into two kinds: external risk and internal risk. External risk depends on the environment outside the corporation and the corporation have little influence on such factors. What the corporation could do is to prepare enough for such risks. Internal risk caused by the corporation itself and could be mitigated by investigation and improvement. And the corporation could do a lot in this scope. This paper studies the important characteristics of the two kinds risks, and summarizes them as below:
Political risk(C1): Political risk is a type of risk faced
by investors, corporations, and governments. It refers to the risk of loss when the supply chain is disrupted by the changes in a country’s political structure or policies, such as tax laws, tariffs, expropriation of assets. With the globalization become the trend of business, political change may result in disruption of supply chains around the world and bring catastrophic results, especially for those corporations which have no preparation to respond quickly to problems with overseas suppliers. And this influence is not limited to one country, sometimes, it involves the world.
Economic risk(C2): Economic risk is the danger that
the economy could bring the loss to your supply chain. And the risk associated with changes in exchange rates or local regulations, which may in your favour or favour your competitors. But thinking only about the advantages can have a downside, the companies should focus on preparing for the probable catastrophic consequences caused by such risk.
Technology risk(C3): Technology risk is the danger
caused by the development of science and technology as well as the changes of production mode. Technology effectively permeates the operations of the entire supply chain and therefore defies compartmentalization. And it help to develop the key process of the supply chain, and make it more efficient, secure. However, technology improvement also bring risk. By understanding the role that technology plays in supply chain, company will be in a better position to handle it.
Market risk(C4): Market risk is exposure to uncertainty
in loss caused by market changes. A supply chain can not responsive to changing market trends and customer preferences without the right market signals. And it’s inevitable to lose the business opportunities in such case. Due to the new demands or the demands changes, it’s hard for a company to grasp the trend of market.
Natural hazard(C5): Natural hazard includes volcano,
disruption of the whole supply chain. In a geographical area where natural disasters are common, most of companies confessed that if a natural disaster occurred they probably can not maintain business operations and supply obligations.
Cooperative risk(C6): Cooperative risk means the loss
result from the cooperation breakdown or changes among the participants in the supply chain. This may lead to bad results, such as supply chain disruption or failure. And the distrust between the copartners in the supply chain is supported to be the most important factor to bring about such results.
Management decision risk(C7): As the business world
becomes more complex, the decision environment turn to be vague and uncertain. So to make a right decision more depend on the understanding of decision information and the decision experience in the same circumstance. And for those who have a bad sense and are inexperienced, this would be a mission impossible.
Information sharing risk(C8): The central purpose of
information sharing is to assist in minimizing the risk of harm to supply chain. But the fact is information sharing accompanies greater risk. Sensitive information revealed might result in loss of an advantage or level of security and may lead to the disruption of supply chain. So to be clear with what information can be shared and what can not will help the companies maintain an efficient but secure supply chain.
Operation schedule risk(C9): Operation schedule risk
is the danger of loss in failing to meet schedule plans. Since uncertainly exists in every schedule. So it is impossible to predict, with complete confidence, the length of time necessary to produce the product, to deliver the product etc. And Schedule delay often results in loss of revenue, costs increasing and reputation damage.
Financial risk(C10): Financial risk is normally any risk
associated with any form of financing. Facing financial risk, the company in today’s business world need take
actions to mitigate the risk and create economic value by using financial instruments to manage exposure to risk.
Human resource risk(C11): Human resource risks are
events that prevent employees from fulfilling their responsibilities and thus keep the supply chain from operating at full efficiency. Human resource risks includes death, disability, divorce, employee turnover etc. The ideal way to deal with human resource risk is to keep a contingency plan in case of the available of key personnel.
III. THE PROPOSED MODEL
Suppose D is the decision matrix, A1, A2, … , Am are
the alternatives to be chosen, C1, C2, …, Cn denote the
evaluation criteria, xij represents the rating of alternative
Ai with respect to criterion Cj.
So a typical fuzzy multi-criteria decision-making problem can be expressed in matrix format as
,
2 1
n 2 22
21
n 1 12
11
m 2 1
n 2
1
⎥
⎥
⎥
⎥
⎦
⎤
⎢
⎢
⎢
⎢
⎣
⎡
=
mn m
m
x
x
x
x
x
x
x
x
x
A
A
A
C
C
C
D
L
M
M
M
M
L
L
M
L
where, i =1, 2, …, m, j=1, 2, …, n, xij is denoted by
linguistic term.
Let
ϖ
=
(
w
1,
w
2,
L
w
n)
T be weight vector, wj bethe weight of criterion Cj, and
∑
=1=
1
n
i
w
j .Owing to the complexity of evaluation object, the evaluators usually just give partial weight information. And there are 6 forms of partial weight information usually given by evaluators:
j i
w
w
≥
,j ij i
w
w
≥
∂
,ij j i
w
w
−
≥
β
,j j j
w
η
γ
≤
≤
,ij j i
ij
w
w
ζ
σ
≤
/
≤
,)
(
2
w
i
j
k
w
w
i+
j≤
k≠
≠
,where
∂
ij,
β
ij,
γ
j,
η
j,
σ
ij,
ζ
ij are nonnegativeconstant numbers. For demonstrating the steps of the method, let
Q
be the set of above 6 forms.A. Normalize the Decision Matrix
xij is represented by linguistic term, and
x
ij∈
S
, S = {S1=EL, S2=VL, S3=L, S4=M, S5=H, S6=VH, S7=EH}.The exact meaning of the elements in S is given in Table II.
Generally criteria can be classified into two types: benefit criteria and cost criteria.
For benefit criteria, the normalized formula is:
TABLE I.
INDICATOR SYSTEM FOR SUPPLY CHAIN RISK EVALUATION
Risk category Criteria
Political risk(C1)
Economic risk(C2)
Technology risk(C3)
Market risk(C4)
External risk
Nature hazard(C5)
Cooperative risk(C6)
Management decision risk(C7)
Information sharing risk(C8)
Operation schedule risk(C9)
Financial risk(C10)
Internal risk
'
,
S
x
~
,
S
x
If
ij=
i ij=
ij
∈
I
, (1)For cost criteria, the normalized formula is:
I
j
S
n i∈
′′
=
=
S
,
x
~
+−,
x
If
ij i ij 1 , (2)where, n is the number of elements in S, here n=7,
ij
x
~
is the normalized form ofij
x
,I
′
is associated with benefit criteria andI
′′
is associated with cost criteria.B. Convert the Linguistic Term into Triangular Fuzzy Number
Since the subjective judgment or prediction of an expert may be ill expressed, it is reasonable to represent xij as linguistic variables and then converted it into
triangular fuzzy number. Table II shows the linguistic values and their corresponding triangular fuzzy numbers. So the linguistic term xij can be converted to triangular
fuzzy number as
)
,
,
(
ijUM ij L ij
ij
v
v
v
v
=
.C. Determine the Ideal and Negative Ideal Solutions The fuzzy positive-ideal solution (FPIS,A*) and the fuzzy negative-ideal solution (FNIS,A-) are shown in the following equations: } , , 2 , 1 , , 2 , 1 | max { } ,... { 1* * * n j m i v v v A ij i
j = = K = K
= , (3)
} , , 2 , 1 , 2 , 1 | min { } ,...
{v1 v v i m j n
A ij
i
j = = K = K
= − −
− . (4)
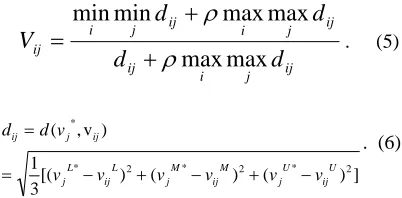
D. Calculate the Grey Relation Coefficient
The relation coefficient between alternative i and FPIS with respect to criterion Cj (namely
V
ij) is as follows:ij j i ij ij j i ij j i ij
d
d
d
d
V
max
max
max
max
min
min
ρ
ρ
+
+
=
. (5)] ) ( ) ( ) [( 3 1 ) v , ( 2 * 2 * 2 * * U ij U j M ij M j L ij L j ij j ij v v v v v v v d d − + − + − = =
. (6)
The relation coefficient between alternative Ai and
FNIS with respect to criterion Cj(namely
W
ij) is as follows: ij j i ij ij j i ij j i ijs
s
s
s
W
max
max
max
max
min
min
ρ
ρ
+
+
=
. (7)] ) ( ) ( ) [( 3 1 ) , ( 2 2 2 U ij U j M ij M j L ij L j ij j ij v v v v v v v v d s − + − + − = = − − − − . (8)
Where, i=1,2,…m, j=1,2,…n, dij is the distance
between triangular fuzzy numbers vj* and vij, sij is the
distance between triangular fuzzy numbers vj- and vij.
ρ
is the discrimination coefficient,ρ
∈
[
0
,
1
]
and generallyρ
=0.5. The relation coefficient vector between alternative Ai and FPIS(A*) isT in i i
V
V
V
,
,
)
(
1 2L
,and the relation coefficient vector of alternative Ai and
FNIS(A-) is
T in i
i
W
W
W
,
,
)
(
1 2L
.E. Construct the Single Objective Programming Problem to Determine the Weight Vector
Suppose
∑
==
n j j ij iV
w
V
1,
,
1∑
==
n j j ij iW
w
W
Where, i=1,2…,m. For get Vi and Wi, the vector
T n
w
w
w
,
,
)
(
1 2L
=
ϖ
is need to be determined first. Sothe multi-objective optimization model is developed to get
ϖ
=
(
w
1,
w
2,
L
w
n)
T..
,...
2
,
1
,
0
,
1
,
,...
2
,
1
,
.
.
,
,...,
2
,
1
,
min
,
,...,
2
,
1
,
max
1 1 1n
j
w
w
n
j
Q
w
t
s
m
i
w
W
W
m
i
w
V
V
j n j j j n j j ij i n j j ij i=
≥
=
=
∈
=
=
=
=
∑
∑
∑
= = = (9)Since every alternative is fair competition and there is no preference relation, the above multi-objective optimization model can converted into single objective programming problem.
TABLE II.
LINGUISTIC TERMS AND THEIR CORRESPONDING TRIANGULAR FUZZY NUMBERS
Linguistic values Triangular fuzzy numbers
Extremely high(EH) (0.95,1,1)
Very high(VH) (0.7,0.85,1)
High(H) (0.55,0.7,0.85)
Medium(M) (0.35,0.5,0.65)
Low(L) (0.15,0.3,0.45)
Very low(VL) (0,0.15,0.3)
.
,...
2
,
1
,
0
,
1
,
,...
2
,
1
,
.
.
,
)
(
min
1 1 1
n
j
w
w
n
j
Q
w
t
s
w
V
W
D
j n j
j j
m i
n j
j ij ij
=
≥
=
=
∈
−
=
∑
∑∑
= = =
(10)
And with the single objective programming problem, the weight vector
ϖ
can be determined.F. Calculate the Relative Relation Degree of Alternatives
i i
i i
W
V
V
C
+
=
. (11)Choose an alternative with maximum Ci or rank
alternatives according to Ci in ascending order.
IV. EMPIRICAL STUDY OF SUPPLY CHAIN RISK
ASSESSMENT
Supply chain risk evaluation is generally complex in operation and it involves a variety of factors arising from environment, social, and even political concerns. Owing to the uncertainty in human judgment, decision making in supply chain risk evaluation is actually a multi-criteria decision making problem under fuzzy environment. Here we use the proposed method to evaluate the supply chain risk of 4 enterprises in Shandong province of China.
The partial weight information is given as follows:
2
.
1
/
21
w
<=
w
;5 3
0
.
8
w
w
<=
;4 6
0.02
w
−
w
>=
;7
0.08
<=
w
<=
0.12
;8 9
2
10w
+
w
<=
w
;1 5
0.06
w
−
w
>=
;9 2
0.02;
w
−
w
>=
6 8
0.01;
w
−
w
>=
11
0.07
w
>=
;
w
8>=
0.03
.3
0.09
w
>=
And the linguistic decision matrix is as follows:
⎥ ⎥ ⎥ ⎥
⎦ ⎤
⎢ ⎢ ⎢ ⎢
⎣ ⎡
=
M VL L EL M H VH L M M VH
EL VL M M VL EH VL L M M VH
EL VL M M L M VL EH H EL VH
M M EL VL L M M M H EL EH
D
.
Step1 normalized the decision matrix
Since these criteria are all cost criteria, with (2), the normalized decision matrix is:
⎥ ⎥ ⎥ ⎥
⎦ ⎤
⎢ ⎢ ⎢ ⎢
⎣ ⎡
=
M VH H EH M L VL H M M VL
EH VH M M VH EL VH H M M VL
EH VH M M H M VH EL L EH VL
M M EH VH H M M M L EH EL
D~
.
Step 2 convert the linguistic term into triangular fuzzy number
According to Table II, convert the linguistic decision matrix into triangular fuzzy number decision matrix, and get the matrix shown in Table III.
Step 3 Determine the ideal and negative ideal solutions With (3) and (4), we get
*
((0.00,0.15,0.30), (0.95,1.00,1.00), (0.35,0.50,0.65), (0.55,0.70,0.85), (0.70,0.85,1.00), (0.35,0.50,0.65), (0.70,0.85,1.00), (0.95,1.00,1.00), (0.95,1.00,1.00), (0.7
A =
0,0.85,1.00), (0.95,1.00,1.00))
.
((0.00,0.00,0.05), (0.35,0.50,0.65), (0.15,0.30,0.45), (0.00,0.00,0.05), (0.00,0.15,0.30), (0.00,0.00,0.05), (0.35,0.50,0.65), (0.35,0.50,0.65), (0.35,0.50,0.65), (0.35,0
A−=
.50,0.65), (0.35,0.50,0.65))
.
Step 4 calculate the grey relation coefficient
Use (6) and (8) to get Vij and Wij as follows: TABLE III.
TRIANGULAR FUZZY NUMBER DECISION MATRIX
C1 C2 C3 C4 C5 C6
A1 (0,0,0.05) (0.95,1,1) (0.15,0.3,0.45) (0.35,0.5,0.65) (0.35,0.5,0.65) (0.35,0.5,0.65)
A2 (0,0.15,0.3) (0.95,1,1) (0.15,0.3,0.45) (0,0,0.05) (0.7,0.85,1) (0.35,0.5,0.65)
A3 (0,0.15,0.3) (0.35,0.5,0.65) (0.35,0.5,0.65) (0.55,0.7,0.85) (0.7,0.85,1) (0,0,0.05)
A4 (0,0.15,0.3) (0.35,0.5,0.65) (0.35,0.5,0.65) (0.55,0.7,0.85) (0,0.15,0.3) (0.15,0.3,0.45)
C7 C8 C9 C10 C11
A1 (0.55,0.7,0.85) (0.7,0.85,1) (0.95,1,1) (0.35,0.5,0.65) (0.35,0.5,0.65)
A2 (0.55,0.7,0.85) (0.35,0.5,0.65) (0.35,0.5,0.65) (0.7,0.85,1) (0.95,1,1)
A3 (0.7,0.85,1) (0.35,0.5,0.65) (0.35,0.5,0.65) (0.7,0.85,1) (0.95,1,1)
⎥ ⎥ ⎥ ⎥
⎦ ⎤
⎢ ⎢ ⎢ ⎢
⎣ ⎡ =
0.415 1.000 0.537 1.000 0.500 0.636 0.333 1.000 1.000 0.415 1.000
1.000 1.000 0.415 0.415 1.000 0.415 1.000 1.000 1.000 0.415 1.000
1.000 1.000 0.415 0.415 0.700 1.000 1.000 0.336 0.636 1.000 1.000
0.415 0.500 1.000 0.675 0.700 1.000 0.500 0.636 0.636 1.000 0.675
ij
V .
⎥ ⎥ ⎥ ⎥
⎦ ⎤
⎢ ⎢ ⎢ ⎢
⎣ ⎡ =
1.000 0.500 0.636 0.415 1.000 0.537 1.000 0.336 0.636 1.000 0.675
0.415 0.500 1.000 1.000 0.500 1.000 0.333 0.336 0.636 1.000 0.675
0.415 0.500 1.000 1.000 0.636 0.415 0.333 1.000 1.000 0.415 0.675
1.000 1.000 0.415 0.500 0.636 0.415 0.500 0.415 1.000 0.415 1.000
ij
W .
Step 5 Calculate the weight vector
⎪ ⎪ ⎪
⎩ ⎪⎪ ⎪
⎨ ⎧
= = ∈
− +
+ −
− −
− −
=
∑
=
1
, 11 ,...., 2 , 1 j , s.t.w
684 . 0 410 . 0 127 . 0 684 . 0 667 . 0 886 . 0 649 . 0 min
11
1 j
10 9 8
7 6
5 4
1
j j
w Q
w w w
w w
w w
w D
Then, the weight vector
T 0.070) 0.040, 0.163, 0.030, 0.080,
0.040, 0.112, 0.060, 0.090, 0.143, (0.172,
=
ϖ
And
V1 = 0.739 V2 = 0.790
V3 = 0.780 V4 = 0.671
W1 = 0.662 W2 = 0.672
W3= 0.696 W4 = 0.756
Step 6 Rank the alternatives According to (11),
C1 = 0.527 C2 = 0.540
C3 = 0.528 C4 = 0.470
So,
4 1 3
2
A
A
A
A
f
f
f
,Namely, alternative A2 has least risk.
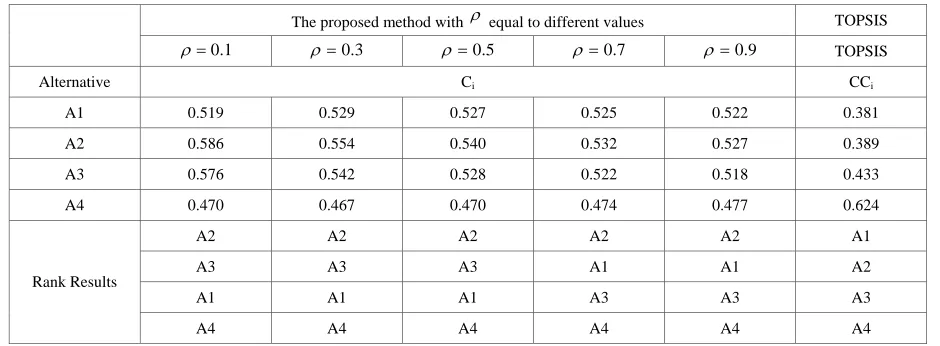
V.RESULTS OF COMPARISION
In order to validate the advantages and introduce the application field, this section compare the results of the proposed method and the TOPSIS method based on the data in Table III.
And the TOPSIS method used in this paper includes such steps:
1) Normalize the Decision Matrix Use (2) to get normalized decision matrix.
2) Convert the Linguistic Term into Triangular Fuzzy Number
According to the corresponding relationship between linguistic term and triangular fuzzy number listed in the Table II, the triangular fuzzy number-valued decision matrix can be got.
TABLE IV.
CALCULATION RESULTS OF PROPOSED METHOD AND TOPSIS
The proposed method with ρ equal to different values TOPSIS
1 . 0
=
ρ ρ=0.3 ρ=0.5 ρ=0.7 ρ=0.9 TOPSIS
Alternative Ci CCi
A1 0.519 0.529 0.527 0.525 0.522 0.381
A2 0.586 0.554 0.540 0.532 0.527 0.389
A3 0.576 0.542 0.528 0.522 0.518 0.433
A4 0.470 0.467 0.470 0.474 0.477 0.624
A2 A2 A2 A2 A2 A1
A3 A3 A3 A1 A1 A2
A1 A1 A1 A3 A3 A3 Rank Results
3) Determine the Ideal and Negative Ideal Solutions Use (3) and (4) to determine ideal and negative ideal solutions.
4) Calculate the Grey Relation Coefficient
Use (5), (6), (7) and (8) to calculate the grey relation coefficient.
5) Construct the Single Objective Programming Problem to Determine the Weight Vector
Use (10) to figure out the weight vector.
6) Calculate the Distance between alternative A i and FPIS / FNIS
Let di+be the distance between alternative Ai and FPIS ,
di- be the distance between alternative Ai and FNIS. And
the formula of di+and di-are:
∑
= +
=
n1 j
*
)
,
(
ij jj
i
w
d
v
v
d
. (12)∑
=
− −
=
nj
j ij j
i
w
d
v
v
d
1
)
,
(
. (13)Where,
i
=
1
,
2
L
m
,
j
=
1
,
2
,
L
n
. 7) Calculate the Closeness coefficienti i
i i
d
CC
d
d
−
+ −
=
+
. (14)Rank the alternatives with the value of CCi. The bigger
the value of CCi, the alternative has the less risk.
From the calculation results of proposed methods and TOPSIS listed in Table IV, it is clear that the rank results of proposed method and TOPSIS are different. The alternative 4 has the same position, but the rank order of alternative 1,2,3 are different. This is because TOPSIS method concentrate on how to balance the attribute values of alternatives, it take little consideration of the position in the rank order of attribute values. This means when an alternative with 8 attributes has 7 attributes values being in good position of the rank order, but has an attribute which values is extreme small, it is possible that this alternative can be rank last.
But the proposed method try to balance not only the attribute values but also the positions in rank orders of attribute values. So, for alternatives, like alternative 4, which have too much difference with others, the two methods will give the same rank orders, but for those which gap is not small, they will give different ranks owing to the characteristics of two methods, like the alternatives 1, 2, 3.
So the result is when the decision situation need to only consider the attribute values , the TOPSIS method is suitable, while when it is necessary to consider not only the attribute value but its rank position, the proposed method in this paper is suitable.
Moreover, Table IV also lists the results of the proposed method with ρ is equal to different values. It shows the calculation results may be different when
ρ
is set to be different values. When ρ =0.1, 0.3, 0.5, therank results are same. And when ρ=0.5, 0.9, the rank results are same. It is clear that when ρis bigger, the alternatives will take more consideration from the perspective of the rank position.
In brief, the proposed method in this paper not only balance the attribute values but also balance the position in rank orders. And ρ goes to bigger when the alternatives need to be taken more consideration of the position factors.
VI. CONCLUSIONS
Supply chain risk evaluation is an important part of supply chain risk management. To date, there have been a number of evaluation method. This paper develops a novel method based on grey relational analysis. And this method considers the overall risk level of criteria, takes the risk evaluation problem as the multi-criteria decision-making problem. Besides, to address the effectiveness of the proposed methodology, this paper compared the results of TOPSIS method and the proposed methodology. The result shows the advantages and application scope of the proposed method.
ACKNOWLEDGMENT
The authors gratefully acknowledge the financial support from Nature Science Foundation of Shandong Province(No.Y2007H23). The authors also would like to express appreciation to the anonymous reviewers for their very helpful comments on improving the paper.
REFERENCES
[1] Fischoff B., Watson S.R., Hope C., “Defining risk,” Policy
Sciences, vol.17, pp.123-139, 1984.
[2] Fischer G.W., Morgan M.G., Fischoff B., Nair I. Lave L.B.,
“What risks are people concerned about?,” Risk Analysis,
vol.11, no.2, pp.303-314, 1991.
[3] Sunil C., ManMohan S. S., “Managing risk to avoid supply
chain breakdown,” MIT Sloan Management Review, vol.
46, pp.53-61, Fall 2004.
[4] Simons R. l. , “How risky is your company?” Havard
Business Review, vol. 77, no.3, pp. 85-95, May-June 1999.
[5] Meulbrook L., “Total strategies for company-wide risk
control,” Financial Times, vol.9, pp. 45-57, June 2000.
[6] Smallman C., “Risk and organizational behavior: a
research model,” Disaster Prevention and Management,
vol. 5, no.2, pp. 12–26, 1996.
[7] Zhang Bingxuan, “Supply chain risk and distribution
model”, Quantitative & Technica Economics, no. 9,
pp.92-95, 2001.
[8] Dang Xianing, “The analysis and prevention of supply
chain risk,” Modernization of management, no. 6,
pp.45-48, 2003.
[9] Han Dongdong, Shi Guohong and Ma Hanwu, “Risk
Evading in Supply Chain Management, “ Industrial
Engineering Journal, no.3, pp.38-41, 2002.
[10]Lin Zhaoyang, “Supply chain risk and management”,
Journal of Guilin College of Aerospace Technology, vol. 9, no.3, pp.4-6, 2004.
[11]George A. Zsidisin, Gary L. Ragatz, and Steven A.
Supply Chain Management Review, vol.9, no.2, pp. 46-52, March 2005.
[12]Harland, C., Brenchley, R., and Walker, H., “Risk in
supply networks,” Journal of Purchasing and Supply
Management, vo1.9, no.2, pp.51-62, 2003.
[13]Crockford N., An Introduction to Risk Management,
Woodhead Faulkner, Cambridge. 1986.
[14]Williams T. M., “The two-dimensionality of project risk,”
International Journal of Project Management, vo1.14, no.3, pp.185-186, 1996.
[15]Stan Smith, Applying Risk Management to the Supply
Chain. Los Angeles Convention Center, 2005.
[16]Fu Yu, “Case-Based reasoning for supply chain risk
assessment”, Forecasting, no.1, pp.56-58, 2005.
[17]Ding Weidong, Liu Kai, Ke Guoxian, “The study on
supply chain risk”, China Safety Science Joural, vo1.13,
no.4, pp.64-66, 2003.
[18]Jiang Youling, Yang Jiaqi, Yin Liang, Yang jun,
“ANN-based comprehensive evaluation model of supply chain
risk and its application”, Journal of Wuhan University of
Technology(Transportation Science & Engineering), vol.32, no.1, pp.70-73, 2008.
[19]Jiang Xiaogan, Chen Fenglin and Wang feng, “Risk
analysis and assessment in supply chain network”, Journal
of Southeast University(Natural Science Edition), vol. 37, no. s2, pp.354-360, 2007.
[20]Xiao Meidan, Li Congdong and Zhang Yugeng,
“Assessment of supply chain risk based on uncertainty
theory and fuzzy method”, Soft Science, no. 5, pp. 27-30,
2007.
Peide Liu (China, 1966) graduated from the Southeast University and obtained the bachelor degree in electronic technology. And then he obtained his master degree in information processing in the Southeast University. At present, he is studying his in-service doctor of information management in Beijing Jiaotong University. His main research fields are technology and information management, decision support and electronic-commerce.
He was engaged in the technology development and the technical management in the Inspur company a few years ago. Now he is a full-time professor in Shandong Economic University and assistant director of the Enterprise’s Electronic-commerce Engineering Research Center of Shandong.