An Empirical Study About the Use and
Implementation of Software in Statistics at Higher
Education Institutions
SAID TAAN EL HAJJAR Assistant Professor Ahlia University Bahrain [email protected]
Abstract-- This study inspects features influencing the use and implementation of software in statistics at Higher Education Institutions with lectures learned from Ahlia University(AU) and the Arts, Sciences and Technology University of Lebanon(AUL).The aim of this research article was to examine and determine the factors which promote the use of statistical software in developing the teaching-learning process, and try to find out if it is possible to predict student capability for vocation success. Although the survey was done on two universities and we must be careful with final conclusions from the research group, the research shows that, in terms of technological competence, it is possible to predict student capability for vocation success in the practical line of works. The results were supported by experimental designs and statistical analysis outputs.
Index Term-- Knowledge, software, statistics, technology, understanding.
I. INTRODUCTION AND BACKGROUND
Statistical learning achievement may depend upon a productive quantity of features, one being teaching methodology, which may require for a close exploration into instructional pedagogy. E-Learning in statistics may not be an appropriate method of learning for everyone; therefore, E-learning in statistics should not be used as a E-learning approach to everlastingly substitute the traditional classroom learning process, but it should rather be used as an opening to balance traditional learning to support those pupils who need elasticity in learning statistics. Moreover, instructors nowadays are somehow dealing with digital students. Technology becomes fundamental to human continuation. At each phase within a century, humans continuously struggle to attain new skills or to improve presented ones in the hope that efficiency and quality of life are developed. Regardless of the truth that skilled statistical behavior emphasizes almost every student action, our sympathetic about the aspects that contribute to the achievement of proficiency in technology tutoring is far away from complete. Despite all the difficulties there are some endeavors to define technological competence. Technical abilities are defined as a complex interrelationship between psychomotor, cognitive, and effective area ( Dyrenfurth, 1990; Autio & Hansen, 2002). In fact, students strive to get technological knowledge. According to Dyrenfurth, pupils are
acquainted with some technological concepts, principles, and connections, as well as the nature and history of technology. A desire to change teaching strategy and methodology in statistics is needed. “There is a desire to change teacher preparation because of a perceived inadequacy in traditional teacher preparation programs” ( Russell et al. 2003). It is obvious that there is a philosophical shift in Education from the transmission of knowledge to Constructivist learning, whereas students are conducted as they construct on and adjust their existing rational models focusing on the construction of knowledge (Resnik, 1996). Initially, learners in statistics engage first in the contribution of incidents rather than the concepts. “students learn within specific contexts, while most importantly students are learning how to learn during a cyclical process where transitions help enhance students understandings of that context”( Salvin-Baden, 2000). Various types of learning knowledge such as lecture, case study, modeling, guided practice, activities…., require in statistics the design of a content record list that consists of all the various content support media that will be used in conjunction with the lesson. Thus, pedagogical factors refers to the pedagogical techniques and pleased improvement techniques used to clarify the content of the module so that it is offered precisely and obviously, with the suitable classification and presentation of the key points or rules to be learned. Every statistical tutorial session has an activity consultation, a conducted perform activity, and an activity debriefing related with it. When appropriately erected, the statistical tutorial session elements may be used as learning objects that may be used again in correlated instructional portions.
problems. Students has passed from traditional notes taken in classrooms during lecturing, books and photocopies to digital format of books or notes available in the subject’s web pages such as noodle, class server,…
Through the beginning of the computer era, didactical statistical examiners and practitioners have believed in technology use to be successful in our universities it needed to be closely tied to university reform. Glennan and Melmed (1995) wrote: "Technology without reform is likely to have little value: widespread reform without technology is probably impossible". The necessity deduction is that successful enhancement of technology, science, statistics and mathematics education is of high significance to our future, The future of technology. Most scientists indicates that improving mathematics, statistics and science education ranked next to national security and broadband internet access was one of the most significant concerns for improving economic growth in their companies. Setting the essential role of technology in today's world, this critical subject will inspect the value of successful technology use in classrooms with specific references to statistics, mathematics and science instruction, programs, and curricula.
II. SOFTWARE
Software is a general term for the various kinds of programs used to operate computers and related devices ( Whatis.com). Software can be thought of as the variable part of a computer and hardware the invariable part. Software is often divided into application software (programs that do work users are directly interested in) and system software (which includes operating systems and any program that supports application software). The term middleware is sometimes used to describe programming that mediates between application and system software or between two different kinds of application software (for example, sending a remote work request from an application in a computer that has one kind of operating system to an application in a computer with a different operating system).
Applets are small applications that sometimes come with the operating system as "accessories." They can also be created independently using the Java or other programming languages. Software is often packaged on CD-ROMs and diskettes. Today, much purchased statistic software, shareware, and freeware is downloaded over the Internet. A new trend is statistic software that is made available for use at another site known as an application service provider.
Some general kinds of application statistic software include:
Productivity software, which includes word processors, statistical spreadsheets, and statistical tools for use by most computer users
Presentation software for case studies in statistics
Graphics software for graphic statistical designers
CAD/CAM statistic software
Specialized scientific statistical applications
Vertical market or industry-specific software (for example, for banking, insurance, retail, and manufacturing environments)
III. RESEARCH QUESTION
The present study aims to determine features affecting the use and implementation of software in statistics at higher education institutions. In this paper, the research question is : 1- What will bethe impact of positive features related to the software implementation on student’s academic statistic achievement ?
2- What will be the difficulties met during the software implementation in the statistical lessons ?
IV. INPORTANCE OF SOFTWARE
The educational efficiency of the new advance in using statistical software has not been thoroughly tested. However, it is indicated that it will give students with an active learning environment that will eventually guide to concrete understanding of science concepts ( Jeschke, 2007).
In didactic frameworks like lectures and seminars, the use of software can be used for manifestations or self-study. In useful training, software can be used to prepare students for conducting their own learning experiments. The software experiments do not only aim at arbitrating notional knowledge but also to introducing into practical experimental work. Users can build up experimental designs for the different learning experiments ( Tompkins, 2000 ). The software experiments are complemented by integrated topical texts, instructions, glossary, and analyze the experimental data.
One of the difficulties met when in learning statistical topics is to understand the role of a specific theory, of a physical model experiment, of running data, and of testing hypothesis . These terms are blended frequently, and the traditional curriculum offering separate lectures for theory and experimental matters do not make it easier for students for really comprehension (Jeschke, 2007).
Statistic software represent an indisputable existence in nowadays university space everywhere in the world. It provides new possibilities of its using for the transformation and the enhancement of statistic teaching-learning process, raise the quality of education and meet the requirements set by the current knowledge culture. But there is always a question concerning the valuable use of software in the statistic teaching- learning process.
V. CASE STUDY
theoretical written proofs. However, these mathematicians and statisticians have forgotten that most of the students, nowadays, are no more theoretical students; they are, in fact, digital students that are living in a digital environment full of computers and technologies. So we, as lecturers, should believe in this reality and try to adapt with these new alterations. Our traditional and theoretical thoughts should be sorely developed and transformed towards applied mathematics and statistics whereas technology takes a broad place in the curriculum. I do believe that this alteration is not easy to many lecturers but also I am sure that once we intend to change, we will achieve this goal. The following case study is a good evidence to support my point of view. A business statistical problem will be solved in two ways: First, using the theoretical traditional method and second, using PHStat software.
You’re a financial analyst for a brokerage firm. Our aim is to test if there is a difference in dividend yield between stocks listed on the NYSE & NASDAQ. The following data are collected:
NYSE NASDAQ Number 21 25 Sample mean 3.27 2.53 Sample std dev 1.30 1.16
Assuming equal variances, is there a difference in average yield ( = 0.05)? using hypothesis test and p-value one at a time.
First Method ( Traditional)
Appropriate Null and Alternative hypothesis:
H0: μ1 - μ2 = 0 i.e. (μ1 = μ2)
HA: μ1 - μ2 ≠ 0 i.e. (μ1 ≠ μ2) (Two -Tailed test)
Since the population standard deviation is unknown, then we use t-distribution.
Critical Value of t
0154
.
2
025
.
0
,
44
2
/
05
.
0
,
2
25
21
2
/
,
2
2 1 2 /
t
t
n
n
t
t
Pooled Standard Deviation
Fig. 1. Description of the rejection region under the normal curve Decision :
Figure 1 shows that the t test statistic is equal to 2.040 which is greater than the critical value of t (t = 2.0154), then reject H0. Based on this sample data, there is 5% risk to believe that
the means are different. p-value approach
p-value , by definition, is equal to twice the probability of t greater or equal to t test statistics, then
.
047407
.
0
4762965
.
0
5
.
0
2
04
.
2
0
5
.
0
2
04
.
2
2
t
P
t
P
value
p
Decision :Since p-value = 0.047407 < = 0.05 , then reject H0. Based
on this sample data, there is 5% risk to believe that the means are different.
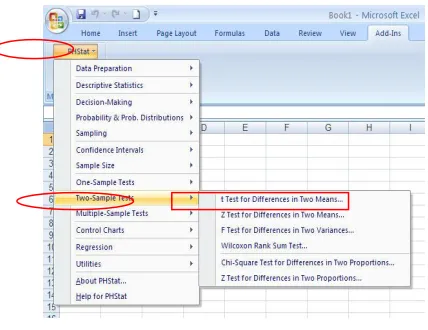
Second Method ( Using PHStat)
In this method and after opening a PHStat Excel worksheet, follow this pattern “Add-Ins | PHStat | t-Test: Two Sample
Assuming Equal Variances t-Test for Differences in Two
Means…” as indicated in figure 2.
Fig. 2. Book 1- Microsoft Excel, the t Test for differences in two means
Figure 2 indicates the chosen t Test differences in two means
This value is obtained from t-table
1.2256 2 25 21 1.16 1 25 1.30 1 21 2 n n s 1 n s 1 n s 2 2 2 1 2 2 2 2 1 1
p
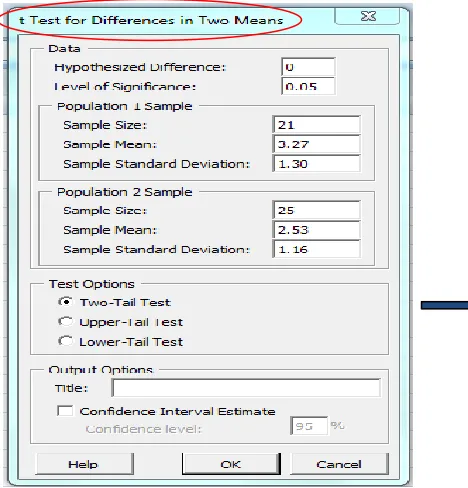
that satisfies our needed test. Then by clicking “OK”, a menu window is obtained and according to data given in the case study, these data should be filled there corresponding space in the window as indicated in figure 3.
Fig. 3.Data Input- t Test for differences in two means.
Once figure 3 is filled, press ”OK” to get the output indicated in figure 4.
The blue output in figure 4 is to assure what have been input of data in the window of figure 3. The yellow output is intermediate calculations done by the computer, and the pink output describes the values of critical value of t
),
0154
.
2
01537
.
2
(
of t – test statistics(2.039748
2.040), and of p-value (0.047407). Directly now these values could be compared to get the same decision clarified in the first method.As it is obvious, The first method needs a lot of theories and calculations to reach the desired decision, while the use of the software PHStat in the second method reaches the same decision in few steps.
Due to this transparency evidence, a general question would be raised : Does the use and implementation of software in statistics at higher education institutions satisfy students’ needs? To answer this question and the research questions of this study, a survey study was conducted at two higher institutions : Ahlia University (AU) in the Kingdom of Bahrain and the Arts, Sciences &Technology University of Lebanon (AUL).
Fig. 4. Data output- t Test for differences in two means.
VI. EMPIRICAL RESEARCH
The aim of this research was to examine and determine the influence of positive factors related to the statistic software implementation on student’s academic achievement. It was also aimed to discover the difficulties met during the software implementation in the statistical lessons. The study was conducted as a qualitative and quantitative case study and the collection of the data was performed using questionnaires. Later the research data were analyzed using descriptive statistics for sample results organized in Pie Charts. The analysis was conducted by assessing which of the vital software factors have positive effect on student’s academic achievement, and what difficulties could face this achievement during the software implementation in the lessons. These findings were later classified by the subjects and lastly reported in the conclusions. Our research questions were developed and tested through a questionnaire filled by a random sample of 78 students selected from the AU and AUL. Some statistical lecturers of these institutions use software tools in their teaching plans to clarify business statistical
t Test for Differences in Two Means
(assumes equal population variances)
Data
Hypothesized Difference 0
Level of Significance 0.05
Population 1 Sample
Sample Size 21
Sample Mean 3.27
Sample Standard Deviation 1.3
Population 2 Sample
Sample Size 25
Sample Mean 2.53
Sample Standard Deviation 1.16
Intermediate Calculations Population 1 Sample Degrees
of Freedom 20 Population 2 Sample Degrees
of Freedom 24 Total Degrees of Freedom 44 Pooled Variance 1.502145 Difference in Sample Means 0.74
t Test Statistic 2.039748
Two-Tail Test
Lower Critical Value -2.01537
Upper Critical Value 2.015368
p-Value 0.047407
Reject the null hypothesis
Input
concepts.
VII. HYPOTHESIS DESCRIPTION
Based on the previous description for the importance of implementing software in the statistical teaching-learning process, The following hypotheses were formulated.
Hypothesis 1 : The way used for presenting the statistical lessons in a software experiments has a positive effect on understanding.
Hypothesis 2 : The easy understanding of statistical concepts is due to the using of software experiments.
Hypothesis 3 : Software experiments are useful ways to acquire new knowledge in statistics.
Hypothesis 4 : Software experiments are useful ways to acquire new statistical skills.
Hypothesis 5 : Statistical software experiments are more applicable than the traditional ways.
Hypothesis 6: Software experiment could be considered as a whole teaching/learning process in statistics.
Hypothesis 7 : Software’s curriculums are well planned to achieve statistical concepts.
Hypothesis 8 : Using software in the statistical teaching/learning environment has sufficient time allocated for discussions.
Hypothesis 9 : Software experiments have in view more complex subjects.
Hypothesis10: Statistical software experiments have technical problems due to the insufficient specific hardware.
Hypothesis11: None difficulties were faced during the use of software experiments in statistical lessons.
Hypothesis12: Students are satisfied in using software experiments during statistical lessons.
Data was collected from questionnaires filled by students at two higher institutions : AU and AUL to explore the truth of these hypotheses in assuring their positive effect on the use and implementation of software in statistics at higher education institutions. The results of this data distribution are represented in the following charts:
The way used for presenting the statistical lessons in a software experiments has a positive effect on understanding
Fig. 5. Data output- Hypothesis 1
Interpretation
Figure 5 shows that 72 % of the students have agreement, whether it is strong or not, that the way used for presenting the statistical lessons in a software experiments has a positive effect on understanding. This indicates that the use of software experiments has a positive effect on the teaching/learning process in statistical lessons. So Hypothesis 1 is satisfied.
The easy understanding of statistical concepts is due to the using of software experiments.
Fig. 6. Data output- Hypothesis 2.
Interpretation
Figure 6 shows that although 60 % of the students have agreement, whether it is strong or not, that the easy understanding of statistical concepts is due to the using of software experiments, only 28 % contradict them and 12 % do not specify, which are not remarkable numbers. So Hypothesis 2 is satisfied.
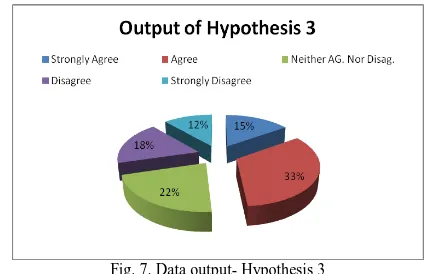
Software experiments are useful ways to acquire new knowledge in statistics
Fig. 7. Data output- Hypothesis 3
Software experiments are useful ways to acquire new statistical skills
Fig. 8. Data output- Hypothesis 4
Interpretation
Figure 8 shows that 69 % of the students have agreement, whether it is strong or not, that software experiments are useful ways to acquire new statistical skills. This indicates that Hypothesis 4 is satisfied.
Statistical software experiments are more applicable than the traditional ways
Fig. 9. Data output- Hypothesis 5
Interpretation
Figure 9 shows that 82 % of the students have agreement, whether it is strong or not, that statistical software experiments are more applicable than the traditional ways. This indicates that Hypothesis 5 is satisfied.
Software experiment could be considered as a whole teaching/learning process in statistics
Fig. 10. Data output- Hypothesis 6
Interpretation
Figure 10 shows that 66 % of the students have no agreement, whether it is strong or not, that software experiment could be considered as a whole teaching/learning process in statistics. This indicates that Hypothesis 6 is not satisfied.
Software’s curriculums are well planned to achieve statistical concepts
Fig. 11. Data output- Hypothesis 7
Interpretation
Using software in the statistical teaching/learning environment has sufficient time allocated for discussions
Fig. 12. Data output- Hypothesis 8
Interpretation
Figure 12 shows that 63 % of the students have no agreement, whether it is strong or not, that using software in the statistical teaching/learning environment has sufficient time allocated for discussions. This indicates that Hypothesis 8 is not satisfied.
Software experiments have in view more complex subjects
Fig. 13. Data output- Hypothesis 9
Interpretation
Figure 13 shows that although 44% of the students have no agreement, whether it is strong or not, that software experiments have in view more complex subjects, 37 % contradict them and 19 % do not specify. It is an ambiguous result and based on this sample data, Hypothesis 9 is inconsiderable.
Statistical software experiments have technical problems due to the insufficient specific hardware
Fig. 14. Data output- Hypothesis 10
Interpretation
Figure 14 shows that 65 % of the students haveagreement, whether it is strong or not, that Statistical software experiments have technical problems due to the insufficient specific hardware. This indicates that Hypothesis 10 is satisfied.
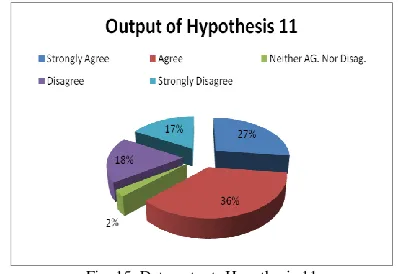
None difficulties were faced during the use of software experiments in statistical lessons
Fig. 15. Data output- Hypothesis 11
Interpretation
Students are satisfied in using software experiments during statistical lessons
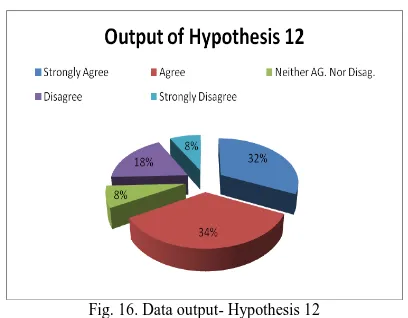
Fig. 16. Data output- Hypothesis 12
Interpretation
Figure 16 shows that 66 % of the students have agreement, whether it is strong or not, that students are satisfiedin using software experiments during statistical lessons. This indicates that Hypothesis 12 is satisfied.
VIII. CONCLUSION
The research study was done through two different higher institutions in two distinct countries. The obtained results, negatives or positives, were almost directed in the same way. Despite the few negative technical comments in the significance of the use and implementation of software in statistics at Higher Education Institutions, several positive comments supported it; especially in the academic fields such as motivation, understanding, skills, knowledge, facilitation, application and satisfaction. However, this study discovered some negative factors to be modified. Based on this sample study, students believed that the use and implementation of software experiment during statistical lessons should not be considered as a whole system in the teaching/learning process but it is very useful in clarifications. Also the use of software in the statistical learning environment had no sufficient time allocated for discussions. Software experiments had technical problems due to the insufficient specific software but at the time these problems have been solved, students, according to the survey results, did not face difficulties during the use of software experiments in statistical lessons. In addition, this survey failed to test the factor that software experiments had in view more complex subjects due to the ambiguous output of this issue. Nowadays, many academicals institutions established computer labs in their campuses; so they can get benefit from that not only by learning computer as software or a hardware instrument but also as a tool to improve the statistic teaching/learning process.
Furthermore, our aim from this study was for guiding pupils and lecturers in Higher Education Institution to grasp the needed knowledge in statistics, but sometimes this knowledge could not be reached through theoretical strategies especially
in statistics; therefore, there should be another applicable ways for clarifications such as the software used in statistics . From our survey, everyone could recognize that software experiments could be used in any academically institution through all countries in the world.
Finally, the statistical case study, which was described in this research study, was a convincing evidence to prove how statistical concepts could be treated among pupils throughout the world, which would be a good reason for contribution to knowledge.
REFERENCES
[1] Autio, O. & Hansen, R. (2002). Students’ Technical Abilities in Finish Comprehensive Schools. Journal of Technology Education, 14 (1), 5-19.
[2] Dyrenfruth, M.(1990). Characteristics and competencies, revealed and detailed. In H. \ Szydlowski, & R. Stryjski, technology and School: Report of the PATT conference , 26- 50. Zielona Gora, Poland: Pedagogical
University Press.
[3] Glennan and Melmed, (1996). Technology without reform is likely to have little value: Widespread reform without technology is probably impossible.Technology : A Catalyst for teaching and learning in the classroom, XiX –XX.
[4] Jeschke, S., Richter T., Schul, H., & Thomson, C. ,(2007). On Remote and Virtual Experiments in e-learning. Journal of Software, 6, 76-85.
[5] Resnick, M., (1996). Beyond the Centralized Mindest. Journal of the Learning Sciences, 5 (1), 1-22.
[6] Russell, M.et al., (2003). Examining Teacher Technology Use. Journal of Teacher Education,54 (4), 297-310.
[7] Salvin-Baden, M., (2000). Problem-based Learning in Higher Education: Untold Stories. Philadelphia, PA: Open University Press.
[8] Tompkins, P., Perry, S., & Lippincott, J.K.,(2000). New Learning Communities: Collaboration, networking and information literacy. Information Technology and Libraries, 17, 100-106. [9] What is Software? www.searchsoa.techtarget.com. Definition