Diftong: a tool for validating big data
workflows
Raya Rizk
1*, Steve McKeever
1, Johan Petrini
2and Erik Zeitler
2Introduction
Due to the rapid development of data there has been an exponential growth in the num-ber of applications that use big data techniques [1]. Many applications and workflows that process data in diverse domains and transform them into business value have been developed. In order for those transformations to provide solutions for business problems in organisations, it is necessary to perform data analysis based on valid inputs and then ensure the correctness and accuracy of the outputs produced at later stages [2]. Thus, process validation is necessary to check the results with the expected behaviour [3].
The demand for implementing effective and efficient validation methods has increased in order to ensure data quality in all processing phases [4]. Data quality can be defined as the degree to which the state of data serves its purpose in a given context [5]. According to Experian Data Quality [6], 75% of businesses are wasting an average of 14% of their revenue due to poor data quality. In addition, Gartner research indicates that the average annual impact of such low data quality on organisations is as high as $9.7 million [7]. This can also be linked to IBM’s estimation in 2016 [8], where they stated that the yearly cost of poor quality data in the US alone was $3.1 trillion. This is likely to worsen with the increased amount and complexity of data. It
Abstract
Data validation is about verifying the correctness of data. When organisations update and refine their data transformations to meet evolving requirements, it is imperative to ensure that the new version of a workflow still produces the correct output. We motivate the need for workflows and describe the implementation of a validation tool called Diftong. This tool compares two tabular databases resulting from different ver-sions of a workflow to detect and prevent potential unwanted alterations. Row-based and column-based statistics are used to quantify the results of the database compari-son. Diftong was shown to provide accurate results in test scenarios, bringing benefits to companies that need to validate the outputs of their workflows. By automating this process, the risk of human error is also eliminated. Compared to the more labour-intensive manual alternative, it has the added benefit of improved turnaround time for the validation process. Together this allows for a more agile way of updating data transformation workflows.
Keywords: Big data, Data testing, Data validation, Data quality, Big data validation process, Big data validation tool, Big data workflow
Open Access
© The Author(s) 2019. This article is distributed under the terms of the Creative Commons Attribution 4.0 International License (http://creat iveco mmons .org/licen ses/by/4.0/), which permits unrestricted use, distribution, and reproduction in any medium, provided you give appropriate credit to the original author(s) and the source, provide a link to the Creative Commons license, and indicate if changes were made.
METHODOLOGY
is critical to maintain the quality as it is essential to derive value from data that can have a profound impact on companies decision-making processes [9].
However, the large volume and fast velocity in which heterogeneous data is being generated and processed makes measuring data quality difficult [2]. Most big data sets lack clear structure since the data are extracted from a diversity of data sources. This poses challenges on big data testing processes [10]. Furthermore, manual data valida-tion is difficult and inefficient [3] as mentioned in the Harvard Business Review [11] where about 50% of knowledge workers’ time is wasted trying to identify and correct errors. Thus, automated validation is required to detect the effect of every data trans-formation that has occurred. Numerous papers have been published concerning big data and their applications, but they seldom address the validation process [3] and how to assure data quality during different stages of a big data application [5]. Most of the current tools only provide the common basic data validation functions, such as checking null values and data types, ranges, and constraints [5]. Thus, a more detailed data validation process that examines all values in a data set and detects potential errors is still lacking.
Companies develop workflows (data transformations) to process data continuously. Such workflows define and manage a series of steps that process and transform data [12]. They then store the new results in databases to be used for planning and decision-mak-ing, or as inputs to other workflows. This process can be protracted and complex as it deals with a large amount of data with many integrations. Consequently, managing such workflows can be difficult [13] and deploying them without validation can lead to unde-sirable outputs [3].
Driven by evolving business needs and due to the rapid increase in the volume and variety of data, these workflows often need to be improved and updated. A workflow can be improved through the implementation of more efficient and optimised transforma-tions. The updates can be related to the inclusion of new data models or meeting chang-ing business requirements. In addition, any infrastructure upgrade can affect the results of a transformation even if no changes to the workflow were conducted.
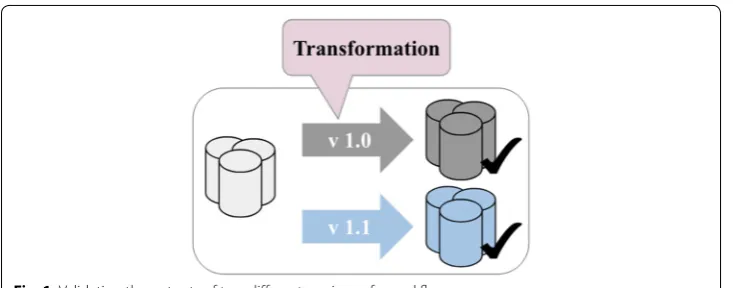
It is imperative to implement a data validation tool that automatically compares the outputs of a pre-updated workflow and its post-update counterpart. This is accom-plished by taking the same inputs and indicating whether the results of the new work-flow match the previous one, or whether it produces incorrect results, as illustrated in Fig. 1. Laranjeiro et al. [14] present an approach to test data-centric services with poor quality data and no validation. Their study highlighted vulnerabilities arising from poor data at both the application level but also at the middleware level too.
The following two examples illustrate how Klarna leverages automatic comparison of databases in order to improve their company workflows:
Credit risk assessment capabilities A workflow (w1) produces data for real-time credit risk assessment and decision making. To enhance data freshness w1 was ported to a faster execution engine resulting in a new version of the workflow (w2). After running w1 and w2 side by side on the same input and doing automatic comparison of their respective result databases, some differences were identified. A root cause analysis was initiated with an effort to discard any potential non-deter-ministic behaviour within the workflow. This was accomplished by running w1 in parallel with itself (w1baseline ). The same differences were noticed for w1 and w1baseline . Since the non-determinism was benign, it was concluded that enhancing data freshness, by moving to a faster execution engine, did not introduce any errors and the workflow was deployed in production.
Fraud risk assessment capabilities A workflow (w1) produces data for real-time fraud risk assessment and decision making. To enhance data freshness w1 was ported to a faster execution engine (w2). An automatic comparison of w1 and
w2’s result databases showed some differences. Running w1 against w1baseline resulted in the same differences and identified non-determinism in the workflow. However, this time the differences were not benign but a consequence of semantic incon-sistencies in the data. After updating the workflow to eliminate those inconsistencies, w1 and w2 were once again run in parallel. Their respective result databases were compared, found to be identical
and the workflow was deployed in production. In this case, not only did the comparison give at hand that moving to a faster execution engine did not introduce any errors in the data, it also resulted in improved data quality.
In Klarna, automatic comparison of databases enables a more agile approach to work-flow improvements and updates. More specifically, such comparisons:
1. Reduce the delay in improving workflow performance. This occurs through the rapid identification of any differences (rows and columns) in the result data produced by two versions of a workflow. This in turn makes it easier for the workflow owner to trust and verify the correctness of the improvement.
2. Improve the quality of the data due to easier identification of issues such as corrupt information and inconsistent semantics.
This paper presents a general solution for comparing any two databases that have the same schema. We will only focus on parts of the process validation stage of the over-all big data testing process and not on the data staging or output validation that are explained later in the "Background" section.
The paper is structured as follows. The remainder of this section presents some related work in the field. In addition, it describes the background and covers the concept of big data, its testing and validation, in addition to the development frameworks that are used in this project. A detailed explanation of the proposed validation process and its imple-mentation is listed in Section two. Section three introduces Diftong, our validation tool, and shows two test cases then analyses and discusses the results. Conclusions are pre-sented in Section four.
Related work
Validation techniques have struggled to cope with the exploding size of data. Current research in big data quality considers the issue in broad terms, but there is little focus on how to effectively validate big data applications. Gao et al. [5] discuss big data validation and quality assurance by focusing on validation processes which includes data collec-tion, cleaning, transformacollec-tion, loading, analysis, and reporting. Their study presents a comparison of eight existing data validation tools concluding that all of them provide the basic validation criteria that are set in the paper such as checking data types, formats, ranges, logic, and null values, even if this comes with some limitations.
this field should be conducted as only few published papers addresses big data validation methods.
Other studies focused on the general concept of data quality applied to big data. Firmani et al. [16] highlight that it could be challenging to define a unique concept of big data quality due to the fact that data quality is multidimensional and difficult to characterise even in the case of structured data. The authors attempt to define a method to apply the various notions of quality to specific types of big data. Accord-ing to a classification proposed by the United Nations Economic Commission for Europe (UNECE), there are three main types of data sources in relation to big data:
human-sourced information, process-mediated, and machine-generated sources. The paper describes a data model for each data source by quantifying data quality and its dimensions (accuracy, correctness, redundancy, readability, accessibility, consistency, usefulness, and trust) using metrics specific to the context and based on the charac-teristics of big data.
The overall aim of the study is to identify further research directions in the area of big data quality, and which was the base of another study conducted by Arolfo et al. [17] later on. In their paper [17], the authors also argue that data quality is depend-ent on the context and relative to the problem to be solved. In other words, differdepend-ent data quality dimensions and metrics can be considered for various applications areas. The paper defines how data quality dimensions can be used in a real-time scenario to address the quality of Twitter feeds. Thus, the study focuses on the human-sourced information type in reference to Firmani et al. [16], and only considers metrics for four dimensions related to this data source (readability, completeness, usefulness, and trust). On the other hand, our study can be considered as a part of the process-medi-ated type since it concerns banking, transactions, and e-commerce. Hence, the data is more structured than in the human-sourced generated type. As a result, the accuracy dimension (that is explained in "Background" section later) provides a valuable tool for improving the overall data quality in this type of applications as it deals with the closeness of values to a what is considered as the correct representation.
Both studies [16, 17] have emphasised that more research in the area is needed, as there has not been much work regarding data quality in the context of big data despite of the relevance of the topic.
There are some tools that attempt to validate big data. QuerySurge [18] is a tool that compares data that reside in two data stores (source and target). The input of this tool is two queries (QueryPairs) to be run against both source and target data stores, and the output is reflected in showing the difference in row numbers along with listing the values that differ in both stores. The tool comes with some limitations regarding a maximum row size of a result set and a maximum number of QueryPairs to compare in one run. QuerySurge is a closed source software that can be distributed under a licensing agreement.
statistics and corresponds to the column validation step in Diftong, and which is a part of the whole validation process that is proposed in this paper.
Background
Relational Database Management Systems (RDBMS) have been the dominant model for more than 40 years. The relational model has a rigid schema with a clear struc-ture [20]. Despite the robustness of RDBMS, it has limitations. It cannot handle the increasing size of data or process unstructured information [20].
Big data is more than just size, it is also varied and fast-growing. Hence it poses challenges to data management [21]. Non-relational databases do not use the RDBMS principles and do not store the data in tables [20]. The main characteristic of these databases is having a schema-free [22] format that results in unstructured data that the user has to interpret when retrieving it. The absence of structure, rules, and con-straints makes it difficult to maintain clean and correct data without duplicates. It also affects the overall quality of information and introduces complexity in the testing and validation processes.
Testing software that uses big data techniques is significantly more complex than testing other more traditional data management applications. Simple test cases can-not be used for big data applications as processing the data requires that it be trans-ferred and transformed at different points during each process of the application, costing time [1]. In order to test big data applications effectively, continuous valida-tion throughout the transformavalida-tion stages is advocated [23].
There are different types of tests that can be conducted to maintain the standard of data. Data quality includes various dimensions that should be measured such as data accuracy, correctness, redundancy, readability, accessibility, consistency, usefulness, and trust [24]. Data accuracy is usually measured by comparing the data in multiple data sources, as this quality factor refers to how close the results are to the values that are accepted as being true [5]. We mainly focus on this factor in the validation of data in our work.
The processing of big data, and thus its validation, can be divided into three differ-ent stages [25] as shown in Fig. 2:
1 Data staging: Loading data from various external sources. Validation includes verify-ing that the needed data were extracted and retrieved correctly, then uploaded into the system without any corruption.
2 Processing: In this step, it is required to validate the results of a parallelized job appli-cation and other similar big data appliappli-cation processes, while ensuring the accuracy and correctness of the data.
3 Output: Extracting the output results, and where validation includes checking whether the data have been loaded correctly into the target system for any further processing.
parallelizing the work across multiple nodes, effectively moving the computations closer to the data [27]. This helps with solving problems on large and complex data sets in a reliable manner, as it also provides automatic fault tolerance and recovery.
Apache Hive is a data warehouse built on top of Hadoop [28] to reduce the complexity of big data frameworks to gain easier access to the desired data. Due to the limited query capabilities of Hadoop and the complexity of the MapReduce framework, developers were required to write complex programs that might be hard to maintain and reuse even for simple analysis [29]. In contrast, Hive supports queries expressed in a declarative language similar to SQL—called HiveQL—and has its own Data Definition Language (DDL) and Data Manipulation Language (DML) commands. Those queries are compiled into MapReduce jobs that use the parallel processing in Hadoop [30]. Hive also provides a mechanism to project structure onto the large volume of data that reside in distributed storage. It facilitates the management of these data sets by executing queries using an SQL-like query language as it makes the data in Hadoop look like it is stored in tables that consist of a number of rows, and each row has a specified number of columns [29].
In order to make sense of the unstructured nature of big data, a certain level of meta-data is to be expected. In Hive, this is commonly achieved through a meta-store service; it is a system catalog, created in a RDBMS, that contains within itself information and details about the objects definitions (schemas, tables, partitions, columns, etc.) [30]. By separating parsing instructions from the actual data, the meta-store acts as a form of index for otherwise impenetrable data files. In addition, meta-store deals with supple-mentary statistics concerning the data, providing utility in data exploration, query opti-misation, and query compilation [29].
Conventionally, MapReduce has been the engine used to run Hive jobs in Hadoop. MapReduce has gradually been replaced by other more efficient execution engines, such as Tez and Spark. These execution engines are capable of executing more efficient Hive
query execution plans, and are overall more resource efficient [30]. In particular, we have seen how one single Tez job can replace multiple MapReduce jobs in the applications.
A number of configuration variables in Hive are available to change the behaviour of the default installation settings. For instance, in order to get the number of rows in a table faster, Hive provides configurations to store the results of some queries—such as the COUNT statistics—in the meta-store [31]. This optimises the statistics collection as the values will be read from the meta-store directly instead of being calculated each time. Those variables can be configured using the SET command that works on a session level [32]. In addition, setting the “hive.stats.autogather" configuration to “true" enables automatic gathering and updating of statistics during operations, and “hive.compute. query.using.stats" answers queries like MIN, MAX, and COUNT solely using statistics stored in the meta-store.
Methods and implementation
This section describes the implementation of Diftong, which enables large scale valida-tion of heavyweight data transformavalida-tions. A small running example is used to illustrate the steps of the process.
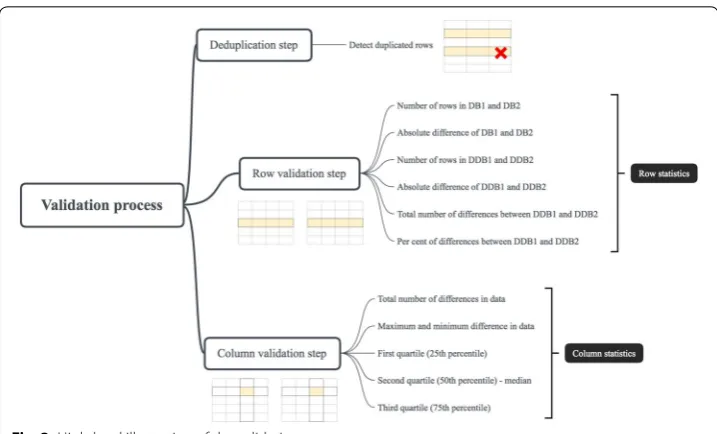
To provide an overview of the changes, Diftong generates a statistical summary on both row and column levels for all tables. Furthermore, to help analysts and engineers perform root cause analysis of changes, Diftong also provides a detailed description of each difference in the form of a change capture. The validation is performed in three stages: Deduplication, Row validation, and Column Validation. Figure 3 displays a high-level illustration of the validation process with a summary of the generated statistics.
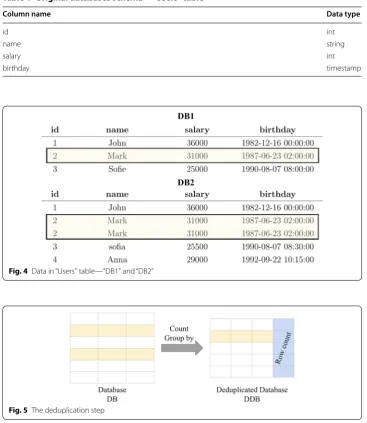
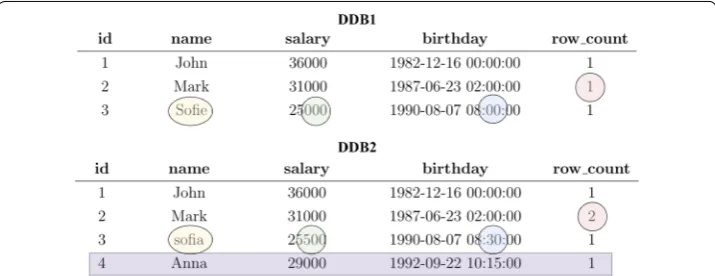
Our running example consists of two databases “DB1" and “DB2" with identical sche-mas that are to be validated. Each database contains a table named “Users" with four col-umns (id, name, salary, and birthday) as displayed in Table 1, while Fig. 4 shows the data in the “Users" table present in both databases.
The validation stages are further detailed in the following sections.
Deduplication
As key constraints are not necessarily enforced in Hive, duplicate rows may be pre-sent. A duplication in data is where all values in one row match exactly all the values in another row. Each row in both databases is counted and the results are stored for use in subsequent stages of the validation process. Figure 5 illustrates the deduplica-tion step.
Based on the data in the “Users" table that is shown in Fig. 4, all records appear once in each table except for the record with the id=2 in “DB2". This record has two iden-tical rows where the values of all columns are equal. Hence, the COUNT for all the rows is 1 except for the record with the id=2 in “DB2", which is 2 instead.
Table 1 Original databases schema—“Users” table
Column name Data type
id int
name string
salary int
birthday timestamp
Fig. 4 Data in “Users" table—“DB1" and “DB2"
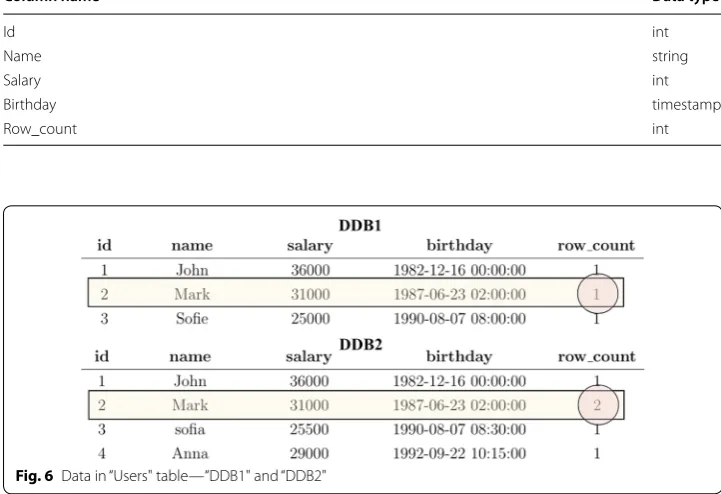
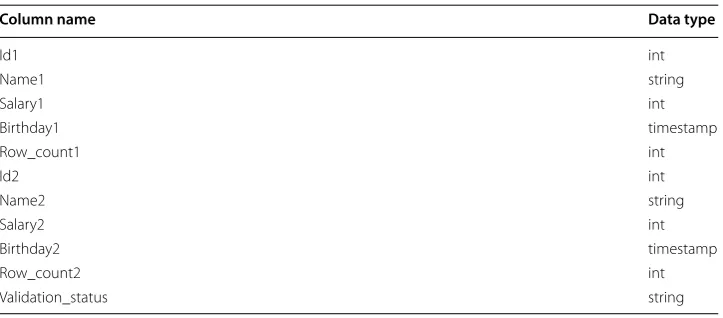
After the deduplication step, two new databases are created. Each database contains the same tables and data as the original databases before deduplication, but with one additional column “row_count" that shows the number of times each row appears in a table. Table 2 displays the schema of the databases “DDB1" and “DDB2"—dedupli-cated copies of “DB1" and “DB2" respectively—while Fig. 6 shows their data.
The results show that the different number of records for the user with id=2 is detected. With this count in place, it is easy to spot this discrepancy in the row valida-tion stage described next.
The implementation steps for the deduplication stage are as follows. First, a dedupli-cated database instance is created by extracting all “CREATE TABLE" statements from DB1 and DB2. Each table is extended with an additional column called “row_count" as displayed in Script 1. By using COUNT and GROUP BY in this script, all duplicates in the original database are represented in the new deduplicated database using only one row with the extra column “row_count".
CREATE TABLE IF NOT EXISTS{deduplicated database name}.{table name}AS SELECT{columns names},COUNT(∗)ASrow count
FROM{original database name}.{table name} GROUP BY{columns names};
Script 1Template for creating a table in the deduplicated database
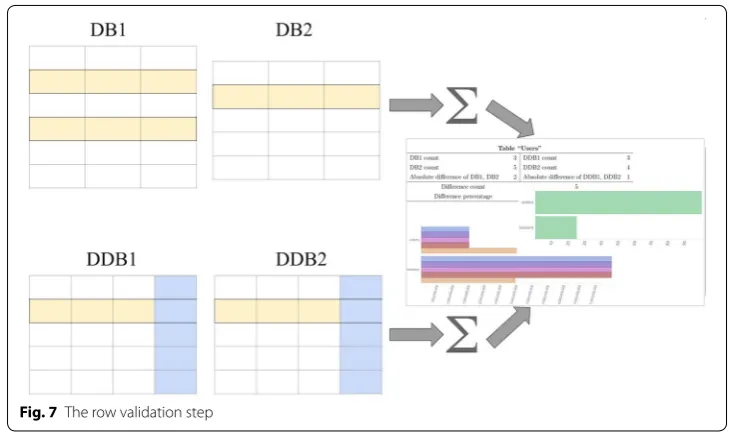
Row validation
In order to get an overview of the total number of changes in each table, the differences between the rows of all tables in the two deduplicated databases are calculated. Consider the case of two databases “DB1" and “DB2", deduplicated respectively into “DDB1" and
Table 2 Deduplicated databases schema—“Users" table
Column name Data type
Id int
Name string
Salary int
Birthday timestamp
Row_count int
“DDB2". Figure 7 shows a simple representation of this step where the following statis-tics are generated:
To calculate the number of differences in the data values of each row (7) as a per cent (8), there is a need to detect which records in each table from “DDB1" have been changed in “DDB2" and what those changes are.
Figure 8 illustrates the differences in the values of all rows and columns in the “Users" table. It can be seen that five rows out of seven are different between “DDB1" and “DDB2", thus the difference is 71.4%.
As a result, Table 3 displays the calculated row statistics for the “Users" table and depicts the number of changes on a row-based level with the difference as a per cent.
We describe how these statistics, from (1) to (8), are calculated as follows:
Row statistics (1), (2), (4), and (5): COUNT(*) in Hive is used to calculate the total number of rows in all tables of the databases “DB1", “DB2", “DDB1", and “DDB2".
(1) Number of rows in DB1
(2) Number of rows in DB2
(3)
Absolute difference of DB1and DB2
(4) Number of rows in DDB1
(5) Number of rows in DDB2
(6)
Absolute difference of DDB1and DDB2
(7) Total number of differences between DDB1and DDB2
(8) Per cent of differences between DDB1and DDB2
Row statistics (3) and (6): The absolute difference of the number of rows between (“DB1", “DB2") and (“DDB1", “DDB2") is calculated using the function ABS in Hive.
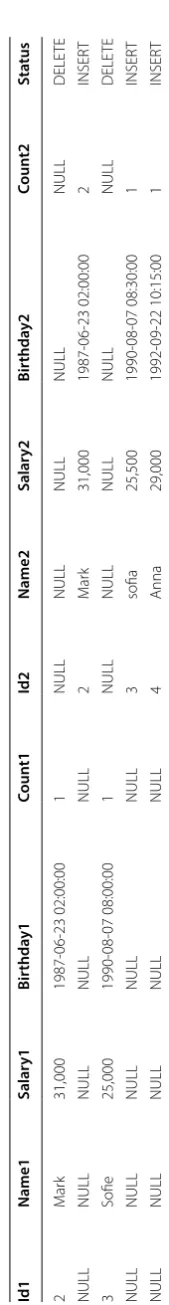
Row statistics (7): To calculate the total number of differences in the data of each table in “DDB1" and “DDB2", there is a need to compare the values in each row and detect any potential changes. Those differences and changes are referred to as the “delta" values. The differences are stored in row delta tables that help in generating the related statistics at a later step in this validation stage. The chosen method to store the delta tables is to create a new database that is used for both row and column validation stages.
One way to reflect changes in data is to represent each change as a record in the delta table. Each record contains the affected values with a validation status. The validation status can be either INSERT (when there is a new record in “DDB2" that does not exist in “DDB1") or DELETE (when a record exists in “DDB1" but not in “DDB2"). Note that the UPDATE status is actually a DELETE operation followed by an INSERT of the new values.
Table 4 displays an example of a possible representation of the differences that are shown in Fig. 8 for “Users" tables in both deduplicated databases, along with the related delta validation status. In other words, and based on the validation status of each record of the row delta calculation, applying the changes in sequence on the related table in the first deduplicated database will result in the data of the same table in the second one.
In order to implement the previous representation using Hive, delta values are calcu-lated and stored in the newly created delta tables based on Script 2. The row delta table contains all columns from both tables that are being compared along with the validation status that indicates what kind of change (INSERT or DELETE) has occurred on the data
Fig. 8 Row differences between “Users" table in “DDB1" and “DDB2"
Table 3 Row validation statistics—“Users" table
DB1 count 3 DDB1 count 3
DB2 count 5 DDB2 count 4
Absolute difference of DB1 and DB2 2 Absolute difference of DDB1 and DDB2 1
in those tables. Table 5 shows the schema of the newly created validation database “Vali-dationDB" with the “Users_row_delta" table.
In Script 2, a full join between the tables in “DDB1" and “DDB2" is applied based on a unique value that identify each record, and the related validation status is then calcu-lated. Lastly, the result is filtered to get the rows that are only represented in either table. Note that since there are no primary keys to identify the rows in a big data set, a new user defined hash function, “multi_hash", was implemented to generate a unique identi-fier for each row based on the values in all its columns. The function “multi_hash" takes one input argument as an array of strings and concatenates its values taking into account the length of each string, then returns the SHA-512 hash for the concatenation of all string values in the input array. This is done to prevent any collision that might appear from moving text from one string to the next. Thus, moving any text will not produce collisions since the lengths would change. As an example, applying “multi_hash" func-tion on the array of strings [‘hello’, ‘world!’] (the concatenafunc-tion is ‘hello5world!6’) results in a hex string that is different than the generated hash from the same function for the array [‘hellow’, ‘orld!’], (the concatenation is ‘hellow6orld!5’) as the length of each word is taken into account. The hash value that was obtained from “multi_hash" is then used to compare and join similar records in those tables.
Table 4 Validation status for row delta table—“Users" table
Id Name Salary Birthday Row_count Validation_status
2 Mark 31,000 1987-06-23 02:00:00 1 DELETE
2 Mark 31,000 1987-06-23 02:00:00 2 INSERT
3 Sofie 25,000 1990-08-07 08:00:00 1 DELETE
3 Sofia 25,500 1990-08-07 08:30:00 1 INSERT
4 Anna 29,000 1992-09-22 10:15:00 1 INSERT
Table 5 Validation database schema—“Users_row_delta" table
Column name Data type
Id1 int
Name1 string
Salary1 int
Birthday1 timestamp
Row_count1 int
Id2 int
Name2 string
Salary2 int
Birthday2 timestamp
Row_count2 int
CREATE TABLE{validation database name}.{row delta table name}AS SELECTddb1.{columns names}, ddb2.{columns names},
CASE WHENddb1.hashIS NULL THEN’INSERT’ELSE’DELETE’END ASvalidation status
FROM
(SELECTmulti hash(ARRAY({columns names}))AShash,∗ FROM{deduplicated database1 name}.{table name}) ddb1 FULL JOIN
(SELECTmulti hash(ARRAY({columns names}))AShash,∗ FROM{deduplicated database2 name}.{table name}) ddb2 ON(ddb1.hash = ddb2.hash)
−−Look for all the rows that are only represented in either table WHEREddb2.hashIS NULL ORddb1.hashIS NULL;
Script 2Template for creating a row delta table in the validation database
As a result, Table 6 displays the items of data that have been changed with the related validation status column as the result of applying Script 2 on the “Users" table. A bet-ter representation of the data in “Users_row_delta" table is shown earlier in this section using Table 4.
After extracting the results from the row validation delta tables, the total number of differences in values of rows between “DDB1" and “DDB2" can be calculated based on counting the number of rows in those row delta tables in the validation database using COUNT(*).
Row statistics (8): The per cent difference in each table is calculated by dividing the total number of differences that are calculated in (7) by the sum of the number of rows in both deduplicated databases tables, then multiplying the result by 100 and rounding it to one decimal place.
Running the “ANALYZE TABLE .. COMPUTE STATISTICS" query on all tables in “DDB1" and “DDB2" and on all row delta tables in the validation database helps in opti-mising the calculation of row statistics [31]. Note that tables in “DB1" and “DB2" were already analysed during the deduplication phase.
Column validation
Starting from the results of the row validation step, column based statistics are calculated for the tables that contain differences in order to get a deeper insight of the changes. It is important to first know how many changes have occurred and in what range. This can be achieved by calculating the total number of differences along with the minimum and maximum difference in the data. Calculating the average was also considered at the beginning but it did not give much added value to the results, so it was excluded from the generated statistics at a later stage.
Consequently, the following statistics are generated for each column in the tables that are being validated:
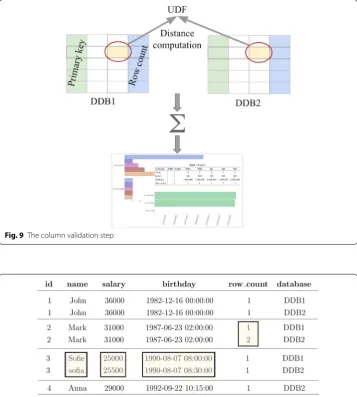
Consider the case of two databases “DDB1" and “DDB2", deduplicated copies of “DB1" and “DB2", in addition to a validation database “ValidationDB" that contains the row delta tables from the previous step. In order to generate the previous statistics, there is a need to compare and calculate the delta between each value inside the tables of “DDB1" and the related one in “DDB2". Figure 9 illustrates how each value is being compared in order to generate the needed statistics.
Figure 10 shows the differences in values of the columns in the “Users" table between “DDB1" and “DDB2". It can be seen that there is one difference in each of the columns. Note that any identical rows in both databases (such as the record with id=1 ), or rows
that only exist in one of the databases (like the record with id=4 ) will not be a part of this validation stage.
As a result, Table 7 displays the calculated column statistics for the “Users" table. It shows the total number of differences in the data along with the related maximum and minimum delta values. In addition, it displays the three quartile values of each column. Notice that the numbers in all statistics match in this example due to having a single dif-ference in each column.
The implementation of the column validation step starts with comparing the values in each column and calculating the delta between them. The differences are stored in new delta tables that help in generating the related statistics at a later step in this vali-dation stage. Similar to the row valivali-dation stage, the column delta tables are stored in “ValidationDB".
For each record, the differences between all columns are calculated and stored in col-umn delta tables that have the schema shown in Table 8.
CREATE TABLE{validation database name}.{col delta table name}AS
SELECTdelta1.{column id}, calc diff(delta1.{columns names}, delta2.{columns names}) AS{columns names}diff
FROM{validation database name}.{row delta table name}delta1 JOIN{validation database name}.{row delta table name}delta2 ON(delta1.{column id}= delta2.{column id});
Script 3Template for creating a column delta table in the validation database
Based on the data of row delta tables in “ValidationDB" (Table 6 is given as an exam-ple), column delta tables are generated using Script 3. First, a self join is applied on the row delta tables based on the id column of both “DDB1" and “DDB2" tables. Note that the id column should be provided by the user due to the lack of primary keys when (9)
Total number of differences in data
(10)
Maximum difference in data
(11)
Minimum difference in data
(12)
First quartile(25th percentile)
(13)
Second quartile(50th percentile)−median
Fig. 9 The column validation step
Fig. 10 Column differences between two tables in “DDB1" and “DDB2"
working with big data. Then, and for each column, the difference between all values of the tables in both deduplicated databases is calculated with the help of a user defined function, “calc_diff", that takes two values of the same type (integer, double, string, date, timestamp, or boolean) as parameters then calculates and returns the delta between them.
As a result, Table 9 displays the result of running Script 3 on “Users_row_delta" table. Note that NULL is stored if both values that are being compared are identical, i.e. the delta is equal to zero, or if both inputs are NULL.
Starting from the values in the column delta table, column statistics, from (9) to (14), are generated. A description of how they were generated is provided as follows:
COUNT using the statistics that are stored in the meta-store instead of calculating them each time.
Consequently, and in addition to analyzing the tables as in the row validation step, another script “ANALYZE TABLE .. COMPUTE STATISTICS FOR COLUMNS" [34] is executed to analyse column delta tables in “ValidationDB" and compute column-level statistics for all existing columns.
As for the next step, executing “DESCRIBE FORMATTED" script in HiveQL [34] on all the columns that hold information regarding the existing differences will generate the needed numbers to be used in the column statistics. The minimum and maximum values of differences are obtained along with the number of null values in each column, which reflect that no changes have been made to the data in the related fields of that column. As for the total number of changes, it is calculated by the subtraction of the number of null values from the total number of rows in the delta table. The latter is generated using COUNT(*).
Column statistics (12), (13), and (14): Hive provides a function called percentile that can be used to calculate the lowest and highest quartile of a data set along with the median value “percentile (BIGINT col, array (p1 [, p2] ... ))" [34]. This function cal-culates the specified percentiles for a data set, which is the list of differences for each column in this case. The provided percentile values are (0.25, 0.5, 0.75) as 25%, 50%, and 75% reflect the values of Q1, Q2, and Q3.
Table 7 Column validation statistics—“Users" table
Column Difference
count Max Min Q1 Q2 Q3
Name 1 2 2 2 2 2
Salary 1 500 500 500 500 500
Birthday 1 1,800,000 1,800,000 1,800,000 1,800,000 1,800,000
Row count 1 1 1 1 1 1
Table 8 Validation database schema—“Users_col_delta" table
Column name Data type
id int
name_diff int
salary_diff int
birthday_diff int
count_diff int
Table 9 Data in “Users_col_delta" table—“ValidationDB"
id name_diff salary_diff birthday_diff count_diff
2 NULL NULL NULL 1
In this section we have shown how row-based and column-based statistics are gen-erated by applying the aforementioned validation process. Row validation gives an overview of the total number of differences in each table with the per cent difference. Column validation, on the other hand, generates more detailed statistics such as the number of differences and the minimum and maximum difference in the data in each column. It also calculates the first quartile, the median, and the third quartile of the data. The analysis of those statistics is discussed in the next section.
Results and discussion
Diftong is our big data validation tool based on the validation process described previ-ously. The tool has many features that create a solution for the validation of big data. It helps organisations to ensure the correctness of their transformations by detecting any changes in the generated data of different versions of the same workflow. In a more gen-eral context, the tool compares any two databases that have the same schemas and high-lights the differences and similarities between them. Diftong could be included in a more robust information life cycle management framework as described in [35]. Similarly by ensuring data quality, big data analytics [36] can be applied with more trust [37].
Even though the tool was implemented using Hive and the Hadoop framework for the validation in a big data environment, the proposed validation process is generic and can easily be tailored to other table-based database management systems. Any key/value data set represented in the form of columns in a Hive table and queryable in HiveQL can be validated using the tool.
Diftong is easy-to-use and provides the ability to customise the validation process. This is achieved by giving the user the option to choose which steps to execute and which tables and/or columns to include or exclude from the validation.
Test cases and analysis
For the purpose of the analysis, two test cases were conducted on a test database with the size of 1TB. TPC-H is a decision support benchmark [38] that was used in the vali-dation of the results of this study. A Hive testbench [39] that provides experiments with Apache Hive at any data scale was used to generate and populate a test database based on the TPC-H benchmark with a scale factor equal to 1000 (1TB). The TPC-H database consists of eight tables (Customer, LineItem, Nation, Orders, Part, PartSupp, Region, and Supplier) that contain several billions of records [38].
First test case
The Diftong tool was used to compare the previously stated test database—named “TPCH"—with an identical copy of it named “TPCH_copy". The data in both databases were first deduplicated, then the row validation stage was executed. As expected, no dif-ferences were found in any of the tables.
displaying an information message to the user stating the reason behind not continuing with the execution of this stage.
Second test case
The following modifications were made to the data in the “TPCH_copy" database before executing the tool again:
• Table “LineItem":
New rows: One new row was added.
Duplication: Four rows were duplicated, the first was duplicated once, the second twice, the third three times, and the fourth ten times.
Column “L_returnflag": According to the specification of the TPC-H database [38], this column can contain one of the following values: “R", “A", or “N". All “R" values were uncapitalised and replaced by “r". The number of rows that contain this value is 1,480,675,200.
• Table “Orders":
Column “O_orderdate": All dates in this column were shifted 1 day forwards.
Row statistics Table 10 displays the new generated row statistics for the tables that contain differences. There is a 17-row difference (1new row+(1+2+3+10)duplicated rows) in the “LineItem" table between the two databases before the deduplication step is applied. This number decreases to 1 (only the new row) where it reflects the delta between row numbers in both deduplicated databases.
As was explained in the previous section, the total number of differences can be cal-culated based on the number of changes that have occurred. In addition to the new row and the four duplications in rows, 1,480,675,200 values from the “TPCH" database were changed in “TPCH_copy" because of the modification that was undertaken in the col-umn “L_returnflag". Thus, the total number of rows that are different in both databases and the per cent difference can be calculated as follows:
Similarly, it can be seen that there is 100% difference regarding the table “Orders" while no new rows were added and no rows were duplicated. In other words, all existing rows in the “TPCH" database table are different from the related ones in the “TPCH_copy" database, and this is due to the change that was made on all dates in the “O_orderdate" column. As the results indicate, there is clearly a need to execute the column validation step in both tables “LineItem" and “Orders" in order to get more detailed insights regard-ing the changes that have occurred.
Figures 11 and 12 display the results of the row validation step in graphical interfaces as a part of the outputs of the Diftong tool.
(1480675200changed values +4rows without deduplication)in TPCH
+ (1480675200changed values +4deduplicated rows +1new row)
in TPCH_copy =2961350409
Column statistics The result of the row validation stage indicates which columns should be further investigated. In Table 11, the total number of differences that were caused by uncapitalising a letter in the “LineItem" table is reflected, with a minimum and maximum of 1, which means that only one letter has changed. In addition, the four duplication operations are also listed with a range from 1 to 10. The quartile values here give a good measure of the distribution of data, as it shows that smaller number of row duplications have occurred in general even if the maximum value is 10, which is correct considering how the data was spread in this example (1, 2, 3, and 10).
In some cases, the change is not necessarily unwanted. For example, the systematic change in the “O_orderdate" column in the “Orders" table shown in Table 11, may be a desired change. Desired changes may be excluded from the validation process by apply-ing an exclude flag in Diftong. If this is the case, considering the differences in such col-umns might not give any added value, and thus they can be excluded from the validation process. Excluding the “O_orderdate" column in this example will make the per cent dif-ference disappear.
Figures 13, 14, and 15 show the results of the column validation stage of the Diftong
tool for both tables “LineItem" and “Orders".
Performance measurements
In order to estimate the effort for a validation using Diftong, execution time and CPU-time were measured for all queries in each test case (where databases of 1TB size were compared). Each experiment was repeated three times. Table 12 shows the average run-time and CPU-run-time for each test case, and Fig. 16 displays the chart related to the run-time measurements.
To put these 400 CPU-hours for a validation experiment in context, it is worth noting that counting all rows in both databases takes ∼3.5 CPU-hours. Thus, the computational cost of a validation using Diftong is comparable to the cost of running ∼100 passes over the data.
It is notable that the measurement of the deduplication stage is similar in both test cases as the same database structures were used and only a few more rows were added to the data in the second case. However, the row validation step took longer compared to the first case since differences were detected and row statistics were calculated and generated. As for the column validation step, there was no time added for the first test case since no differences were found, while statistics were generated for both “LineItem" and “Orders" tables in the second case resulting in more time being added to the total number of milliseconds.
Moreover, by analysing and comparing the numbers in the two columns “First test case" and “Second test case", it can be noted that up to 80% of the time is devoted to the
Table 10 Row validation statistics—“LineItem" and “Orders" tables
Table TPCH TPCH_copy Deduplicated Deduplicated Difference count %
TPCH TPCH_copy
deduplication stage, plus creating and populating row delta tables in the row validation stage in order to detect whether any differences have occurred or not. The cost of those two operations comes from the fact that deduplicating a table means that all rows in the table are grouped on all columns using the Hive GROUP BY operator, while row vali-dating two tables (A and B) means selecting all rows in A that are not in B and all rows in B that are not in A; row validation was implemented using the Hive full outer join opera-tor. For further analysis, it is interesting to investigate whether the deduplication step can be optimized. The work of Chu et al. should be considered [40].
The two test cases have demonstrated how the tool was able to detect every change that has occurred, providing results that help ensure the data accuracy.
X-axis: Row count Y-axis: Table name
Rows in TPCH Rows in TPCH copy Rows in deduplicated TPCH Rows in deduplicated TPCH copy Number of differences
Fig. 11 Row validation chart for the difference count
Fig. 12 Row validation chart for the difference percentage. X-axis: Difference percentage; Y-axis: Table name
Table 11 Column validation statistics—“LineItem" and “Orders" tables
Table Column Difference count Max Min Q1 Q2 Q3
LineItem L_returnflag 1,480,675,200 1 1 1 1 1
row_count 4 10 1 1.75 2.5 4.75
Fig. 13 Column validation chart for the difference count. X-axis: Difference count Y-axis: Column name
X-axis: Statistics Y-axis: Column name Max difference Min difference Q1 Q2 Q3
Fig. 14 Column statistics chart for the “LineItem" table
X-axis: Statistics Y-axis: Column name Max difference Min difference Q1 Q2 Q3
Conclusion
Our work aimed to provide a general solution for scalable validation of data processing workflows. Diftong involves three stages: (i) deduplication, (ii) row validation, resulting in row statistics, and (iii) column validation resulting in column statistics. Row statistics give an overview of the data in all rows and identify the total number of discrepancies in each table with the aid of the per cent difference. Detecting the differences and simi-larities on a row-based level gives the user a clear idea of any changes that might have occurred. If this is the case, the user can ask for a deeper level of statistics based on each column in that table. Column statistics provide a more detailed view of the changes in data. The number of differences is calculated for each column along with the mini-mum and maximini-mum difference in the data, which provides a further insight about the range of differences that have occurred. In addition, the quartile values (lower, middle, and upper) give more understanding of the distribution of data by measuring how differ-ences are spread.
Diftong automatically computes overall statistics of the differences between two databases with identical schema. The automation of this process eliminates the time-consuming manual labour and the risk of human error. Using Diftong in real use cases related to Klarna’s core business has shown that the capability of identifying the
Table 12 Run-time and CPU-time for the two test cases
Validation stage Run-time CPU-time
First test case Second test case First test case Second test case
Deduplication 3,627,636 3,110,763 427,517,000 465,107,430
Row validation 2,162,731 3,379,068 739,369,180 835,724,920
Column validation 0 599,418 0 173,312,140
Total in milliseconds 5,790,367 7,089,249 1,166,886,180 1,474,144,490
Total in hours 1.6 2 324 409
differences between large scale databases helps organisations manage their data trans-formation workflows. In particular, Diftong has helped Klarna validate optimisations of workflows. It has also allowed the company to be more agile in their work with their data transformations, adding substantial value.
Using HiveQL, that provides standard SQL functionality, as the main development tool in this project delivers backwards compatibility and allows for interoperability between various database management systems. To validate data using Diftong, data have to be available in tabular form in Hive. Future work includes looking into adopting the tool to other storage engines and other query languages such as relational databases/ data warehouses, as well as key/value databases and graph databases.
Performance optimization of Diftong is a part of future work as well. For example, it is interesting to investigate whether the deduplication step can be optimized as it accounts for a majority of the execution time.
Finally, it should be considered whether Hive meta store could be extended to provide more statistics than the currently provided COUNT, MINIMUM and MAXIMUM val-ues. Enriching Hive meta-store with additional descriptive statistics would facilitate the column validation stage of Diftong.
Abbreviations
DDL: Data Definition Language; DML: Data Manipulation Language; RDBMS: Relational Database Management Sys-tems; UNECE: United Nations Economic Commission for Europe.
Acknowledgements
The authors acknowledge the support from Uppsala University during the time of the study. The authors also acknowl-edge the help of the Klarna Bank AB and Klarna’s employees at their Uppsala office for knowlacknowl-edge sharing and meaning-ful discussions. Jörgen Falk deserves a special mention for his continuous support in the implementation of Diftong.
Authors’ contributions
RR, JP, and EZ designed the study and developed the methodology. RR wrote the manuscript, implemented the system, and performed the analysis under the supervision of JP. SM was the academic supervisor of the study, provided guidance with manuscript writing and was iteratively reviewing and revising it. All authors contributed to editing and evaluating the manuscript. All authors read and approved the final manuscript.
Funding Not applicable.
Availability of data and materials
All data used during this study are publicly available and the source is included in the manuscript. Competing interests
The authors declare that they have no competing interests. Author details
1 Department of Informatics and Media, Uppsala University, Kyrkogådsgatan 10, 753 13 Uppsala, Sweden. 2 Klarna Bank AB, Sveavägen 46, 111 34 Stockholm, Sweden.
Received: 16 February 2019 Accepted: 6 May 2019
References
1. Li N, Escalona A, Guo Y, Offutt J. A scalable big data test framework. In: 2015 IEEE 8th international conference on software testing, verification and validation (ICST); 2015. p. 1–2. https ://doi.org/10.1109/ICST.2015.71026 19. 2. Cai L, Zhu Y. The challenges of data quality and data quality assessment in the big bata era. Data Sci J. 2015;. https ://
doi.org/10.5334/dsj-2015-002.
3. Sadiq S, Orlowska M, Sadiq W, Foulger C. Data flow and validation in workflow modelling. In: Proceedings of the 15th Australasian database conference, Vol. 27. ADC ’04, p. 207–214. Australian Computer Society, Inc., Darlinghurst, Australia, Australia; 2004. http://dl.acm.org/citat ion.cfm?id=10122 94.10123 17.
5. Gao J, Xie C, Tao C. Big data validation and quality assurance–issuses, challenges, and needs. In: 2016 IEEE sympo-sium on service-oriented system engineering (SOSE); 2016. p. 433–441. https ://doi.org/10.1109/SOSE.2016.63. 6. Experian data quality: the well-oiled data machine; 2014. https ://www.edq.com/uk/blog/the-well-oiled -data-machi
ne. Accessed 5 May 2018.
7. Moore S. How to create a business case for data quality improvement; 2017. https ://www.gartn er.com/smart erwit hgart ner/how-to-creat e-a-busin ess-case-for-data-quali ty-impro vemen t. Accessed 12 May 2018.
8. IBM. Extracting business value from the 4 V’s of big data; 2016. http://www.ibmbi gdata hub.com/infog raphi c/extra cting -busin ess-value -4-vs-big-data. Accessed 12 May 2018.
9. Xie C, Gao J, Tao C. Big data validation case study. 2017 IEEE third international conference on big data computing service and applications (BigDataService). 2017; p. 281–286. https ://doi.org/10.1109/bigda taser vice.2017.44. 10. Garg N, Singla S, Jangra S. Challenges and techniques for testing of big data. Procedia Comput Sci. 2016;85:940–8.
https ://doi.org/10.1016/j.procs .2016.05.285 International Conference on Computational Modelling and Security (CMS 2016).
11. Redman TC. Data’s credibility problem; 2013.https ://enter prise rspro ject.com/sites /defau lt/files /Data’sCred ibili tyPro blem.pdf.
12. Palazzo C, Mariello A, Fiore S, D’Anca A, Elia D, Williams DN, Aloisio G. A workflow-enabled big data analytics software stack for eScience. In: 2015 International conference on high performance computing simulation (HPCS); 2015. p. 545–552. https ://doi.org/10.1109/HPCSi m.2015.72370 88.
13. Ordonez C, García-García J. Managing big data analytics workflows with a database system. In: 2016 16th IEEE/ACM international symposium on cluster, cloud and grid computing (CCGrid); 2016. p. 649–655. https ://doi.org/10.1109/ CCGri d.2016.63.
14. Laranjeiro N, Soydemir SN, Ivaki N, Bernardino J. Testing data-centric services using poor quality data: from relational to NoSQL document databases. J Braz Comput Soc. 2017;23(1):14. https ://doi.org/10.1186/s1317 3-017-0063-x. 15. Klarna: About us; 2018. https ://www.klarn a.com/se/om-oss. Accessed 29 Jan 2018.
16. Firmani D, Mecella M, Scannapieco M, Batini C. On the meaningfulness of “big data quality” (invited paper). Data Sci Eng. 2016;1(1):6–20. https ://doi.org/10.1007/s4101 9-015-0004-7.
17. Arolfo F, Vaisman A. Data quality in a big data context. In: Benczúr A, Thalheim B, Horváth T, editors. Advances in databases and information systems. Cham: Springer International Publishing; 2018. p. 159–72. https ://doi. org/10.1007/978-3-319-98398 -1_11.
18. RTTS: QuerySurge; 2018. http://www.query surge .com/solut ions/testi ng-big-data. Accessed 04 June 2018. 19. Spotify: BigDiffy; 2018. https ://githu b.com/spoti fy/ratat ool/tree/maste r/ratat ool-diffy . Accessed 04 June 2018. 20. Gyorödi C, Gyorödi R, Sotoc R. A comparative study of relational and non-relational database models in a web-
based application. Int J Adv Comput Sci Appl. 2015;6(11):78–83. https ://doi.org/10.14569 /IJACS A.2015.06111 1. 21. Najafabadi MM, Villanustre F, Khoshgoftaar TM, Seliya N, Wald R, Muharemagic E. Deep learning applications and
challenges in big data analytics. J Big Data. 2015;2(1):1. https ://doi.org/10.1186/s4053 7-014-0007-7.
22. Mehmood NQ, Culmone R, Mostarda L. Modeling temporal aspects of sensor data for MongoDB NoSQL database. J Big Data. 2017;4(1):8. https ://doi.org/10.1186/s4053 7-017-0068-5.
23. Geddam, S. Building a robust big data QA ecosystem to mitigate data integrity challenges; 2014. https ://www.cogni zant.com/white paper s/build ing-a-robus t-big-data-qa-ecosy stem-to-mitig ate-data-integ rity-chall enges -codex 907. pdf. Accessed 12 May 2018.
24. Batini C, Monica S. Data and information quality: dimensions, principles and techniques. Switzerland: Springer; 2016. p. 21–51. https ://doi.org/10.1007/978-3-319-24106 -7.
25. Nagdive AS, Tugnayat DRM, Tembhurkar MP. Overview on performance testing approach in big data. International Journal of Advanced Research in Computer Science. 2014;5(8):165–169. https ://www.resea rchga te.net/publi catio n/27033 8528_Overv iew_on_Perfo rmanc e_Testi ng_Appro ach_in_Big_Data. Accessed 12 May 2018.
26. Try QA: Big data testing; 2017. http://tryqa .com/big-data-testi ng/. Accessed 13 Aug 2018.
27. Yassien AW, Desouky AF. RDBMS, NoSQL, Hadoop: a performance-based empirical analysis. In: Proceedings of the 2nd Africa and Middle East conference on software engineering. AMECSE ’16, vol. 28-29, p. 52–59. ACM, New York, NY, USA; 2016. https ://doi.org/10.1145/29441 65.29441 74.
28. Birjali M, Beni-Hssane A, Erritali M. Evaluation of high-level query languages based on MapReduce in big data. J Big Data. 2018;5(1):36. https ://doi.org/10.1186/s4053 7-018-0146-3.
29. Thusoo A, Sarma JS, Jain N, Shao Z, Chakka P, Zhang N, Anthony S, Liu H, Murthy R. Hive—a petabyte scale data warehouse using Hadoop. In: Proceedings of the 26th international conference on data engineering, ICDE 2010, p. 996–1005. IEEE, Long Beach, California, USA; 2010. https ://doi.org/10.1109/ICDE.2010.54477 38.
30. Shaw S, Vermeulen AF, Gupta A, Kjerrumgaard D. Practical Hive: a guide to Hadoop’s data warehouse system. 1st ed. Berkely, CA, USA: Apress; 2016.
31. Atlassian: Apache Hive configuration properties; 2018. https ://cwiki .apach e.org/confl uence /displ ay/Hive/Confi gurat ion+Prope rties . Accessed 15 Apr 2018.
32. Atlassian: Apache Hive admin manual configuration; 2017. https ://cwiki .apach e.org/confl uence /displ ay/Hive/ Admin Manua l+Confi gurat ion. Accessed 07 May 2018.
33. Žerovnik J, Poklukar DR. Elementary methods for computation of quartiles. Teach Stat. 2017;39(3):88–91. https ://doi. org/10.1111/test.12133 .
34. Atlassian: Apache Hive language manual; 2017. https ://cwiki .apach e.org/confl uence /displ ay/Hive/Langu ageMa nual. Accessed 08 Apr 2018.
35. Moulos V, Chatzikyriakos G, Kassouras V, Doulamis A, Doulamis N, Leventakis G, Florakis T, Varvarigou T, Mitsokapas E, Kioumourtzis G, Klirodetis P, Psychas A, Marinakis A, Sfetsos T, Koniaris A, Liapis D, Gatzioura A. A robust information life cycle management framework for securing and governing critical infrastructure systems. Inventions. 2018;. https ://doi.org/10.3390/inven tions 30400 71.
37. Sänger J, Richthammer C, Hassan S, Pernul, G. Trust and big data: a roadmap for research. In: 2014 25th international workshop on database and expert systems applications; 2014. p. 278–282. https ://doi.org/10.1109/DEXA.2014.63. 38. TPC: TPC BenchmarkTM H standard specification revision 2.17.3, San Francisco. Transaction processing performance
council (TPC); 1993–2017. http://www.tpc.org/tpc_docum ents_curre nt_versi ons/pdf/tpc-h_v2.17.3.pdf. 39. Hortonworks: Hive TestBench; 2018. https ://githu b.com/horto nwork s/hive-testb ench. Accessed 16 May 2018. 40. Chu X, Ilyas IF, Koutris P. Distributed data deduplication. Proc VLDB Endowment. 2016;9(11):864–75. https ://doi.
org/10.14778 /29832 00.29832 03.
Publisher’s Note
![Fig. 2 Big data validation stages [26]](https://thumb-us.123doks.com/thumbv2/123dok_us/848922.1582554/7.595.117.477.86.311/fig-big-data-validation-stages.webp)