Using affective brain‑computer
interfaces to characterize human influential
factors for speech quality‑of‑experience
perception modelling
Rishabh Gupta
1, Khalil Laghari
2, Hubert Banville
1and Tiago H. Falk
1*Background
With recent advances in wireless and portable neurotechnologies, new applications of brain-computer interfaces (BCI) have emerged. Previously, BCIs were mostly targeted towards communication and rehabilitation applications, such as powered wheelchair control or so-called brain spellers [1, 2]. Today, other types of applications have emerged and passive BCIs have been developed to measure implicit information from the users, such as their mental states (e.g., stress level), fatigue levels, and more recently, their mood and emotional states [3]. These latter are referred to as affective BCIs (aBCI). Rep-resentative applications of passive and affective BCIs include neurogaming [4, 5], neu-romarketing [6], attention monitors [7], and automated multimedia affective tagging [8], to name a few. In this paper, we explore a new application for aBCIs: monitoring
Abstract
As new speech technologies emerge, telecommunication service providers have to provide superior user experience in order to remain competitive. To this end, quality-of-experience (QoE) perception modelling and measurement has become a key priority. QoE models rely on three influence factors: technological, contextual and human. Existing solutions have typically relied on the former two and human influence factors (HIFs) have been mostly neglected due to difficulty in measuring them. In this paper, we show that measuring human affective states is important for QoE measurement and propose the use of affective brain-computer interfaces (aBCIs) for objective meas-urement of perceived QoE for two emerging speech technologies, namely far-field hands-free communications and text-to-speech systems. When incorporating subjec-tively-derived HIFs into the QoE model, gains of up to 26.3 % could be found relative to utilizing only technological factors. When utilizing HIFs derived from an electroen-cephalography (EEG) based aBCI, in turn, gains of up to 14.5 % were observed. These findings show the importance of using aBCIs in QoE measurement and also highlight that further improvement may be warranted once improved affective state correlates are found from EEGs and/or other neurophysiological modalities.
Keywords: Quality-of-experience, Affective computing, Brain computer interfaces, Text-to-speech, Electroencephalography
Open Access
© 2016 Gupta et al. This article is distributed under the terms of the Creative Commons Attribution 4.0 International License (http:// creativecommons.org/licenses/by/4.0/), which permits unrestricted use, distribution, and reproduction in any medium, provided you give appropriate credit to the original author(s) and the source, provide a link to the Creative Commons license, and indicate if changes were made.
RESEARCH
the human influential factors needed in quality-of-experience (QoE) perception models used by telecommunication service providers.
QoE has been formally defined as ‘the degree of delight or annoyance of the user of an application, resulting from the fulfillment of his/her expectations in light of the user’s personality and current mental state’ and is driven by three key influence factors: tech-nological, contextual, and human [9, 10]. Technological influence factors (TIFs) refer to system and network parameters that can be readily measured (e.g., delay, bitrate). Contextual influence factors, in turn, can describe the user’s environment, as well as economic aspects (e.g., pricing, churn rate). Lastly, human influence factors (HIFs) char-acterize the user’s perception, emotional and mental state with respect to a service [9, 10]. For much of the last decade, experts have advocated for QoE to be used as the stand-ard user-centric quality metric for emerging applications and products [11]. Notwith-standing, the majority of existing work has focused only on technological and contextual aspects [12, 13]. In order to develop true QoE assessment methods, however, HIFs also need to be incorporated. In this paper, we propose the use of aBCIs during speech QoE perception tests to measure such HIFs.
User affective states can be inferred from multiple sources, such as facial expressions [14], body posture [15], and even voice [16]. These behavioural cues, however, can be concealed by the user. As such, monitoring of neurophysiological sources, such as heart rate, skin conductance, or neural responses, have become popular as they also accurately characterize human emotional states, but are more difficult to be volitionally concealed. Neurophysiological tools, such as electroencephalography (EEG) and functional near infrared spectroscopy (fNIRS) have been used in the past for affective state characteri-zation with varying degrees of success [17–20], as well as for QoE assessment [21–23]. While EEG relies on measuring the electrical activity in the brain with high temporal precision (order of milliseconds), it suffers from limited spatial resolution. Functional NIRS, on the other hand, tracks cerebral hemodynamics with better spatial resolution than EEG, but with relatively poor temporal precision (order of seconds) [24]. Overall, EEG-based aBCIs have been more widely used and reported in the literature, but fNIRS is quickly gaining grounds [25].
HIFs on ‘true’ QoE perception modelling. Experimental results with data collected from two QoE perception studies show the importance of aBCIs and of HIFs on QoE percep-tion modelling.
The general scheme of the proposed aBCI system for user QoE perception monitor-ing is shown in Fig. 1 (for illustration purposes, a TTS example is shown). Within this framework, the audio signal (e.g., synthesized speech signal generated by a personal digi-tal assistant) is used to extract TIFs and is presented to participants, whom in turn are wearing an EEG-based aBCI. Features from the EEG signal are then extracted and used as HIF correlates. The TIF and HIF parameters are then input to a QoE model which out-puts an estimated user-perceived QoE value. As can be seen, the proposed setup, with-out loss of generality, does not investigate the effects of contextual factors on QoE; such analysis is left for future study. To the best of our knowledge, this is the first time that (1) HIFs are quantitatively shown to be important influence factors for QoE measurement, (2) EEG-based aBCIs are used to objectively monitor HIFs for QoE modelling, and (3) the developed QoE models are validated on two independently acquired data sets.
The remainder of this paper is organized as follows. “Methods and materials” section provides an overview of the methodology and experimental setups used. “Experimental results” section and “Discussion” section describe the experimental results and discus-sion, respectively. Lastly, conclusions are presented in “Conclusion” section.
Methods
Speech QoE can be assessed either subjectively or objectively [12, 27]. Subjective testing typically involves user interviews, ratings and surveys to obtain insights about the end-user’s perception, opinion and emotions about speech quality and their overall experi-ence, thus forming the ‘ground truth’. Objective assessment, on the other hand, replaces the listener with a computational algorithm that has learned complex mappings between several key factors and previously-recorded subjective ratings. Existing objective meth-ods have been “technology-centric”, thus relying mostly on technological and contextual factors [12]. In order to develop QoE assessment methods, however, human influen-tial factors also need to be incorporated. More recently, neurophysiological monitor-ing tools have been used to develop objective models which try to estimate the ground truth. Having this said, in this section we describe the methodology and experimental setup used in our study.
Subjective assessment methods
Quantitative subjective assessment methods typically involve the construction of ques-tionnaires with rating scales, surveys, and user studies which can be conducted either in laboratory or “real-world” settings. The International Telecommunications Union (ITU), for example, has developed subjective study guidelines for perceptual speech qual-ity evaluations. Recommendation P.800 [28] describes how to conduct the widely-used mean opinion score (MOS) listening test. The human-computer interaction domain has also covered guidelines on subjective testing methods for speech interface quality evaluation [29]. For speech intelligibility assessment, subjective tests are conducted that explore syllable, word, or sentence recognition.
Objective assessment methods
Objective assessment methods are also often referred to as instrumental measures. QoE insights are normally estimated either using technology-centric speech metrics or, more recently, via neurophysiological monitoring tools (i.e., aBCIs), as detailed below.
Technology‑centric speech metrics
Technology-centric models replace the human rater by a computer algorithm which has been developed to extract relevant features from the analyzed signal (speech, audio, image, or video) and map a subset/combination of such features into an estimated QoE value. For speech technologies, models can be further categorized as full-reference (also known as double-ended, intrusive) or no-reference (single-ended, non-intrusive), depending on the need, or not, of a reference signal, respectively. The ITU, for example, has standardized several objective models over the last decade, such as PESQ (recom-mendation P.862 [36]) and POLQA (recommendation P.863 [37]) as full-reference mod-els and ITU recommendation P.563 [38] as no-reference.
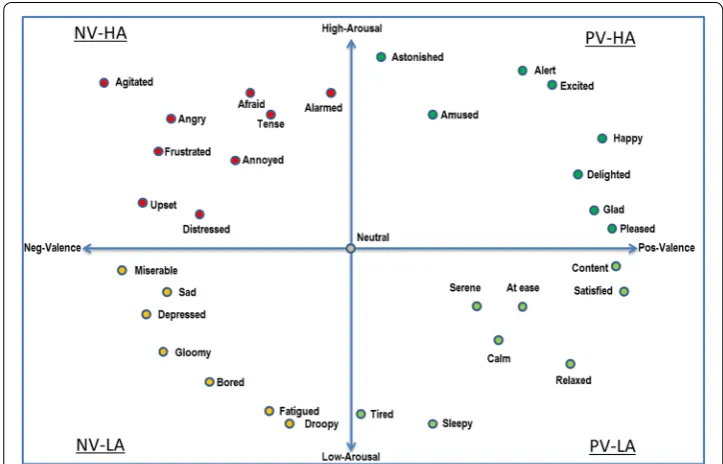
Fig. 2 Two-dimensional Valence-Arousal (VA) emotion map with representative emotions
For hands-free speech communications, one non-intrusive method called reverbera-tion to speech modulareverbera-tion energy ratio (RSMR) has been shown to outperform the abovementioned standard algorithms, thus will be used in our studies. A description of the metric is beyond the scope of this paper and the interested reader is referred to [39, 40] for more details. Moreover, for TTS systems, studies have shown the importance of signal-based metrics [41], such as prosody and articulation [42]. Recently, two quantita-tive parameters were shown useful [42], thus are used in our TTS study: the slope of the second order derivative of the fundamental frequency (sF0′′) and the absolute mean of the second order mel frequency cepstrum coefficient (MFCC2). While the sF0′′ feature models the macro-prosodic or intonation-related properties of speech, MFCC2 models articulation related properties [42]. In our experiments, the openSMILE toolbox [43] was used to extract these features using the default window length of 25 ms and frame shift of 12.5 ms.
aBCI features
Typical EEG-aBCI features involve the calculation of specific EEG frequency subband powers, such as delta, theta, alpha, beta, or gamma sub-bands, as well as their interac-tions [44]. To characterize human affective states, the human prefrontal cortex (PFC) region has been widely used. Seminal studies have shown differential involvement of right and left hemispheres in emotional processing, where the right hemisphere is linked with unpleasant emotions and the left with pleasant emotions [45, 46]. As such, an asym-metry index has been developed which measures the difference in EEG activity in the alpha band (8–12 Hz) from the left to the right hemisphere; the index has been shown to be correlated with the valence emotion primitive [47, 48]. Moreover, the beta frequency band (12–30 Hz) power at the medial prefrontal cortex (MPC) has been associated with arousal [49].
Therefore, in order to objectively characterize affective factors, two features were extracted, namely an alpha-band asymmetry index (AI) and the MPC beta power (MBP), as correlates of valence and arousal, respectively. More specifically, the AI feature was computed as the difference between the natural logarithm of the alpha power of the left (αAF3) and right frontal electrodes (αAF4), as highlighted in the electrode map depicted by Fig. 4 and suggested by [47]:
The MBP feature, in turn, was computed as the beta-band power in the AFz position (central electrode highlighted in Fig. 4), as suggested by [17, 50].
Experimental setup: dataset 1 (hands‑free communications) Participants
was approved by the Research Ethics Office at INRS-EMT and at McGill University (Montreal, Canada).
Stimuli
As stimulus, a clean double-sentence speech file created from the TIMIT database [51] was used. The clean file was then convolved separately with room impulse responses typical of three practical environments. The first represented a living room environ-ment with a reverberation time (RT) of approximately 400 ms. The second represented a classroom environment (RT =1.5 s) and the third a large auditorium (RT =2 s). Higher RT values indicate rooms with greater reverberation levels, which in turn, are more detrimental to perceived speech quality. For consistency, all files were normalized to −26 dBov using the ITU-T P.56 voltmeter [52]. The sentence was uttered by a male speaker and digitized at 8 kHz sampling rate with 16-bit resolution. Speech files repre-sentative of the four hands-free conditions were presented to the participants over sev-eral trials, as detailed in the sections to follow. More details about this database can be found in [53].
Experimental protocol
10–20 standard system (see Fig. 4). Four electrodes for electro-oculography (EOG) and two mastoid electrodes (right and left) were used for reference. The test consisted of an oddball paradigm, where the clean speech served as the standard stimulus and the reverberant files served as deviants. Clean and reverberant speech files were delivered in a pseudo-randomized order, forcing at least one standard stimulus to be presented between successive deviants, in sequences of 100 trials. Stimulus was presented with an inter-stimulus-interval varying from 1000 to 1800 ms. Participants were seated comfort-ably and were instructed to press a button, whether they detected the clean stimulus or one of the deviants. Stimulus was presented binaurally at the individual’s preferred lis-tening level through in-ear headphones.
Experimental setup: dataset 2 (TTS systems) Participants
Twenty-one fluent English speakers (eight females) with average age 23.8 (±4.35) years were recruited for the study. None of them reported having any hearing or neuro-phys-iological disorders. Insert earphones were used to present the speech stimuli to the par-ticipants at their individual preferred volume levels. The study protocol was approved by the INRS Research Ethics Office and participants consented to participate and make their de-identified data available freely online. The participants were also compensated monetarily for their time.
Stimuli
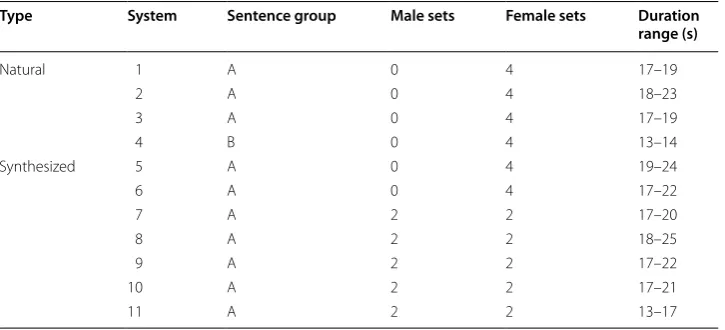
Table 1 lists the speech stimuli used for this study along with certain important aspects. The stimuli consisted of four natural voices and seven synthesized voices, obtained from commercially available systems, namely: Microsoft, Apple, Mary TTS Unit selection & HMM, vozMe, Google and Samsung. Tested systems cover a range of different concate-native and hidden Markov model (HMM) based systems. A non-identifying code is pro-vided for each of the seven TTS systems in Table 1. Speech samples were generated from two sentence groups (A and B), each comprising four sentences. Thus, the total number of stimuli used in this study were forty-four [(4 natural voices + 7 synthesized voices) ×
Table 1 Description of the stimuli used for the listening test in dataset 2
Type System Sentence group Male sets Female sets Duration
range (s)
Natural 1 A 0 4 17–19
2 A 0 4 18–23
3 A 0 4 17–19
4 B 0 4 13–14
Synthesized 5 A 0 4 19–24
6 A 0 4 17–22
7 A 2 2 17–20
8 A 2 2 18–25
9 A 2 2 17–22
10 A 2 2 17–21
4 sentence sets]. The speech stimuli consisted of both male and female voices for five of the seven TTS systems. The speech stimuli were presented to listeners at a sampling rate of 16 KHz and a bitrate of 256 kbps. Table 1 also details the duration range of the speech stimuli for each system. More details about this database can be found in [54].
Experimental protocol
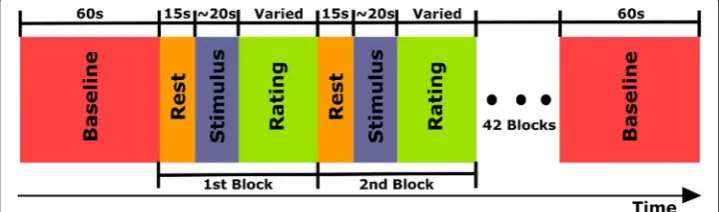
The experimental procedure was carried out in accordance with ITU-T P.85 recommen-dations [55]. Participants were first comfortably seated in front of the computer screen inside a soundproof room. Participants were then fitted with 62 EEG electrodes (AF7 and AF8 were not used) using a compatible EEG cap. Insert earphones were placed com-fortably inside the participants’ ears to deliver the speech stimuli. The experiment was then carried out in two phases: a familiarity phase and an experimental phase. In the familiarity phase, participants were presented with a sample speech file followed by the series of rating questions, thus illustrating the experiment procedure and giving them the opportunity to report any problems and/or concerns. Next, the experimental phase consisted of several steps as shown in Fig. 5. First, data from a baseline period was col-lected for 1 min in which the participants were advised to focus only on the cross bar in the middle of the screen and not think about anything else. This was followed by a 15-s rest period followed by the presentation of randomized speech stimuli, one sentence set (approximately 20 s long) at a time. The rest period was provided to allow neural activity and cerebral blood flow to return to baseline levels prior to TTS stimulus presentation. Moreover, following each stimulus participants were presented with rating questions on the screen where they scored the stimulus using a continuous slider on the 5-point MOS scale and the 9-point SAM scales for valence and arousal. This rest-stimulus-rating com-bination is referred to as an experimental ‘block’. The procedure is repeated 44 times, where each block corresponds to one of the 44 speech stimuli available in the dataset.
EEG data processing
For data analysis, the MATLAB-based EEGLAB toolbox was used [56]. Data was
recorded at 512 Hz but down-sampled to 256 Hz and band-pass filtered between 0.5 and 50 Hz for offline analysis. All channels were re-referenced to the ‘Cz’ channel. For the first dataset, continuous EEG data were divided into epochs of 3000 ms, time locked to
the onset of the stimuli with a 200 ms pre-stimulus baseline. For the second dataset, the EEG data was divided into epoch-length corresponding to the speech stimulus length with a 300 ms pre-stimulus baseline. In order to remove artefacts from the EEG signals (e.g., eye blinks), a combination of visual inspection and independent component analy-sis was performed. Features were then extracted from the artefact-free segments.
QoE model performance assessment
In order to assess QoE model performance, three tests were conducted for each study. First, we explored the goodness-of-fit (r2) achieved by using only the technology-cen-tric speech metechnology-cen-tric as a correlate of the QoE score reported by the listeners (denoted as QoETech). Second, we investigated the gains obtained by including HIFs into the QoE
models. Here, we measured the r2 obtained from a linear combination of the technology-centric speech metric combined with the subjective valence and arousal (‘ground truth’) ratings reported by the listeners (denoted as QoEHIF). Gains in the goodness-of-fit met-ric should indicate the benefits of including HIFs into QoE perception models. Lastly, we replaced the ground truth HIFs by the aBCI features that are used as correlates of the lis-tener’s emotional states (denoted as QoEaBCI). It is expected that the r2 achieved will lie between those achieved without and with HIFs, thus signalling the importance of aBCIs in QoE perception modelling.
Towards this end, the goodness-of-fit measures were obtained by developing linear regression equations for each of the three proposed tests (i=1,. . ., 3). Linear regres-sion model ‘i’ had dependent variable yi as a linear combination of ‘p’ independent vari-ables (or regressors, xip) weighted by regression coefficients (βp) and error (ǫi). The linear regression is formulated as follows:
The values of β and ǫ are estimated using least squares fitting on training data.
Experimental results
In this section, we report the experimental results obtained from the subjective and objective methodologies used.
Dataset 1: hands‑free communications Subjective data evaluation
At first, the impact of RT over human QoE factors was analyzed by computing descrip-tive statistics, as shown in Fig. 6. The obtained quality and affective ratings (valence and arousal) were averaged over all participants. As expected, a monotonic decrease across all subjective factors was observed with an increase in reverberation time. In order to test the effects of the four speech quality conditions on perceived quality, a repeated measures ANOVA with a Greenhouse-Geisser correction was used. A significant main effect was found (F(df1=1.08,df2=15.16)=240.692;p≤0.05) with effect size, η2=0.945, thus indicating significant between-group variations in QoE-MOS ratings for the four tested conditions. Moreover, post-hoc pairwise t-test comparisons with Bonferroni correction showed QoE scores to significantly decrease for each of the four tested conditions.
Similar analysis was performed for the arousal and valence ratings. For arousal, statistical difference across four condition groups was found (F(1.05, 14.78)=11.83;p≤0.05;η2=0.458), as was the case with valence
(F(1.08, 15.20)=91.85;p≤0.05;η2=0.868). The stronger effect (η2) seen for valence
over arousal suggests that RT has a stronger influence on the perceived pleasantness of the experienced files. Post-hoc pairwise t test comparisons with Bonferroni correction were also computed for the two emotional primitives. It was found that valence ratings significantly decreased with increasing RT levels (p≤0.05). For arousal, on the other hand, significant differences were not seen between the RT =1.5 s and RT =2 s pairs, suggesting only subtle differences in arousal between the two conditions.
To better understand the impact of reverberation time on users’ emotional ratings, the 2-dimensional valence-arousal map can be used, as depicted by Fig. 7. In the plot, the x-axis represents the SAM scores for valence and the y-axis represents arousal. The data are centred at (5,5), which is the neutral state according to the 9-point SAM scale. The positive valence and high arousal (PV–HA) quadrant represents emotions such as hap-piness, excitement, and alertness. The PV–LA quadrant normally represents emotional characteristics like satisfaction, relaxation, and content. The negative valence and high arousal (NV–HA) quadrant, in turn, represents emotional characteristics such as agi-tation and anger. Affective behaviors such as boredom, fatigue, discomfort, and dissat-isfaction are represented in the NV–LA quadrant. As can be seen, for the clean signal the majority of the participants rated the stimulus between 4 and 6 in the arousal and valence scales, thus corroborating the neutrality of the speech content. As reverberation levels increase, the majority of participants rated between 2 and 4 in the arousal and
valence scales, thus, pointing towards the (NV–LA) quadrant states such as discomfort, unpleasantness, and boredom.
Pearson correlations between RT and each of the three subjective factors were also computed and are reported in Table 2. All correlation coefficient values were found to be significant (p<0.05) with quality and valence ratings showing the strongest (positive) correlations with each other and strong (negative) correlations with RT. On the other hand, arousal showed only a mild correlation with quality and valence.
Objective model evaluation
As mentioned in “QoE model performance assessment” section, three QoE models were implemented in order to gauge the benefits of including HIFs, as well as aBCI features into the equation. For this study, the following QoE models were found:
(3) QoETech =0.74−0.5×RSMR,
(4) QoEHIF =0.38−0.27×RSMR+0.73×Val−0.13×Ar,
(5) QoEaBCI=0.02+0.20×AI−0.07×MBP−0.94×RSMR,
Fig. 7 Subjective Valence vs. Arousal emotional map across the four tested conditions in Dataset 1. The figure shows the spread of users’ valence and arousal scores, in response stimuli used in Dataset 1, on a valence-arousal map
Table 2 Pearson correlation analysis between the three subjective factors and reverbera-tion time (RT) for dataset 1
RT QoE‑MOS Valence Arousal
RT 1.00 −0.86 −0.73 −0.41
QoE-MOS −0.86 1.00 0.87 0.44
Valence −0.73 0.87 1.00 0.61
where ‘Val’ and ‘Ar’ indicate the valence and arousal subjective ratings, respectively, and the β and ǫ parameters were obtained on a subset of the available data. The obtained goodness-of-fit (r2) value for (3) was 0.72 with a root mean squared error (RMSE) value of 0.135. The r2 value for (4), in turn, was 0.87 with RMSE value of 0.093, thus suggesting the importance of HIFs in QoE perception assessment models. Lastly, for (5) an r2 value of 0.81 and an RMSE of 0.097 was obtained, thus signalling the benefits of using aBCIs for the task at hand. When comparing the output of the objective QoE model in (5) and model in (4), a Pearson correlation coefficient of 0.90 was obtained.
Dataset 2: TTS systems Subjective data evaluation
Initially, the impact of varying TTS system quality on human QoE factors was analyzed by computing descriptive statistics, as shown in Fig. 8. It was observed that systems 1 and 3 showed the highest quality ratings, which can be expected as both corresponded to natural voices. However, the other two natural voice systems (2 and 4) were rated at medium quality levels. This was due to the fact that the speaker used for system 4 was specifically asked to speak with a neutral intonation and listeners reported voice 2 as sounding breathy, thus lower in quality than the other natural voices. Regarding the TTS systems, system 11 scored the least in terms of quality, valence and arousal. In general, the synthesized speech systems scored lower than natural systems. How-ever, comparing the systems which used synthesized voices, system 5 scored the maximum in terms of quality and valence. In order to test the effects of these speech systems in terms of perceived QoE, an ANOVA was used. A significant effect was found
[F(10, 913)=143.32;p≤0.01]. Moreover, post-hoc pairwise t-test comparisons with Bonferroni correction showed QoE-MOS scores to significantly differ between natural voices and TTS system outputs.
Similar analysis as above was performed for the arousal and valence rat-ings. For valence, statistical difference across eleven condition groups was found
[F(10, 913)=96.28;p≤0.01], as was the case with arousal [F(10, 913)=31.5;p≤0.01] .
The stronger F-statistic seen for valence over arousal suggests that synthesized speech quality has a stronger influence on the perceived pleasantness of the experienced files. Post-hoc pairwise t-test comparisons with Bonferroni correction were also computed for the two emotional primitives. It was found that valence and arousal ratings signifi-cantly differed between the natural and synthesized voices. Moreover, to better under-stand the impact of TTS system quality on users’ emotional ratings, the 2-dimensional valence-arousal map was used, as depicted by Fig. 9. It can be seen that the natural voice cases were present mostly in the PV–HA quadrant of the valence-arousal map, whereas all synthesized voices existed in the NV–LA quadrant. Furthermore, a comparative anal-ysis of subjective dimensions between male and female voices, using ANOVA, indicated a significant difference for male listeners, where the male listeners rated QoE-MOS and Valence for male voices higher than female voices with F(1, 258)=15.72;p≤0.01 and
F(1, 258)=6.49;p≤0.05, respectively. Previous research has found similar preference of male voices over female voices, for male listeners [57], and, male and female listeners [58].
Lastly, Pearson correlations between each of the three subjective factors were also computed, as reported in Table 3. All correlation values were found to be significant
(p<0.05) with quality and valence ratings showing the strongest (positive) correlations with each other. Arousal, on the other hand, showed only a mild correlation with quality and valence.
Objective model evaluation
As mentioned in “QoE model performance assessment” section, three QoE models were implemented in order to gauge the benefits of including HIFs, as well as aBCI features into the equation. For this study, the following QoE models were found:
The obtained goodness of fit (r2) value for model (6) was 0.76 with an RMSE of 0.136. For model (7), in turn, the obtained r2 value was 0.96 with an RMSE of 0.05, thus again highlighting the importance of HIFs in QoE perception modelling. Lastly, for model (8), the obtained r2 value was 0.87 with an RMSE of 0.117. When comparing the output of the objective QoE model in (8) and model in (7), a Pearson correlation coefficient of 0.91 was obtained.
Discussion
In this section, we discuss the experimental results obtained from the subjective and objective methodologies used.
Role of HIFs in QoE modelling
Recently, HIFs and objective HIF characterization have gained burgeoning attention from QoE researchers [10, 59, 60]. Previously, researchers have investigated the effects of user expectation on QoE [61]. In the similar vein, this paper has evaluated the effects of users’ affective states on overall QoE perception. We have found evidence from the two subjective assessment tests (hands-free communication and TTS systems) that indeed the users’ perceived affective states change with varying speech quality. As is evident from the results, these changes were produced irrespective of the impairment type.
It is visible from the valence-arousal maps depicted by Figs. 7 and 9 that poor qual-ity speech stimuli produced low arousal and low valence states, thus producing states ranging from ‘sad’ to miserable’ in listeners. High quality stimuli, on the other hand, (6) QoETech=0.36−0.56×MFCC2+0.44×sF0′′,
(7) QoEHIF =0.004+0.02×MFCC2+0.05×sF0′′+1.53×Val
−0.52×Ar,
(8)
QoEaBCI=0.08+0.86×AI−0.23×MBP−0.55×MFCC2
+0.24×sF0′′.
Table 3 Pearson correlation analysis between the three subjective factors for dataset 2
QoE‑MOS Valence Arousal
QoE-MOS 1.00 0.81 0.51
Valence 0.81 1.00 0.61
incited high arousal and high valence states, thus making users feel ‘alert’ or ‘amused’. From Tables 2 and 3, it was also found that the measured HIFs showed high (significant) correlation with QoE-MOS. When HIFs were combined with existing state-of-the-art technology-centric speech quality metrics, e.g., as in (4) and (7), improvements in QoE measurement performance were observed and relative gains of 20.8 and 26.3 % were seen for far-field and TTS systems, respectively. These findings suggest that the affective states can indeed directly influence a listener’s perceived experience (or QoE) with a new telecommunication service.
Nonetheless, despite the improvements seen when adding HIFs to objective quality models [i.e., (4) and (7)], there was still a gap to perfect goodness-of-fit, thus suggest-ing that the inclusion of alternate additional HIFs may be important. To this end, future studies should investigate the effects of e.g., attention, cognitive load, fatigue and/or user engagement.
aBCI advantages and limitations
The use of affective BCIs during subjective QoE assessment has two major advantages. First, aBCIs may allow for monitoring of the listener’s affective states in an objective manner, thus potentially reducing listener biases in subjective tests, particularly for TTS systems [62]. To this end, typical EEG-based metrics were used to quantify two emo-tional primitives: arousal and valence. More specifically, the alpha-band frontal inter-hemispheric asymmetry index (AI) was used as a correlate of valence and the medial beta power (MBP) as a correlate of arousal [47, 48]. The gaps observed between models (4) and (5) for hands-free communications and between models (7) and (8) for TTS sys-tems, however, suggest that improved EEG features may still be needed.
In order to better understand the observed gap between QoE models found with sub-jective and with aBCI features, Pearson correlations were calculated between AI and MBP and the subjective valence and arousal ratings. For dataset 1 (hands-free), it was found that AI was significantly correlated with valence with a correlation coefficient of 0.41 (p≤0.05) and MBP was weakly correlated with arousal with a coefficient of − 0.24 (p≤0.1). For Dataset 2 (TTS), in turn, AI showed a significant positive correla-tion with valence (0.52;p≤0.05) and MBP a weakly-significant correlation with arousal (−0.29;p≤0.06). Overall, it is expected that more powerful models can be obtained once improved aBCI features are developed. Alternately, additional neuro-physiological signal modalities may be incorporated for human affective state monitoring, such as fNIRS, galvanic skin response, and eye tracking. The development of such “hybrid” affec-tive BCIs is the aim of our ongoing research.
proposed objective regressors could be used for such tasks. Overall, gains of 12.5 and 14.5 % in QoE measurement could be seen once aBCI features were used, relative to using only technological factors, for the hands-free and TTS systems, respectively.
Conclusion
Speech QoE perception is known to be influenced by internal human factors, as well as external technological and contextual factors. Existing objective QoE models, however, have focused mostly on the latter two and have omitted human QoE factors, such as affective states, from the equation. In this paper, we have taken the first steps towards showing the importance of incorporating human affective states into speech QoE mod-els, both subjectively and objectively. Subjectively, we showed the impact of speech dis-tortions on the listener’s perceived valence and arousal states, and in turn, their effect on perceived QoE. Objectively, on the other hand, we have proposed the use of affective BCIs to measure the listener’s valence and arousal levels. Through regression analysis, we showed that features extracted from an EEG-based BCI could improve QoE models performance by as much as 12.5 and 14.45% for hands-free communication and TTS systems, respectively.
Authors’ contributions
RG carried out the conception and design of the experiment, implementation, experimental data collection and analysis, and manuscript drafting phases of the above work. KL and HB participated in the experimental data collection and analysis, and manuscript drafting phase of the work. TF was involved with the conception and design of the experiment, experimental analysis and manuscript editing phase of the work. All authors read and approved the final manuscript. Author details
1 INRS-EMT, University of Quebec, 800, Rue de la Gauchetière Ouest, Suite 6900, Northwest Wing, Place Bonaventure, H5A-1K6 Montreal, Canada. 2 Alberta Health Services, Calgary, Canada.
Acknowledgements
The authors thank MDEIE, FQRNT, and NSERC for funding; Jan-Niklas Antons, Raymundo Cassani, Andrea Clerico, and Isabela Albuquerque for help with data acquisition; and Nuance Communications for invaluable discussions and access to relevant voice talent recordings.
Competing interests
The authors declare that they have no financial or non-financial interests.
Received: 26 September 2015 Accepted: 27 February 2016
References
1. Leeb R et al (2012) A tetraplegic patient controls a wheelchair in virtual reality. BRAINPLAY 07 Brain Comput Inter-faces Games Workshop ACE Adv Comput Entertain 2007:37
2. Li H, Li Y, Guan C (2006) An effective BCI speller based on semi-supervised learning. 28th Annual international con-ference of the IEEE engineering in medicine and biology society, EMBS’06. IEEE, New York, pp 1161–1164
3. Mühl C et al. (2011) Modality-specific Affective Responses and their Implications for Affective BCI. In: Proceedings of the 5th international brain-computer interface conference. pp 120–123
4. Nijholt A (2009) BCI for games: a ’state of the art’ survey. Entertain Comput ICEC 2008:225–228 5. Hjelm SI (2003) Research + design: the making of Brainball. Interactions 10(1):26–34
6. Lee N, Broderick AJ, Chamberlain L (2007) What is ’neuromarketing’? A discussion and agenda for future research. Int J Psychophysiol 63(2):199–204
7. Jackson MM, Mappus R (2010) Applications for brain-computer interfaces. Brain Comput Interfaces 89–103 8. Koelstra S, Patras I (2013) Fusion of facial expressions and EEG for implicit affective tagging. Image Vis Comput
31(2):164–174
9. Qualinet (2012) QUALINET white paper on definitions of quality of experience. Technical report, QUALINET cost: European network on quality of experience in multimedia systems and services
10. Laghari K, Connelly K, Crespi N (2012) Toward total quality of experience: a QoE model in a communication ecosys-tem. IEEE Commun Mag 50:58–65. doi:10.1109/MCOM.2012.6178834
13. Pereira F (2011) Panel on quality of experience in applications, standardization and certification. In: Proc. quality of multimedia experience workshop. Belgium
14. Zeng Z (2009) A survey of affect recognition methods: audio, visual, and spontaneous expressions. IEEE Trans Pat-tern Anal Mach Intell 31(1):39–58
15. McDuff D et al. (2012) AffectAura: an intelligent system for emotional memory. In: Proceedings of the SIGCHI confer-ence on human factors in computing systems. ACM, New York, pp 849–858
16. Calvo R (2010) Affect detection: an interdisciplinary review of models, methods, and their applications. IEEE Trans Affect Comput 1(1):18–37
17. Bos DO EEG-based emotion recognition: the Influence of visual and auditory stimuli. http://hmi.ewi.utwente.nl/ verslagen/capita-selecta/CS-Oude_Bos-Danny.pdf
18. Gupta R, Falk TH (2015) Affective state characterization based on electroencephalography graph-theoretic features. 7th international IEEE/EMBS conference on neural engineering (NER). IEEE, New York, pp 577–580
19. Clerico A, Gupta R, Falk TH (2015) Mutual information between inter-hemispheric EEG spectro-temporal patterns: a new feature for automated affect recognition. 7th international IEEE/EMBS conference on neural engineering (NER). IEEE, New York, pp 914–917
20. Rutkowski TM (2011) Interactive component extraction from fEEG, fNIRS and peripheral biosignals for affective brain-machine interfacing paradigms. Comput Hum Behav 27(5):1512–1518
21. Antons J (2012) Analyzing speech quality perception using electroencephalography. IEEE J Sel Top Signal Process 6(6):721–731
22. Arndt S et al (2012) Perception of low-quality Videos analyzed by means of Electroencephalography. In: Fourth inter-national workshop on quality of multimedia experience (QoMEX). Yarra Valley
23. Gupta R et al. (2013) Using fNIRS to characterize human perception of TTS system quality, comprehension, and flu-ency: preliminary findings. In: Proceedings of the fourth workshop on perceptual quality of systems (PQS) 73–78 24. Ferrari M, Mottola L, Quaresima V (2004) Principles, techniques, and limitations of near infrared spectroscopy. Can J
Appl Physiol 29(4):463–487
25. Strait M, Scheutz M (2014) What we can and cannot (yet) do with functional near infrared spectroscopy. Front Neurosci 8
26. Hinterleitner F et al. (2012) What makes this voice sound so bad? A multidimensional analysis of state-of-the-art text-to-speech systems. In: IEEE spoken language technology workshop (SLT). IEEE, New York, pp 240–245 27. Kondo K (2012) Subjective quality measurement of speech: its evaluation, estimation and applications
28. ITU-T (1996) Methods for subjective determination of transmission quality, ITU-T recommendation P.800. Technical report, International Telecommunication Union. Geneva
29. Hone KS, Graham R (2001) Subjective assessment of speech-system interface usability. In: INTERSPEECH, pp 2083–2086
30. Lang PJ (1995) The emotion probe: studies of motivation and attention. Am Psycholo 50(5):372–385
31. Mehrabian A (1980) Basic dimensions for a general psychological theory: implications for personality, social environ-mental and developenviron-mental studies. Oelgeschlager, Gunn & Hain, Cambridge, MA
32. Bradley MM, Lang PJ (1994) Measuring emotion: the self-assessment manikin and the semantic differential. J Behav Ther Exp Psychiatr 25:49–59
33. Wolf G Measuring mood-current research and new ideas. Quantified self labs. http://quantifiedself.com/2009/02/ measuring-mood-current-resea/
34. Morris JD (1995) Observations: SAM: the self assessment manikin, an effecient cross-cultural measurement of emo-tional response. J Advert Res 35(6):63–68
35. Kai S (2009) An improved valence-arousal emotion space for video affective content representation and recogni-tion. In: IEEE international conference on multimedia and expo (ICME). 566–569. doi:10.1109/ICME.2009.5202559 36. ITU-T (2001) P.862: perceptual evaluation of speech quality (PESQ): an objective method for end-to-end speech
quality assessment of narrow-band telephone networks and speech codecs. Technical report, ITU-T. Rec
37. ITU-T (2011) ITU-T recommendation P.863: perceptual objective listening quality assessment, technical report. ITU-T, Geneva
38. ITU-T (2004) ITU-T recommendation P.563: single-ended method for objective speech quality assessment in narrow-band telephony applications. Technical report. ITU-T, Geneva
39. Falk TH, Chan W-Y (2008) A non-intrusive quality measure of dereverberated speech. In: Proceedings of the interna-tional workshop on acoustic echo and noise control (IWAENC)
40. Falk TH, Zheng C, Chan W-Y (2010) A non-intrusive quality and intelligibility measure of reverberant and dereverber-ated speech. IEEE Trans Audio Speech Lang Process 18(7):1766–1774
41. Falk TH, Möller S (2008) Towards signal-based instrumental quality diagnosis for text-to-speech systems. Signal Process Lett IEEE 15:781–784
42. Norrenbrock CR (2015) Quality prediction of synthesized speech based on perceptual quality dimensions. Speech Commun 66:17–35
43. Eyben F, Wöllmer M, Schuller B (2010) Opensmile: the munich versatile and fast open-source audio feature extractor. In: Proceedings of the international conference on multimedia. ACM, New York, pp 1459–1462
44. Miskovic V, Moscovitch DA, Santesso DL, McCabe RE, Antony MM, Schmidt LA (2011)Changes in EEG cross-fre-quency coupling during cognitive behavioral therapy for social anxiety disorder.Psychol Sci 22(4):507-516 45. Heller W, Levy J (1981) Perception and expression of emotion in right-handers and left-handers. Neuropsychologia
19(2):263–272
46. Davidson R (1983) Hemispheric specialization for cognition and affect, vol 2
47. Coan JA, Allen JJB (2004) Frontal EEG asymmetry as a moderator and mediator of emotion. Biol Psychol 67:7–49 48. Arndt S (2013) The effects of text-to-speech system quality on emotional states and frontal alpha band power. In:
49. Phan KL, Taylor SF, Welsh RC, Decker LR, Noll DC, Nichols TE, Britton JC, Liberzon I (2003) Activation of the medial prefrontal cortex and extended amygdala by individual ratings of emotional arousal: a fmri study. Biol Psychiatr 53(3):211–215
50. Perlstein WM, Elbert T, Stenger VA (2002) Dissociation in human prefrontal cortex of affective influences on working memoryrelated activity. In: Proceedings of the National Academy of Sciences, USA 99:1736–1741
51. Garofolo JS (1988) Getting started with the DARPA TIMIT CD-ROM: an acoustic phonetic continuous speech data-base. National Institute of Standards and Technology (NIST), Gaithersburgh, MD, p 107
52. ITU-T (2011) ITU-T recommendation P.56: objective measurement of active speech level, technical report. Interna-tional Telecommunication Union, Geneva
53. Antons J-N, Laghari K, Arndt S, Schleicher R, Moller S, O’Shaughnessy D, Falk T (2013) Cognitive, affective, and experi-ence correlates of speech quality perception in complex listening conditions. In: 2013 IEEE international conferexperi-ence on acoustics, speech and signal processing (ICASSP), May 2013, pp 3672–3676
54. Gupta R, Banville HJ, Falk TH (2015) PhySyQX: a database for physiological evaluation of synthesised speech quality-of-experience. In: IEEE workshop on applications of signal processing to audio and acoustics (WASPAA). IEEE, New York, pp 1–5
55. ITU-T (1994) P. 85. A method for subjective performance assessment of the quality of speech voice output devices. International Telecommunication Union, CH-Genf
56. Delorme A, Makeig S (2004) EEGLAB: an open source toolbox for analysis of single-trial EEG dynamics including independent component analysis. J Neurosci Methods 134:9–21
57. Lee EJ, Nass C, Brave S (2000) Can computer-generated speech have gender? An experimental test of gender stereotype. CHI’00 extended abstracts on Human factors in computing systems 289–290
58. Mullennix JW, Stern SE, Wilson SJ, Dyson C-l (2003) Social perception of male and female computer synthesized speech. Comput Hum Behav 19(4):407–424
59. Geerts D et al (2010) Linking an integrated framework with appropriate methods for measuring QoE. In: Second international workshop on quality of multimedia experience (QoMEX). IEEE, New York, pp 158–163
60. Wechsung I (2012) Measuring the quality of service and quality of experience of multimodal human-machine interaction. J Multimodal User Interfaces 6(1–2):73–85
61. Sackl A et al (2012) Wireless vs. wireline shootout: How user expectations influence quality of experience. In: Fourth international workshop on quality of multimedia experience (QoMEX). IEEE, New York, pp 148–149
62. Pisoni DB (1997) Perception of synthetic speech. Progress in speech synthesis. pp 541–560 (1997)