R E S E A R C H
Open Access
Empowering the selection of demand
response methods in smart homes:
development of a decision support
framework
Dennis Behrens
*, Thorsten Schoormann, Sebastian Bräuer and Ralf Knackstedt
* Correspondence:dennis.behrens@ uni-hildesheim.de
University of Hildesheim, Universitätsplatz 1, 31141 Hildesheim, Germany
Abstract
Demand Response (DR) facilitates the monitoring and management of appliances in energy grids by employing methods that, for example, increase the reliability of energy grids and reduce users’cost. Within energy grids, Smart Home scenarios can be characterized by a unique combination of appliances and user preferences. To increase their impact, a scenario-specific selection of the best performing DR methods is necessary. As the user faces a multitude of heterogeneous DR methods to choose from, a complex decision problem is present. The primary goal of this study is to develop a decision support framework that can determine the best-performing DR methods. Building on literature analyses, expert workshops and expert interviews, we identify seven requirements, derive solution concepts addressing these requirements, and develop the framework by combining the concepts using a benchmarking process as a template. To demonstrate the framework’s applicability, we conduct a simulation study that uses artificial
(simulated) data for seven types of households. Within this study, we employ four DR methods, assume changing appliances over time and cost minimization as primary objective. The study indicates, that by using the framework and thus by identifying and using the best DR method for each scenario, the users can achieve further cost benefits. The application of the framework allows practitioners to increase the efficiency of the DR method selection process and to further enhance DR-related benefits, such as cost minimization, load profile flattening, and peak load reduction. Researchers benefit from guidance for benchmarking and evaluating DR methods.
Keywords:Demand side management, Demand response simulation, Benchmarking process, Home energy management system
Demand response in the residential context
Technological improvements, changing environmental conditions, altered consump-tion patterns, and rising polluconsump-tion levels (e.g., carbon emissions) challenge tradiconsump-tional energy grids (Lawrence et al. 2017). Renewable, but unstable, energy sources like photovoltaic (PV), wind power, and hydro power and new appliances such as electric vehicles (EVs) result in more volatile energy generation and consumption that affect both the supply side and the demand side (Seidel et al. 2013). Critical peaks,
contingencies, volatile load profiles, unreliable market performance, and inefficient in-frastructure use (Siano2014) can result in blackouts, brownouts, shortages, and a high spinning reserve and can endanger the reliability of energy grids. The major transfor-mations in the residential context, in particular through the increased use of EVs and decentralized energy generation and energy storage, contributes to this problem be-cause the energy consumed in this sector amounts to more than a third of total con-sumption (Hu and Li 2013; Jovanovic et al. 2016). One possible solution to the challenges in this context is the management of appliances in Smart Homes (Koolen et al.2017).
Appliance management can be carried out by Demand Response (DR). DR optimizes consumption patterns by, for example, using external signals (e.g., pricing signals, direct controlling signals). Optimization is then performed by shifting or managing loads based on incentive-based or price-based programs (Merkert et al. 2015), the latter are often realized through dynamic pricing (e.g., time-of-use pricing (TOUP), critical-peak pricing, real-time pricing (RTP) (Siano2014; Steen et al.2012)). DR can also“transform domestic customers from static consumers into active participants” ((Molderink et al. 2010), p., 109), which especially promotes the implementation of decentralized energy generation (e.g., PV, storages) in the grid. Nevertheless, since DR is a complex task and pricing signals may change during the day (cf., RTP), it can hardly be carried out manu-ally by the users without assistance. Especimanu-ally the reaction on changing price signals would require significant user efforts regarding time and participation as consumption plans need to be adapted on multiple times throughout the day. Therefore, applying DR in the residential context requires supporting infrastructure, including, for instance, a Smart Meter and a Home Energy Management System (HEMS) (e.g. (Chaudhari et al.2014)).
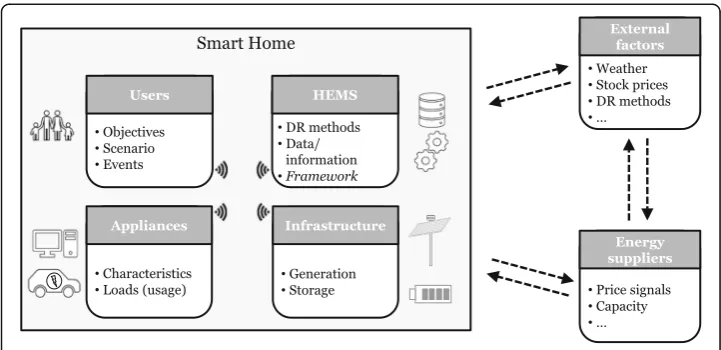
A HEMS is a system that enables DR applications for residential users (Zhao et al. 2013) by monitoring and automatically managing appliances based on a user-specific set of requirements (REQs) (e.g., (Hu and Li 2013; Zhao et al. 2013; Han et al. 2014; Kuzlu et al. 2012)). Thereby, a HEMS can be assigned to a single home or multiple homes, especially in the latter case forming a microgrid (e.g., (Jiang and Fei 2015)). REQs are composed of the user-specific scenarios, including living behaviors, appli-ances, available storage, and energy-generation infrastructures, and consider environ-mental factors like weather, stock prices, and price signals (Fig.1).
To address these REQs, various DR methods can be applied that, for instance, differ regarding their objectives, optimization methods, and communication models (Kosek et al. 2013). Overviews can be found in (Balijepalli et al. 2011; Al-Sumaiti et al. 2014; Gerwig et al.2015). DR methods are here understood as algorithms that are developed to solve optimization problems in the DR context in light of constraints and desired goals. However, (Khadar et al. 2017) denotes, that no sophisticated comparison of DR method performance is done yet. Moreover, to the best of our knowledge, no approaches have been developed so far that support this comparison and a selection of best performing DR methods for a user-specific scenario.
adaptable for all kinds of HEMSs. A framework is suitable for this task, since it can provide a reusable structure and it can be adapted to fit individual needs (Johnson and Foote 1988). In this study, we develop a decision support framework that assists in selecting the best DR method for a user-specific scenario.
The application of the framework allows practitioners to increase the efficiency of the DR method selection process and to further enhance DR-related benefits, such as cost minimization, load profile flattening, and peak load reduction. Researchers can use the framework to compare the effects of existing DR methods in varying scenarios and thus inform the enhancement of their methods and underlying algorithms.
We proceed by describing related work in Section“Related Work”and the chosen re-search design in Section “Research Design”. In the next step, we gather seven REQs based on the literature analyses, expert workshops and expert interviews (Section “Gathering Requirements”), derive solution concepts (SOCs) (Section “Deriving Solu-tion Concepts”), and assemble them into a decision support framework (Section “ As-sembling the Framework”). To demonstrate our framework’s applicability, we implement a software prototype and conduct a simulation study with illustrative exam-ples extracted from artificial data that build on real-world scenarios (Section “ Demon-stration”). Finally, we discuss our findings and provide an outlook on future research (Section“Conclusion”).
Related work
Based on an extensive literature analysis (seeAppendix 1), we identified a set of contri-butions to the domain of DR methods that include comparisons, benchmarks, and eval-uations of DR methods. Although some of these studies perform benchmarking, most provide evaluations, especially argumentative comparisons of types of methods (e.g., (Sianaki et al. 2010)), proofs that a particular method can find an optimum (e.g., (Lab 2018)), evaluations against the status quo (e.g., (Gerwig et al. 2015)), and descriptions of methods with a variation of different input factors (e.g., (Mohsenian-Rad et al. 2010)). Among these, proving a method’s ability to find an optimum is in many cases not possible since a complex optimization problem is solved with a heuristic or the
solving process is too complex and time-consuming. Decision support systems are often used in the energy field (e.g., (Sellak et al.2017)), but we found no suitable system or framework that could meet our research goal and no solution in the extant literature could be discovered.
Moreover, most working groups and research projects that address this topic focus on the organizational levels and grid levels and do not compare or evaluate DR methods. For instance, “MOSAIK” (a flexible simulation framework for smart grids (MOSAIK2018)), uses a co-simulation approach to simulate methods and scenarios for a large energy grid with multiple elements like different consumers, decentralized en-ergy generation and EVs (Schloegl et al. 2015). “DER-CAM” focuses on minimizing costs by optimizing on-site generation and heat and power systems (Lab2018) in build-ings and microgrids, and bases on an optimization problem with multiple objectives. However, the authors state that the optimization problem must be solved by a heuristic, a greedy-based solving strategy. So even if the method’s ability to find the optimal solu-tion is proven, a solusolu-tion is often found with a heuristic, and the results differ based on the chosen algorithm. Other projects can be found, such as Smart Grid Algorithm Engineering, Smart Nord, and D-Flex (Blank et al. 2015), have been addressed, but none realizes a way to select a DR method for individual scenarios. Besides the litera-ture search and the analysis of existing projects and research groups, the energy informatics field might offer helpful insights (Goebel et al.2014).
Our research aims at increasing energy efficiency by supporting the user-specific se-lection of DR methods that are used on HEMS in residential buildings (here Smart Homes) (Goebel et al. 2014). Similar research activities fail to compare, evaluate, and benchmark DR methods, although they address, for example, distributed and renewable energy resources (e.g., (Berthold et al. 2017; Dyson et al. 2014)), islanded grids (e.g., (Vergara et al.2018; Ma and Billanes2016)) or grids in general (e.g., (Steinbrink et al. 2017)), the energy grid in smart cities (e.g., (Masera et al.2018; Stoyanova et al.2017)), security concerns (e.g., (Fulli et al.2017)), EVs and batteries in general (e.g., (Park et al. 2016; Ma et al. 2010)), energy contracts (e.g., (Basmadjian et al. 2016)), or data and privacy concerns (e.g., (Cupelli et al.2018)).
Leaving the immediate field of DR methods, Ketter et al. (Ketter et al. 2016) present competitive benchmarking, an approach for the comparison of solutions to wicked problems. For demonstration, they select the topic of sustainable energy and financial market stability (Ketter et al.2016) and the Trading-Agent-Competition (TAC) (Ketter et al. 2011). The TAC, which has several customer models that represent households, businesses, and so forth, takes a supplier perspective, while the demand perspective is “fixed”. However, by fixing the demand perspective, the stated research question is not sufficiently answered, as the focus lies on the Smart Home Context. In this context, the supplier is the black box and delivers information like a cost function or penalty costs for high peaks (O’Connell et al.2014) Although benchmarking is frequently addressed in the DR field, to the best of our knowledge, the field currently offers no support for decision-making in our context.
“plan-do-check-act”-cycle from Deming (Deming 1982). The planning phase is about what to benchmark, and identifying who and which resources are involved. Afterwards, in the collecting phase, benchmarking objects need to be analyzed by defining needed data and measurements. In the analyzing phase, the performance of the benchmarking objects is compared, and gaps between these performances are identified. During the improving phase, necessary actions need to be identified, to move, originally the busi-ness, forward and improve, for example business processes.
Research design
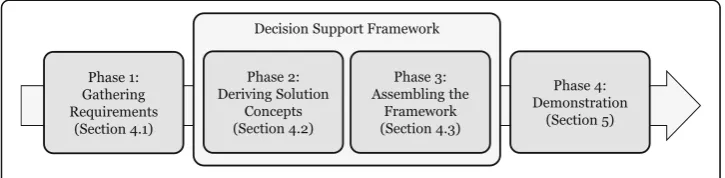
Our research began with the identification of a practical problem. An industry partner that plans to design and implement a HEMS, asked, what kind of services could be additionally offered to the customers, based on this HEMS. They state the delivery of an optimized energy consumption plan to energy-users to be useful, because users can realize cost benefits. As the HEMS should be used in diverse surroundings, an “ opti-mal” DR method could not be chosen easily. Because of the high individuality of user scenarios and the variety of DR methods, a decision-making approach must be imple-mented on these HEMS that supports the ability to select a method that best fits each scenario. To develop the framework, we carried out a staged research design (Fig. 2) that consists of gathering REQs (Section “Gathering Requirements”), suggesting SOCs (Section “Deriving Solution Concepts”), assembling the decision support framework from these SOCs (Section“Assembling the Framework”), and demonstrating the applic-ability of the framework by simulating various scenarios (Section “Demonstration”). In the following, each of these phases is described in detail.
Phase 1: Gathering Requirements
In this phase, REQs are derived from the knowledge base inductively. We build on existing literature (literature analysis) and expert knowledge (expert interviews) and de-rive several REQs based on Deming’s general benchmarking approach (Deming1982).
Phase 2: Deriving Solution Concepts
We suggested SOCs that address each REQ individually by searching for information in existing research and by interviewing experts. These SOCs are only addressing the REQs, but still must be combined to realize the decision support framework.
Phase 3: Assembling the framework
After gathering REQs and deriving SOCs, we used Deming’s (Deming 1982) bench-marking process as guidance and matched each SOC to it. We also analyzed informa-tion flows from both inside and outside the framework and added, for example, event triggers for changes in the scenario.
Phase 4: Demonstration
For the demonstration, we implemented a software prototype that features four DR methods and a database suitable for conducting simulations. The aim of this research is not to evaluate the exemplarily implemented methods but to show that our framework is feasible and applicable. As the framework should be reusable and adaptable, it is not HEMS-specific and so is (re-)useable on many kinds of systems. We used artificial data that have minor disadvantages but are of sufficient quality (Cao et al. 2013) to conduct meaningful DR simulations. As the simulation is an artificial setting, we impose several events to simulate changes in the scenario (e. g., additional appliances, defects of appli-ances, altered user behavior).
Decision support framework Gathering requirements
This section presents seven REQs for a decision support framework grounded in gen-eral benchmarking approaches (that follow a plan-collect-analyze-improve cycle (Lugauer et al. 2012)), a literature analysis, a review of several DR methods (e.g., found in (Balijepalli et al. 2011; Al-Sumaiti et al. 2014; Gerwig et al. 2015; Barbato and Capone2014)), and expert interviews (Behrens et al.2017).
Inspired by the first benchmarking phase (planning phase) (Camp 2006), we define the benchmarking objects and benchmarking goals (Heib et al. 1997). Benchmarking objects reference to the entities to be compared, such as companies, divisions in a com-pany, or even products, processes, and functions (Heib et al.1997). In our study, these benchmarking objects are DR methods. Benchmarking goals are the objectives that the benchmarking process seeks to achieve, such as improving the energy efficiency of Smart Homes by selecting the best DR method for a certain situation. However, “best” depends on how the term is defined. As it relates to DR (Gellings 1985),“best” can be the method that reduces peak loads and costs or the method that ensures a flattened load profile. These objectives may differ in different homes or over time according to the users’preferences. Consequently:
REQ1—Objective(s) Specification: Provide features that allow users to specify their individual objectives.
individual scenario, this specific scenario needs to be represented first—regardless which data is chosen (e.g., forecasting data, past data, manual data from the user). DR can be divided into two phases: data acquisition (often broken down to forecasting) and optimization (Simmhan et al. 2011) (Fig. 3). User-specific data (e.g., deadlines for finishing appliances and times during which the user cannot run appliances) must be added in or after the first phase and used in the second.
We need an adjustment between these two phases, for example, to identify the pos-sible using intervals of appliances (e.g., (Behrens et al. 2017)). This can be done auto-matically (e.g., by predicting user’s behavior and needs) or manually by the user. Consequently:
REQ2—Scenario Building: Provide features that allow users to build individual scenarios.
Another part of collecting data is to ensure its quality, which has been identified as a problem in DR research (e.g., (Cao et al.2013; Barta et al.2014)). Data on energy use is often recorded in heterogeneous ways, so the data structures are not standardized and information (e.g., whether an appliance is deferrable) may be missing (Behrens et al. 2016). Moreover, gaps in the data (Monacchi et al. 2014; Barta et al. 2014), such as missing recordings and zero values that are often caused by a malfunction of the Smart Meters, occur (Hoogsteen et al.2016). Regardless of which data is chosen, it must be in a suitable format and of high quality (Cao et al.2013). High quality thereby means, that needed information are given, the recording frequency is adequate, and missing values can either be predicted or filled without falsifying the data. Thus, data quality needs to be guaranteed through a suitable preprocessing (cf., (Barta et al.2014)). Consequently:
REQ3—Data Preprocessing: Provide features that allow the quality of the data to be ensured.
The second DR phase deals with optimization by DR methods and therefore delivers data for the analysis (third benchmarking phase). However, not all DR methods have directly comparable characteristics and therefore additional demarcation is needed. Dif-ferent characteristics, regarding their functionality and the considered appliances, infra-structure and constraints (Kosek et al. 2013; Gerwig et al. 2015; Behrens et al.2017) need to be addressed. Benchmarking must guarantee that the only methods that are compared are those that, for example, fulfill the same constraints (Behrens et al.2017). The methods themselves and the additional information need to be stored to enable the HEMS accessing them. Consequently:
REQ4—Method Comparability:Provide features that ensure the comparability of DR methods.
The calculation of assessment criteria is the last step of the data-collection phase. Assessment criteria like measures of energy consumption and savings must be calcu-lated and analyzed (Gerwig et al.2015). However, many possible criteria are offered in the DR field (e.g., (Balijepalli et al. 2011; Al-Sumaiti et al. 2014)), so the appropriate choices must be made. Hence, these criteria must be identified in a first step. Based on these definitions and after the methods calculated their results for a certain scenario, the assessment criteria need to be calculated. For ensuring a uniform calculation of the criteria’s measurements and comparability, we need a centralized computation, as the methods might have a different calculation or might even miss the calculation of single measurements. The DR methods must transfer the results in a suitable format to our framework, which—afterwards—calculates all assessment criteria for all comparable methods. Consequently:
REQ5—Result Calculation:Provide features that allow DR methods to be assessed based on established criteria.
Analysis, the third benchmarking phase, identifies best practices and performance gaps to enable improvement (e.g., (Lugauer et al. 2012; American Productivity and Quality Center1993)). In the DR context, this means we need a way to identify the best DR method to enable a decision making. “Best” in this case depends heavily on the user’s objectives (REQ1) and the user-specific scenario (REQ2). Based on this“ objecti-ve-function” identification, the calculated assessment criteria (REQ6) are interpreted. As we have multiple criteria, we must add a suitable decision making process (e.g., (Ho et al. 2010; de Boer et al.2001)). Multiple criteria are difficult to handle because their units of measure may differ, their levels of importance may differ, and so on. Conse-quently, the suitable decision making must be supported by identifying the best DR method, which can be selected by the user and then be deployed on the HEMS. Consequently:
REQ6—Decision Support:Provide features that allow the best DR method for a specified scenario to be identified.
REQ7—Event Reaction:Provide features that allow users to react to events.
Deriving solution concepts
We suggest possible SOCs to address the REQs, which are derived inductively from a literature review and interviews with experts.
SOC1—Let the user select the objectives to be achieved
The user should be presented a variety of options so he or she can choose which objec-tives are most important. Our literature search identified several DR objecobjec-tives, shown in Table 1, each of which can be reached using DR methods and can be provided for decision-making. The user can select the objective(s) to be reached (Fig. 7 inAppendix 2). As the “welfare”objective is difficult to measure but important for users (cf., (Jovanovic et al. 2016)), we consider it a given. The user can state his or her preferences based on usage patterns during scenario-building (REQ2) or select an automated way to predict preferences, for example, via forecasting based on historical data.
SOC2—Provide energy consumption data and let the users specify their energy consumption profile
The framework should provide several options for the user with which to select their energy composition: a predefined dataset (e.g., the last day or similar households), where only single loads are adapted to the user’s habits (e.g., an EV is added or the use intervals are changed); an empty dataset to build a scenario and add all appliances, plus additional information “bottom up”; past data recorded from the HEMS; or forecasted data. This step might be done manually (by the user) or automatically when the user gives a starting point and the framework then uses forecasting data. As privacy and data security are important topics (for example due to the general data protection regu-lation), data must not leave the HEMS. Based on the data provider, the user-specific scenario can be built (e.g., (Hoogsteen et al. 2016)). Besides selecting the data, additional user-specific information regarding the user’s welfare is needed, but defining the user’s wel-fare is not easy, so a utility function is often used in the DR context (e.g., (Li et al. 2012;
Table 1DR objectives derived from the literature
# DR objective Source (e.g.)
Ob1 Cost minimizationfor a (single) participant (savings in electricity bills) or even market-wide (e.g., through more effi-cient use of the infrastructure).
(Balijepalli et al.2011; Albadi and El-Saadany2008; Aghaei and Alizadeh2013; Abdollahi et al.2012; Gkatzikis et al.
2013)
Ob2 Minimization of peak loadsin the consumption profile, to reduce the need of high spinning reserves, etc.
(Balijepalli et al.2011; Conejo et al.2010; Raza et al.2013; Gyamfi et al.2010)
Ob3 Load profile flatteningby shifting demand, thereby reducing the cost of producing electrical energy.
(Conejo et al.2010; Raza et al.2013)
Ob4 Ensuring reliabilityto reduce the risk of outages and ensure the ability to react to contingencies by holding a spinning reserve.
(Abdollahi et al.2012; Conejo et al.2010; Raza et al.2013; Zakariazadeh et al.2014; Wang et al.2013)
Ob5 Maximization of market performanceby allowing consumers to affect the market, thereby reducing price volatility in the spot market.
(Albadi and El-Saadany2008)
Ob6 Maximization of users’utility(often also called welfare), to maximize the users comfort and preferences.
(Conejo et al.2010)
Samadi et al.2012; Mas-Colell et al.1995)), for example known from the microeconomics context. A questionnaire can be used to derive a utility function (Jovanovic et al. 2016). However, no standard has been defined for measuring the user’s welfare in a real use-case yet, so we let the user define the times when an appliance may run (e.g., the EV must be charged in the morning or the washing machine must be finished by 6:00 p.m.) (e.g., (Jova-novic et al.2016)).
SOC3—Sample the data, fill gaps, and reject unreliable data
To provide appropriate data, gaps and data-quality issues (e.g., time resolution) must be addressed. Most DR methods use a fifteen- or thirty-minute cycle to optimize load positioning (Abdulla et al.2017), as cycles of less than 1 minute or continuous record-ings are not required (and are difficult to achieve). We suggest a down-sampling with a frequency of 1 minute (e.g., (Hoogsteen et al. 2016) or (Palensky and Dietrich2011)) for 1440 recording points over 24 h, which is suitable for most DR methods. The gaps can be divided into two dimensions: the number of gaps for a certain day and the num-ber of (completely) missing days in the data. These gaps can be filled by writing in zero values or approximating the missing values (Cao et al. 2013). However, if too many values are missing to interpolate these values or by filling with zero values the data would be too much impure, the data is insufficient for the next steps and sorted out.
SOC4—Add metadata to the methods and form groups
Suitable metadata for DR methods must be identified in terms of its classification and characteristics. DR methods can be classified by two dimensions: Place of decision-making and used communication (Kosek et al.2013). The loads addressed and constraints met must also be determined, as, for example, methods that do not con-sider the same constraints cannot be compared (c.f., (Behrens et al. 2017)). Every method must be comparable with other methods from the same“class”and suitable for the scenario. Therefore, we add additional data (metadata) based on the DR method’s classification (Kosek et al.2013), the compliances addressed and the constraints consid-ered (Behrens et al. 2017). The methods themselves must be available in a repository, either locally on the HEMS or in the cloud.
SOC5—Establish measurements and provide needed data
SOC6—Identify the best method(s) based on user objectives and scenarios
To support decision-making, we rank the DR methods based on their results (SOC5) and the stated user objectives (SOC1). As we may have multiple criteria and objectives, we match a multi-objective function with multiple criteria. Additional difficulties occur because individual objectives might be weighted differently when their importance to the users differs. Hence, three cases are derived: only a single objective is selected, mul-tiple objectives with different weights are selected, and mulmul-tiple objectives are selected but no weights are given. To make the results comparable, a single number from the criteria (e.g., (Charnes et al. 1978; Cooper et al.2006)) using one of three strategies is formed:
If the user selects only a single objective, since we enable only one measure for each objective, we can directly compare the criteria with each other.
If the user selects two or more objectives and weights for each objective, a combined value with the formula∑Criteriai∗Weightifor each DR method can be
calculated.
If the user selects two or more objectives but no weights, equal weights are supposed and calculate the comparative value as in the second strategy.
SOC7—React to events by repeating the decision support process
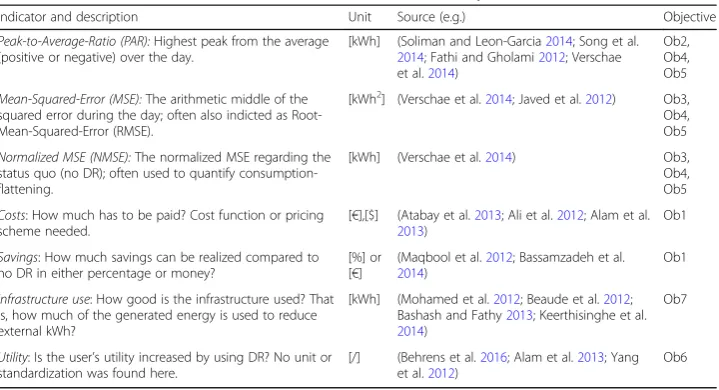
Reacting to events—here,“Appliance Events”and“Objective Events”—requires two ac-tions: implementing a monitoring strategy and implementing a suitable reaction strat-egy. The monitoring determines whether changes, such as a new appliance being added or a change in the infrastructure (e.g., because of a malfunction) occurred. The frame-work repeats the selection process if the user changes the objectives (“Objective Event”) but the process can jump to data collection phase and rebuild the database if the event is an“Appliance Event.”When the process is run for the first time, an“Initialization”is con-ducted, meaning that the process starts at the beginning with the user stating his or her ob-jective(s). In the monitoring phase, while the DR method is used, the framework receives Table 2Assessment criteria derived from literature (underlined objective number = default)
Indicator and description Unit Source (e.g.) Objective
Peak-to-Average-Ratio (PAR):Highest peak from the average (positive or negative) over the day.
[kWh] (Soliman and Leon-Garcia2014; Song et al.
2014; Fathi and Gholami2012; Verschae et al.2014)
Ob2, Ob4, Ob5
Mean-Squared-Error (MSE):The arithmetic middle of the squared error during the day; often also indicted as Root-Mean-Squared-Error (RMSE).
[kWh2
] (Verschae et al.2014; Javed et al.2012) Ob3, Ob4, Ob5
Normalized MSE (NMSE):The normalized MSE regarding the status quo (no DR); often used to quantify consumption-flattening.
[kWh] (Verschae et al.2014) Ob3, Ob4, Ob5
Costs: How much has to be paid? Cost function or pricing scheme needed.
[€],[$] (Atabay et al.2013; Ali et al.2012; Alam et al.
2013)
Ob1
Savings: How much savings can be realized compared to no DR in either percentage or money?
[%] or [€]
(Maqbool et al.2012; Bassamzadeh et al.
2014)
Ob1
Infrastructure use: How good is the infrastructure used? That is, how much of the generated energy is used to reduce external kWh?
[kWh] (Mohamed et al.2012; Beaude et al.2012; Bashash and Fathy2013; Keerthisinghe et al.
2014)
Ob7
Utility: Is the user’s utility increased by using DR? No unit or standardization was found here.
[/] (Behrens et al.2016; Alam et al.2013; Yang et al.2012)
event triggers and additional information from the HEMS. After receiving such an event, a specific phase is called and the information (e.g., the load profile of the new appliance) is handed over.
Assembling the framework
The next step in developing the decision support framework is to assemble and embed the SOCs to the framework and into the HEMS and into the environment. Next, we describe how we assembled the framework and how the framework interacts with the HEMS and the environment.
Assemble the Solution Concepts
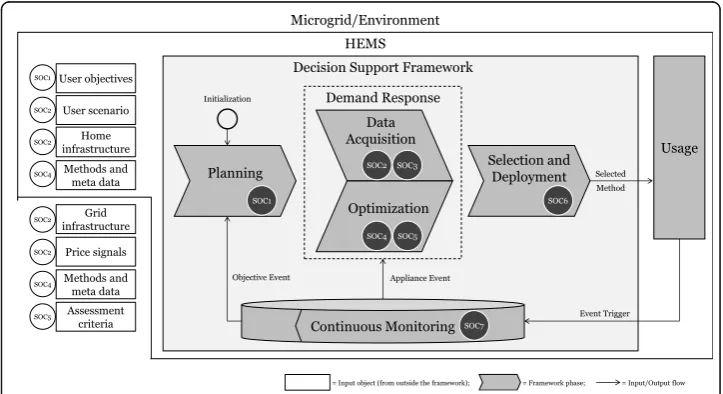
The REQs and SOCs are inspired by the benchmarking phases of (Lugauer et al.2012), so the framework is divided into four phases (see Fig. 4 for a visualization of the process and Table 3for an overview of the REQs and SOCs): The first phase,Planning, involves SOC1, the specification of the objective. The second phase,Demand Response, involves collecting data, including building the scenario (SOC2), preparing the data (SOC3), ensuring the comparability of methods (SOC4), and the calculating the mea-sures (SOC5). We divided this second phase into two sub-phases: data acquisition (SOC2 and SOC3) and optimization of the consumption plan (SOC4 and SOC5). The third phase,Decision and Deployment, identifies the best DR method based on the col-lected data, stated objectives, and so forth (SOC6), which is then deployed on the HEMS. In the last phase, Monitoring, the framework reacts to events that occur during the DR method’s use. If an event occurs, the framework guides either the HEMS (auto-mated) or the user (manual) back to the planning phase or the demand response phase (SOC7). When the decision process is first run, it begins with SOC1 (objective specification).
Embed the Framework
The framework requires inputs from the HEMS, the users, and the environment, so the framework must interact with those three entities. Both the inputs and the interactions are specified for each phase of the framework. In the Planning phase, users state their objectives, potentially on the HEMS’ (graphical) user interface (e.g., (Han et al. 2014; Khadar et al. 2017; Yener et al.2017)), as this interface is a suitable way to enable the user to transport his or her objectives into the framework. This phase occurs either on the initial use of the DR method or when an“Objective Event”occurs. In theDemand Response phase, the framework provides suitable data to the user for the purpose of scenario-building, again, potentially using the HEMS’ interface, and the user specifies individual appliances, intervals, etc. The HEMS can transfer these data to the frame-work. Even if an automated process of scenario-building (e.g., through forecasting) is chosen, the user can monitor and alter the scenario. In the third phase, Decision and Deployment, the framework shows the ranked DR methods in the HEMS’ interface based on their results and the users’stated preferences. Then either the user chooses his or her favored method, or the framework performs this choice automatically. The method is then deployed on the HEMS. Finally, in the Monitoring phase, the deployed method is used on the HEMS, and any change events that occur are reported to the framework, as well as additional information (e.g., new objective given, new appliance installed). If an“Objective Event”occurs, for example because the user changes the ob-jectives in the HEMS’ interface, these altered objective(s) need to be reported to the framework. If an “Appliance Event” occurs, the altered appliance(s) need to be re-ported, for example the consumption profile of the (new) appliance. The framework then continues with the decision process and delivers the new information.
Demonstration
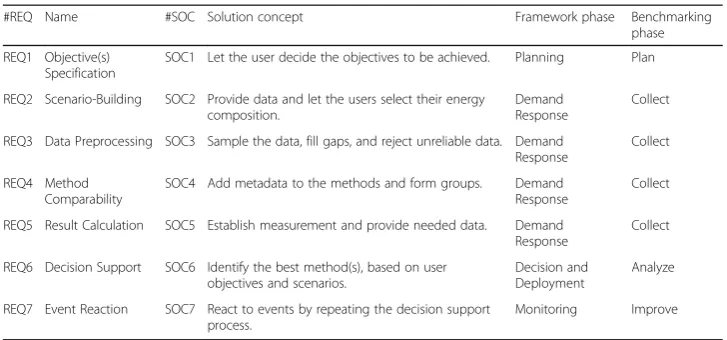
To demonstrate the framework’s feasibility and applicability, we conducted several sim-ulations. We instantiated the SOCs (Section “Instantiation of Framework”) and de-signed an illustrative scenario (Section “Demonstration Case”). The instantiation consists of the framework itself (visualized with a graphical user interface, simulating the HEMS interface) and four DR methods, each of which follows the same optimization problem and fulfills the same constraints (for the description of the Table 3Derived REQs and SOCs (overview)
#REQ Name #SOC Solution concept Framework phase Benchmarking phase
REQ1 Objective(s) Specification
SOC1 Let the user decide the objectives to be achieved. Planning Plan
REQ2 Scenario-Building SOC2 Provide data and let the users select their energy composition.
Demand Response
Collect
REQ3 Data Preprocessing SOC3 Sample the data, fill gaps, and reject unreliable data. Demand Response
Collect
REQ4 Method Comparability
SOC4 Add metadata to the methods and form groups. Demand Response
Collect
REQ5 Result Calculation SOC5 Establish measurement and provide needed data. Demand Response
Collect
REQ6 Decision Support SOC6 Identify the best method(s), based on user objectives and scenarios.
Decision and Deployment
Analyze
REQ7 Event Reaction SOC7 React to events by repeating the decision support process.
optimization problem and the constraints, see Appendix 4). We exemplarily imple-mented two solving strategies with two variations per strategy: greedy-based (min and max) (Sianaki et al. 2010) and multi-agent-system-based (with and without communi-cation) (Mohsenian-Rad et al.2010) (for additional information seeAppendix 3).
We have chosen an artificial setting for the demonstration scenario. Consequently, events are triggered manually and the users’objective(s), appliances, and so on are simu-lated. To consider multiple homes and the effects of a method selection, we simulated a microgrid consisting of several homes. We included different home configurations (e.g., varying appliances, usage patterns, etc.). To simulate changes, we introduce two appli-ances events, namely the consideration of an EV with regular, domestic (AC) charging and furthermore, the installation of corresponding fast-charging infrastructure (DC).
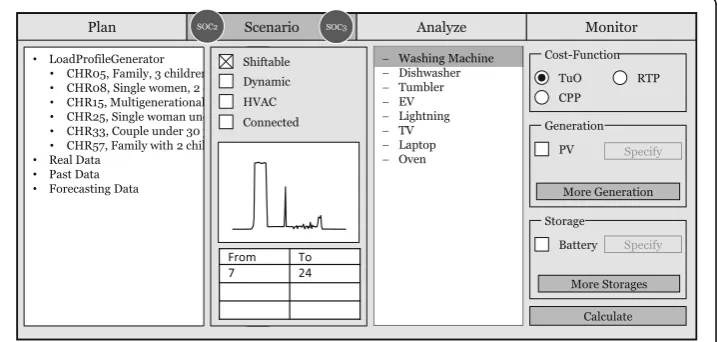
Instantiation of framework
We implemented the software prototype in Java so we could use common libraries to visualize the results or read out data. At the beginning of the decision process, the user must select the objectives to be achieved (SOC1). In our demonstration case, we use cost minimization, represented by savings, as measurement (see Fig. 7 inAppendix 2). As for the user-specific data for the selection process (SOC2), we use artificial data, for example, for use intervals. We use a TOUP, and as no storage or generation infrastructure is in the demon-stration scenario, these data are not added (see Fig. 8 inAppendix 2). The data itself must be in a suitable format (SOC3), so we choose a 15-minute interval to match the proposed DR methods. As the data are simulated, there are no gaps. Each DR method has a meta file that provides additional metadata (SOC4). Once optimized, the resulting consumption plan is sent to the framework. Next, the indicators are calculated and written into an output file for documentation, and the measurements are calculated with the information given (SOC5). With these criteria and based on the objectives from SOC1, a ranked list of methods is cre-ated (SOC6), and the results are displayed (see Fig. 9 inAppendix 2). The selected method is deployed on the HEMS (see Fig. 10 inAppendix 2). Afterwards, the framework switches to the monitoring phase (SOC7), where two events occur, and the analysis is repeated.
Demonstration case
To build a suitable foundation for this test case, appropriate data must be selected and prepared (SOC2 and SOC3). At the beginning, we used recorded data from naturalistic homes (analyzed, for example, in (Monacchi et al. 2014; Behrens et al. 2016)), which cover existing scenarios of real users, so no assumptions needed to be made (cf. (Barta et al. 2014)). However, we had to add information about, for example, the time of use of certain appliances, so we added artificial data using theLoadProfileGenerator(LPG) (Pflu-gradt 2017) to ensure sufficient data quality (cf., (Cao et al. 2013; Hoogsteen et al.2016)). LPG has several predefined load profiles and uses a behavior model to simulate the data.
We used seven predefined households from the LPG as a demonstration case. House-holds’ inhabitants differ in terms of their ages, jobs, habits, and daily routines. Conse-quently, the consumption amounts and patterns in these households differ.
Basic scenario details
1. A couple (male, age 40; female, age 35), both of whom work outside the home, with three children (male, age 13; male, age 6; female, age 4), requires 4001.24 kWh throughout the year (min (day): 0.16 watts, max (day): 8914.97watts). 2. A working woman (age 30) with two children (males, ages 11 and 7) requires
3277.88 kWh throughout the year (min: 0.16 watts, max: 7364.95 watts).
3. A multigenerational home with a working couple (male, age 40; female, age 32), two children (female, age 15; male, age 4), and two seniors (male, age 70; female age 68) requires 8279.49 kWh throughout the year (min: 0.50 watts, max: 13,624.86 watts). 4. A working woman, age 25, requires 1778.51 kWh throughout the year (min: 0.16
watts, max: 8644.84 watts).
5. A working man, age 26, requires 1512.73 kWh throughout the year (min: 0.16 watts, max: 7208.11 watts).
6. A working couple (male, age 25; female, age 23) requires 2448.96 kWh throughout the year (min: 0.16 watts, max: 6370.82 watts).
7. A couple (working man, age 45; female homemaker, age 43) with two children (male, age 20; female, age 14) requires 4112.76 kWh throughout the year (min: 0.16 watts, max: 10,643.47 watts).
Deferrable appliances within the homes are washing machines, dryers, and dishwashers. The duration, time, and quantity of appliances, which depend on the life styles and behavior of the residents, are provided. We added the following information, that are visualized in Fig.5:
The deferrable appliances may not run between 12 a.m. and 7 a.m.
The working residents leave at 7 a.m. and return at 6 p.m., thus an EV cannot be charged in between.
Our test case uses a TOUP. The price from 0:00–06:00 and 22:00–24:00 is€0.24 per kWh, and the price from 06:00–22:00 is€0.36 per kWh.
Scenario variations
(Appliance Event 2). As a result, we have three variations of our scenario, caused by two Appliance Events (see Table4for a summarized scenario description).
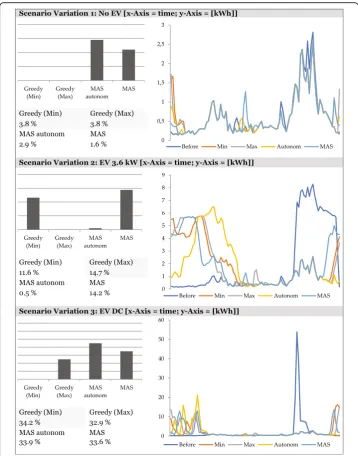
Results of the demonstration case
After we built the demonstration case, the implemented DR methods calculate the new consumption plans and transfer them to the framework. The measurements are calculated, and the best method is identified based on the selected objective, in this case, cost savings (see Fig. 6). The results indicate that the performances of the particular DR method depends on the scenario. Without an EV, the best methods are the two greedy methods. This changes, if an EV is considered, as this shifts load to the morning hours which flattens the load profile. At this point, the greedy (max) is most beneficial, but after the households switch to DC fast char-ging, the greedy (min) generates the most savings. Each event (integrating EVs and changing the charging mode) requires adjustments in the grid; if the methods were not re-selected after the events occurred, we would have a loss of 3.1% (event 1) respectively 0.7% (event 2) in savings. The overall savings for performing DR at all are much higher (up to 34.2%). Therefore, we generated additional savings of about €1.00 each day just by
Fig. 5Summarized consumption of all households, EV charging times, and TOUP borders
Table 4Scenario Description
# Description
Basic scenario details
Homes:(1) working couple, 3 children; (2) working woman, 2 children; (3) multigenerational family (working couple, 2 children, 2 seniors); (4) working woman under age 30; (5) working man under age 30; (6) working under age 30; (7) couple with 2 children, man at work.
Appliances:washing machine (1, 2, 3, 4, 5, 6, 7); dryer (1, 7); dishwasher (1, 2, 3, 7).
Cost function:We assume that we have a TOUP from the supplier.
Infrastructure:No generation or storage data were added.
Additional Information:No appliances may run between 24:00 and 07:00; an EV is added to each household and regarded as a deferrable load; the residents leave at 07:00 and return at 18:00, so the EV cannot be charged between these times.
Variation 1 No EV
Variation 2 (Event 1)
EV (Volkswagen e-Up) with 3.6 kW charging (AC)
Variation 3 (Event 2)
selecting the best method over the second best. Comparing the best to the worst methods, we save 1.6% in scenario 1, 14.2% in scenario 2, and 0.8% in scenario 3. While these savings may not sound significant, they are realized on top of the savings created by using the “wrong”DR method and just because we re-selected the method with our framework (see Appendix 5for more detailed results).
Conclusion
This study focusses on the Smart Home context, which has several challenges. To address these challenges, we gathered a set of REQs for a decision support framework for DR methods in the residential context, derived SOCs to fulfill the
REQs, and assembled them into a framework. To demonstrate the framework’s feasibility and applicability of this framework, we implemented a software proto-type and conducted simulations with different scenarios. The results indicate that our framework supports the identification of the best DR method for a user-specific scenario and thus allows a decision making. The developed frame-work thereby aims at increasing the efficiency of DR method usage in Smart Homes and thus allows to realize DR related objectives such as improving grid reliability, minimizing energy costs, and reducing peak loads. To do so, the deci-sion process is structured to enable a systematic and scenario-specific selection. To support this decision process, the framework contains valuable advice for (technical) implementation(s) on different HEMS, derived from literature and experts.
From a research perspective, our results can be used for supporting the manage-ment of complex energy structures in changing scenarios and for investigations of whether such a framework can increase user acceptance by encouraging more sus-tainable behavior and consumption. Moreover, researchers can compare DR methods in specific scenarios (e.g., to compare methods they develop to other methods). Making an evaluation with benchmarking datasets possible increases the comparability of methods.
For practice, the integration of the framework in a HEMS can support the management of increasing complexity in the Smart Home context and in urban infrastructures (e.g., Smart Cities). Consequently, new appliances and new infrastructure can be used more ef-ficiently; for example, a PV panel can be combined with energy storage when the best method can be selected more efficiently. Moreover, user acceptance may increase, as the user can see his or her advantages by performing DR as well as choosing the best per-forming DR method and that his or her preferences (welfare) are considered.
The demonstration case aims at showing the frameworks feasibility and applicability in answering the research question by identifying the best DR method for a specific situation. It thereby covers only a limited choice of all possible scenario specifications. Other microgrid consumptions, cost functions, and infrastructures would deliver other DR method results. However, the decision process remains the same and will also sup-port the selection of the best performing DR method.
Moreover, as intelligent energy management systems, especially HEMS, have not seen a wide implementation, a demonstration and evaluation with real-world data was not possible. Consequently, as the rarely available (real) data lacks in addition on informa-tion, we relied on artificial data and their corresponding limitations such as insufficient event integration, abrupt changes in user behavior, etc.
deadlines (e.g., production deadlines) would have to be taken into account in a more detailed way (e.g., because the supply chain needs more precise planning or because machines can switch among multiple modes (Behrens et al. 2017)). Moreover, pricing schemes might differ from the residential context, and flexibil-ity might alter, as machines react differently to changes compared to a private user.
Real data lack on additional information, for example usage times, deadline of single appliances, etc. Since recording the additional information required from the user is difficult, we plan to design and implement a tool that enables users to transfer user-specific data, such as behavior patterns and preferences. To increase user acceptance and penetration, consumers who have no knowledge in the field should also use the framework, supported by an assistant, guiding the user.
Our approach can be combined with the TAC, from (Ketter et al. 2011). Ket-ter et al. (KetKet-ter et al. 2016) called the entire field a “wicked problem.” As the TAC is a “system within a system,” the users in the TAC might change their strategy when they have such benchmarking as decision support. Therefore, the users react to external factors like price signals as well as events. A challenge, then, would be to implement agents not only on the supplier side but also on the consumer side to reach the best result for both sides or to deal with decision-making on the supplier side. Agents on the supplier side would then benefit from our framework and the improved decision making (selecting the best performing DR method).
DR objectives are manifold and differ on indicators and dimensions. The con-sideration of multiple indicators with various dimensions and no predefined weightings thereby can impede the decision process. One method that can be used in this case (multiple indicators, various dimensions, no predefined weights) is the Data-Envelopment Analysis (e.g., (Charnes et al. 1978; Vine et al. 1994; Suganthi and Samuel 2012)). So far, our framework can only consider a single ob-jective respectively indicator or multiple ones, if the user defines weights or there are equal weights for each objective. It seems possible to consider efficiency as well, so not only the quality of a method’s result can be considered but also the effort needed to achieve these results.
Appendix 1
Appendix 2
Fig. 7Defining the objectives (schematic drawing)
Fig. 9Analysis of the results (schematic drawing)
Appendix 3
All four methods use the same optimization model, with an objective function aiming at cost reduction, as this was selected by the user in our demonstration scenario. Both greedy based methods are classified as direct control. This means, the centralized HEMS is gathering the data from all seven households and shifting the loads afterwards by sending a controlling signal. However, the data is not leaving the HEMS and the utility company does not receive any user-specific data. MAS with communication means, that each household has an agent, which monitors and controls its own appli-ances. Each agent can be considered as a HEMS. Consolidation is then achieved by communicating the summarized load profiles to the other agents. As the agents are communicating with each other, this might result in less created peaks. Contrary to this approach, the MAS without communication do not communicate with the other agents. Therefore, artificial and new peaks might be derived, because all agents or HEMS shift their load to the same time.
Appendix 4
Based on (Behrens et al. 2017; Behrens et al.2014) we derived a mathematical model. LetNbe all considered living units andAnbe all the appliances of living unitn∈Nand ω be the sample rate of the discrete model (number of time periods) over one day. Moreover, let xh ¼P
n∈N
X
a∈An
hhn;awith h∈Z¼ f0;1;…;ωg be the sum of all appliances
a∈Anof all living unitn∈Nin the timesloth.
Let lkn;a be the load profile in a local time interval k∈Tl¼ f0;1; ::;δn;ag;ln;a¼
X
k∈Tl
lkn;a the load sum and δn, athe length of load a∈An. In doing so, we can transform a given horizontal and inseparable load profile from its local time intervalTlto the global oneT(C1) through shifting the wholeTlby an appropriate constantmn,a, i.e.,hk=k+
mn,awith 0≤mn,a≤ω− δn,a. Table 5Description of the chosen methods
Classification Method Procedure
Direct Control Max Greedy Start Take maximum/minimum load
02 Search the cheapest place for the load
03 Calculate consumption–generation
Direct Control Min Greedy 04 Find lowest result
05 Place the load at this place
End Take the next load and start again
Transactional Control MAS with comm. Start Select agent and hand over consumption plan
02 Agent places its loads (Max Knapsack)
03 Agent commits overall consumption plan
End Select next agent
Autonomous Control MAS without comm. All agents place their loads simultaneously
Furthermore, letγh;min
n;a be the min andγnh;;amaxbe the max borders for a loadxhn;a with h∈T,a∈Anso we can specify, in which borders the intensity of load acan be shifted, i.e.,γh;min
n;a ≤xhn;a≤γhn;;amax(C2). We note that the given load profiles have to satisfy the
in-equalityγhn;;amin≤lhkn;a≤γhn;;amaxfor allk∈Tlto get a feasible solution.
Letαn,abe the starting andβn,abe the ending time slot of a load for an appliancea, then we can restrict time interval T to [αn, a,βn, a] (C3). We note that the interval length between αn, aand βn,a has to be at least the length of the load profileδn, a. to get a feasible solution, i.e.,βn,a−αn,a≥δn,a.
To turn constraintion and off the for each appliancealetci
a∈f0;1gbe a binary
vari-able that shows if a constraint is turned on (ci
a¼1) or not (cia¼0).
The objective function describes the total cost of the given load profiles, while the cost in a time slot h is a function depending on h and the total load xh i.e., ch=c(h,xh)∗xh. Generally, c is a concave function with regard to the load xh, which means that the optimal load profile is smoothed. The resulting mathematical model that minimizes the energy costs and holds the constraints can be formulated as follows.
minc
xh n;a
¼Xw
h¼0
ch¼X
w
h¼0
c h ;xhxh ð1Þ
Xw
h¼0
xhn;a¼ln;a ∀n∈N;a∈An ð2Þ
xhk
n;a−lkn;a
c1a¼0 ∀k¼0;…;δn;a;∀n∈N;a∈An ðC1Þ
xhn;a−γh;n;amax
c2a≤0
γh;min n;a −xhn;a
c2a≤0
9 =
;∀n∈N;a∈An ðC2Þ
Xβn;a
h¼αn;a
xhn;a−ln;a
0 @
1
Ac3a¼0 ∀n∈N;a∈An ðC3Þ
Abbreviations
API:Application Programming Interface; DR: Demand Response; DSR: Design Science Research; EV: Electric Vehicle; HEMS: Home Energy Management Systems; kWh: Kilowatt hour; LPG: LoadProfileGenerator; MAS: Multi-Agent-System; PV: Photovoltaic; REQ: Requirement; SOC: Solution Concept; TAC: Trading-Agent-Competition; TOUP: Time-of-Use Pricing
Availability of data and materials
The data used is simulated by the LoadProfileGenerator from (Pflugradt2017).
Authors’contributions
DB conceived, designed and performed the experiments and implemented the prototype; DB and TS mainly wrote the paper and derived the framework. DB, TS and SB revised the manuscript. SB and RK contributed by overall suggestions through the research steps and contributing by co-authoring the motivation and outlook section. All au-thors read and approved the final manuscript.
Authors’information
Dennis Behrens—Dennis Behrens is research assistant and PhD student at the department of Enterprise Modeling and Information Systems at the University of Hildesheim, Germany. His research interests focus on sustainability, demand side management, and green business modelling. Especially Demand Response is in his focus.
Thorsten Schoormann—Thorsten Schoormann is research assistant and PhD student at the department of Enterprise Modeling and Information Systems at the University of Hildesheim, Germany. His research interests focus on business
Appendix 5
Table 6Results from the simulation
Method Criteria No EV 3.6 kW DC
No DSM Mean [kWh] 0.632 1.993 1.993
PAR 2.182 6.281 51.901
MSE [kWh2
] 34.243 731.601 4607.545
RMSE [kWh] 5.852 27.048 67.879
Costs 20.034 56.780 70.997
savings 0.000 0.000 0.000
Greedy Min Mean [kWh] 0.632 1.993 1.993
PAR 1.942 3.774 14.251
MSE [kWh2
] 26.718 291.121 1030.782
RMSE [kWh] 5.169 17.062 32.106
Costs 19.275 50.218 46.717
savings 0.038 0.116 0.342
Greedy Max Mean [kWh] 0.632 1.993 1.993
PAR 1.942 3.774 13.443
MSE [kWh2
] 26.302 370.660 969.994
RMSE [kWh] 5.129 19.253 31.145
Costs 19.275 48.449 47.616
savings 0.038 0.147 0.329
MAS without communication Mean [kWh] 0.632 1.993 1.993
PAR 1.942 4.511 19.300
MSE [kWh2
] 24.542 361.142 1206.356
RMSE [kWh] 4.954 19.004 34.733
Costs 19.446 56.473 46.888
savings 0.029 0.005 0.340
MAS with communication Mean [kWh] 0.632 1.993 1.993
PAR 1.942 3.725 11.876
MSE [kWh2
] 25.154 308.974 884.948
RMSE [kWh] 5.015 17.578 29.748
Costs 19.716 48.693 47.158
modelling approaches as well as business process modelling languages and supporting tools (e.g., business model development tools) that contribute to the creation, representation, and assessment of sustainability in such models. Especially carsharing (e.g., with electric vehicles) is in the focus of his research.
Sebastian Bräuer—Sebastian Bräuer works as a postdoctoral research assistant at the department of Enterprise Modeling and Information Systems at the University of Hildesheim, Germany. His main research interests comprise innovative services, especially in the context of electric vehicles, including aspects of service engineering, value networks, and product-service systems. Previous to his work at the institute, he received his doctoral degree at the University of Münster, Germany and worked at the European Center for Information Systems (ERCIS).
Ralf Knackstedt—Ralf Knackstedt is Full Professor of the Institute for Economics and Information Systems, department for Enterprise Modelling and Information Systems at the University of Hildesheim, Germany. His research areas include reference modelling, product-service systems, conceptual modelling, and business process management. Before his work at the institute, he received his doctoral degree and his habilitation at the University of Münster, Germany and worked at the European Center for Information Systems (ERCIS). His work has been published in leading academic journals and conferences such as Business Information Systems Engineering, IEEE Transactions on Engineering Manage-ment, Communications of the AIS, Scandinavian Journal of Information Systems and Enterprise Modelling, and Infor-mation Systems Architectures.
Ethics approval and consent to participate
Not applicable.
Consent for publication
Not applicable.
Competing interests
The authors declare that they have no competing interests.
Publisher’s Note
Springer Nature remains neutral with regard to jurisdictional claims in published maps and institutional affiliations.
Received: 15 May 2018 Accepted: 17 September 2018
References
Abdollahi A, Moghaddam MP, Rashidinejad M, Sheikh-El-Eslami MK (2012) Investigation of Economic and Environmental-Driven Demand Response Measures Incorporating UC. IEEE Trans Smart Grid 3:12–25.https://doi.org/10.1109/TSG.2011. 2172996
Abdulla K, Steer K, Wirth A et al (2017) The importance of temporal resolution in evaluating residential energy storage. Proceedings of the IEEE Power and Energy Society General Meeting
Aghaei J, Alizadeh M-I (2013) Multi-objective self-scheduling of CHP (combined heat and power)-based microgrids considering demand response programs and ESSs (energy storage systems). Energy 55:1044–1054.https://doi.org/10. 1016/j.energy.2013.04.048
Alam MR, St-Hilaire M, Kunz T (2013) Cost optimization via rescheduling in smart grids: A linear programming approach. 2013 IEEE International Conference on Smart Energy Grid Engineering (SEGE), pp 1–6
Albadi MH, El-Saadany EF (2008) A summary of demand response in electricity markets. Electr Power Syst Res 78:1989–1996.
https://doi.org/10.1016/j.epsr.2008.04.002
Ali SQ, Maqbool SD, Ahamed TPI, Malik NH (2012) Pursuit Algorithm for optimized load scheduling. 2012 IEEE International Power Engineering and Optimization Conference Melaka, Malaysia, pp 193–198
Al-Sumaiti AS, Ahmed MH, Salama MMA (2014) Smart Home Activities: A Literature Review. Electr Power Compon Syst 42: 294–305.https://doi.org/10.1080/15325008.2013.832439
American Productivity and Quality Center (1993) Benchmarking Management Guide, Subsequent. Productivity Press, Cambridge
Andersen B, Pettersen P-G (1995) Benchmarking Handbook, 1995 edition. Springer
Atabay D, Herzog S, Sänger F et al (2013) Self-adapting building models and optimized HVAC scheduling for demand side management. 22nd International Conference and Exhibition on Electricity Distribution (CIRED2013), pp 1–4 Balijepalli VSKM, Pradhan V, Khaparde SA, Shereef RM (2011) Review of demand response under smart grid paradigm.
Innovative Smart Grid Technologies (ISGT) - India, pp 236–243
Barbato A, Capone A (2014) Optimization models and methods for demand-side management of residential users: a survey. Energies 7:5787–5824.https://doi.org/10.3390/en7095787
Barta N, Kelly J, Parson O et al (2014) NILMTK: An open source toolkit for non-intrusive load monitoring. 5th International Converence on Future Energy Systems, pp 265–276
Bashash S, Fathy HK (2013) Optimizing demand response of plug-in hybrid electric vehicles using quadratic programming. 2013 American Control Conference, pp 716–721
Basmadjian R, Botero JF, Giuliani G et al (2016) Making data centres fit for demand response: introducing GreenSDA and GreenSLA contracts. IEEE Trans Smart Grid
Bassamzadeh N, Ghanem R, Kazemitabar SJ (2014) Robust scheduling of smart appliances with uncertain electricity prices in a heterogeneous population. Entergy Build 84:537–547
Beaude O, Lasaulce S, Hennebel M (2012) Charging games in networks of electrical vehicles. Network Games, Control and Optimization (NetGCooP). IEEE, pp 96–103
Behrens D, Schoormann T, Knackstedt R (2016) D Datensets für Demand-Side-Management–Literatur-Review-Basierte Analyse und Forschungsagenda. In Mayr, HC and Pinzger, M (Eds.): Lecture notes in informatics (LNI) (INFORMATIK 2016), Gesellschaft für Informatik e.V., pp. 1301–1315
Behrens D, Schoormann T, Knackstedt R (2017) Towards a taxonomy of constraints in demand-side-management-methods for a residential context. Proceedings of the 20th International Conference on Business Information Systems (BIS), Poznan, Poland. Lecture Notes in Business Information Processing (LNBIP). Springer, p 283
Berthold A, Diekerhof M, Gross S et al (2017) Requirements for flexible districts to provide smart grid demand side services. PowerTech, 2017 IEEE Manchester. IEEE, pp 1–6
Blank M, Gandor M, Nieße A et al (2015) Regionally-specific scenarios for smart grid simulations. Power Engineering, Energy and Electrical Drives (POWERENG), 2015 IEEE 5th International Conference on. IEEE, pp 250–256
Bui V-H, Hussain A, Kim H-M (2017) Optimal operation of microgrids considering auto-configuration function using multiagent system. Energies 10:1484.https://doi.org/10.3390/en10101484
Camp RC (2006) Benchmarking: the search for industry best practices that lead to superior performance. Productivity Press, University Park, Il
Cao HÂ, Beckel C, Staake T (2013) Are domestic load profiles stable over time? An attempt to identify target households for demand side management campaigns. IECON 2013 - 39th Annual Conference of the IEEE Industrial Electronics Society, pp 4733–4738
Charnes A, Cooper WW, Rhodes E (1978) Measuring the efficiency of decision making units. Eur J Oper Res 2:429–444.
https://doi.org/10.1016/0377-2217(78)90138-8
Chaudhari RB, Dhande DP, Chaudhari AP (2014) Home energy management system. Int J Adv Electron Commun Syst 3: 1417–1425.
Conejo AJ, Morales JM, Baringo L (2010) Real-time demand response model. IEEE Trans Smart Grid 1:236–242.https://doi.org/ 10.1109/TSG.2010.2078843
Cooper WW, Seiford LM, Tone K (2006) Data Envelopment Analysis: A Comprehensive Text with Models, Applications, References and DEA-Solver Software: A Comprehensive Text with Models, 2nd ed. 2007. Springer, New York
Cupelli LJ, Schutz T, Jahangiri P et al (2018) Data center control strategy for participation in demand response programs. IEEE Trans Ind Inform
de Boer L, Labro E, Morlacchi P (2001) A review of methods supporting supplier selection. Eur J Purch Supply Manag 7:75–89.
https://doi.org/10.1016/S0969-7012(00)00028-9
Deming WE (1982) Quality, productivity, and competitive position. Massachusetts Institute of Technology, Center for Advanced Engineering Study, Cambridge
Dyson ME, Borgeson SD, Tabone MD, Callaway DS (2014) Using smart meter data to estimate demand response potential, with application to solar energy integration. Energy Policy 73:607–619
Fathi M, Gholami M (2012) Localized demand-side management in electric power systems. Iranian Conference on Smart Grids, pp 1–4 Fulli G, Masera M, Covrig CF et al (2017) The EU electricity security decision-analytic framework: status and perspective
developments. Energies 10:425
Gellings CW (1985) The concept of demand-side management for electric utilities. Proceedings of the IEEE, pp 1468–1470 Gellings CW, Chamberlin JH (1987) Demand-side management: concepts and methods, 2nd ed. Prentice Hall, Lilburn Gerwig C, Behrens D, Lessing H, Knackstedt R (2015) Demand side management in residential contexts - a literature review.
In: Lecture Notes in Informatics, pp 93–107
Gkatzikis L, Koutsopoulos I, Salonidis T (2013) The role of aggregators in smart grid demand response markets. IEEE J Sel Areas Commun 31:1247–1257.https://doi.org/10.1109/JSAC.2013.130708
Goebel C, Jacobsen H-A, del Razo V et al (2014) Energy Informatics - Current and Future Research Directions. Bus Inf Syst Eng 6:25–31 Gyamfi S, Krumdieck SP, Brackney L (2010) Pattern recognition residential demand response: an option for critical
peak demand reduction in New Zealand. Univ Canterb Res Repos
Han J, Choi C, Park W et al (2014) Smart home energy management system including renewable energy based on ZigBee and PLC. IEEE Trans Consum Electron 60:198–202.https://doi.org/10.1109/TCE.2014.6851994
Heib R, Daneva M, Scheer A-W (1997) Benchmarking as a controlling tool in information management. In: Modelling techniques for business process re-engineering and benchmarking. Springer, Boston, pp 298–309
Ho W, Xu X, Dey PK (2010) Multi-criteria decision making approaches for supplier evaluation and selection: a literature review. Eur J Oper Res 202:16–24.https://doi.org/10.1016/j.ejor.2009.05.009
Hoogsteen G, Molderink A, Hurink JL, Smit GJM (2016) Generation of flexible domestic load profiles to evaluate Demand Side Management approaches. 2016 IEEE International Energy Conference (ENERGYCON), pp 1–6
Hu Q, Li F (2013) Hardware Design of Smart Home Energy Management System With Dynamic Price Response. IEEE Trans Smart Grid 4:1878–1887.https://doi.org/10.1109/TSG.2013.2258181
Javed F, Arshad N, Wallin F et al (2012) Forecasting for demand response in smart grids: An analysis on use of anthropologic and structural data and short term multiple loads forecasting. Appl Energy 96:150–160.https://doi.org/10.1016/j.apenergy.2012.02.027
Jiang B, Fei Y (2015) Smart Home in Smart Microgrid: A Cost-Effective Energy Ecosystem With Intelligent Hierarchical Agents. IEEE Trans Smart Grid 6:3–13.https://doi.org/10.1109/TSG.2014.2347043
Johnson RE, Foote B (1988) Designing Reusable Classes. J Object-Oriented Program 1:22–35
Jovanovic R, Bousselham A, Bayram IS (2016) Residential Demand Response Scheduling with Consideration of Consumer Preferences. Appl Sci 6:16.https://doi.org/10.3390/app6010016
Keerthisinghe C, VerbičG, Chapman AC (2014) Evaluation of a multi-stage stochastic optimisation framework for energy management of residential PV-storage systems. 2014 Australasian Universities Power Engineering Conference (AUPEC), pp 1–6
Ketter W, Collins J, Reddy PP, Flath CM (2011) The Power Trading Agent Competition. Social Science Research Network, Rochester Ketter W, Peters M, Collins J, Gupta A (2016) Competitive Benchmarking: An IS Research Approach to Address Wicked
Problems with Big Data and Analytics. Manag Inf Syst Q 40:1057–1080
Khadar A, Khan JA, Nagaraj MS (2017) Research Advancements Towards in Existing Smart Metering over Smart Grid. Int J Adv Comput Sci Appl IJACSA 8:84–92.https://doi.org/10.14569/IJACSA.2017.080511