O R I G I N A L A R T I C L E
Open Access
Effects of increased elderly employment on
other workers
’
employment and elderly
’
s
earnings in Japan
Ayako Kondo
Correspondence:akondo@ynu.ac.jp Yokohama National University, Yokohama, Japan
Abstract
This paper examines the effect of increased elderly employment in Japan, caused by the legal obligation of continued employment enacted in 2006, on employment of other workers and elderly’s own earnings. I find no evidence for substitution between young full-time workers and elderly workers, while there might be a modest crowd out of middle-aged female part-time workers. I also find a substantial decline in earnings of baby boomers, who reached age 60 after 2006, in their early sixties. These results suggest that firms primarily cut wages of elderly workers, and some firms reduced the number of female part-time workers.
JEL code:J26
Keywords:Elderly employment, Youth employment
1 Introduction
Aging population is emerging as a serious social concern in many developed countries. Among others, Japan has experienced increased rapid aging in the past few decades. Given this fast-aging population and resulting pressure on the social security system, the govern-ment of Japan has been trying to ensure that older people can continue to work longer. At the same time, there is a concern that the excessive protection of elderly employment may deprive the youth of employment opportunities. In theory, however, it is not necessary for employers to reduce the number of younger workers if the wages of older workers fall suf-ficiently to absorb the increased labor supply. Thus, this paper examines whether the in-crease in the number of elderly workers affected the employment of other age groups and whether there were any adjustments through elderly workers’wages.
Specifically, I focus on the changes around the revision of the Elderly Employment Stabilization Law (hereafter EESL) in 2006, which mandated employers to continue employment of their incumbents up to the pension eligibility age. Kondo and Shigeoka (2015) show that this policy intervention indeed increased employment rate among men in their early sixties, and the effect is mainly observed in employees in large firms. In the first half of the empirical analysis, I try to shed light on how the mandated con-tinued employment due to the EESL revision affects the employment volume of workers in various age ranges and their part-time/full-time status. The idea is that if an establishment has more workers in their late fifties right before the EESL revision, it
would have had more workers reaching age 60 after the EESL revision, to whom it had to offer continued employment. In the second half of the empirical analysis, I explore whether there was any adjustment in wages of elderly workers. Specifically, I examine whether the decline in earnings at age 60 became wider for cohorts eligible for man-dated continued employment as per the EESL.
Existing studies show mixed evidence about the substitutability between elderly workers and younger workers. On the one hand, Gruber et al. (2010) argue that there is no evi-dence of a trade-off between elderly employment and youth employment; rather, there is a positive association between them based on their study of 12 OECD countries. Munnel and Wu (2012) and Zhang (2012), who study data pertaining to the USA and China, re-spectively, also claim that there is no substitution between young and old workers. Earlier studies for Japan (Oshio and Sato 2010; Nagano, 2014) also show no evidence of a trade-off between young and old workers. On the other hand, Vestad (2013) shows almost one-to-one replacement of retired elderly and newly hired young workers in Norway, and Martins et al. (2009) show substitution between old and young female workers in Portugal.
Consistent with the first line of the literature, I find that increased elderly employ-ment is not associated with a decline in hiring of young full-time workers. However, I also find suggestive evidence that reemployed elderly workers may crowd out middle-aged part-time female workers. Furthermore, the analysis of earnings shows a signifi-cant fall in the earnings of male baby boomers (who reached age 60 after the EESL revi-sion) in their early sixties. These results suggest that in response to the mandated continued employment by the EESL, firms primarily cut wages of elderly workers, and some firms reduced the number of female part-time workers. However, most firms did not decrease hiring of young workers.
The rest of the paper is organized as follows. Section 2 details the institutional back-ground. Section 3 analyzes the employment of other workers using data from the Em-ployment Trend Survey, and Section 4 analyzes earnings changes using data from the Basic Survey on Wage Structure. Section 5 further investigate the relationship between adjustment through hiring and earnings changes. Section 6 concludes.
2 Institutional background
2.1 Pension Reform Act and the EESL revision
Japan’s population is aging rapidly. As of 2010, the population ratio of elderly people (65 years or older) was 23.1 % (Population Census of Japan, 2010), which is the highest among the OECD countries. This rapid aging puts an enormous fiscal pressure on the social security system. To mitigate this fiscal pressure and slow down the contraction of the labor force, the government of Japan implemented two major reforms: the Pen-sion Reform Act in 2001 and the reviPen-sion of the EESL in 2006. Both reforms are intended to promote employment of people in their early sixties.
However, because of the Pension Reform Act, those who turned 60 in April 2001 or later could no longer start receiving the full pension benefit at the age of 60.
This growing gap between the pension eligibility age and mandatory retirement age, which was still 60 in most firms, emerged as a serious social concern. To fill this gap, 5 years after the implementation of the Pension Reform Act, the government of Japan revised the EESL in order to legally mandate employers to offer continuous employment until the pen-sion eligibility age. Beginning with those who turned 60 in April 2006 (i.e., those born in April 1946), employers have to take at least one of the following three measures: (1) raise the mandatory retirement age to the pension eligibility age, (2) abolish mandatory retire-ment, or (3) set up a formal rule for employment extension or reemployment.
In reality, more than 80 % of the firms chose the third option.1 Reemployment after mandatory “retirement” is quite common in Japan. Employees in Japan typically retire from regular employment (seishain) either in the month in which they turn 60 or at the end of the fiscal year during which they turn 60. Mandatory“retirement”in Japan merely means a termination of a so-called“lifetime employment”contract. After this mandatory retirement, some workers leave the labor force or begin working for a new employer, but a substantial number of the“retired”employees are reemployed by the same employer on a different employment contract, namely as non-regular workers, who are typically paid much lower wages. The EESL revision legally mandated firms to offer such reemployment opportunities to all employees below the pension eligibility age.
Kondo and Shigeoka (2015) show that this revision actually increased the ratio of sal-aried workers among men in their early sixties, and the effect is mainly observed in em-ployees of large companies. Specifically, they find that the introduction of the mandated continued employment increased the population ratio of salaried workers at ages 60, 61, and 62 for the cohort born in 1946 by about 1–3 percentage points. They also find that this increase is mostly attributable to the increase in the number of em-ployees at firms with 500 or more emem-ployees.
As the pension eligibility age kept rising until 65, the mandatory age until when firms have to offer continued employment was also gradually raised to 64 for the cohort born in 1947 and later and to 65 for the cohort born in 1949 and later. Kondo and Shigeoka (2015) also find that the 1-year rise in the pension eligibility age combined with the mandated continued employment increased the ratio of salaried workers at age 63 by about 4 percentage points for the cohort born in 1947.
It is important to note that even before the EESL revision, no legal regulation pre-vented firms from hiring workers older than the mandatory retirement age of 60. Hence, the increase in employment of the elderly after the EESL revision can be viewed as a distortion caused by a government intervention. If the EESL forces employers to hire workers whom they would not hire otherwise, there must be some adjustment in response to this forced employment, either through changes in employment of workers in other age ranges or through changes in wages of elderly workers themselves. Hence, I examine the former in Section 3 and the latter in Section 4.
2.2 Aging of baby boomers and the“year 2007 problem”
The cohort size of those born in 1947 is over 2.6 million, whereas that of those born in 1943 is 2.3 million.3Cohorts born in 1948 and 1949 also exceed 2.6 million, and then, the cohort size shrinks to 2.3 million, the pre-World War II level, for the cohort born in 1950.
Consequently, in 2007, Japanese firms faced a sharp increase in the number of em-ployees who reached 60, the mandatory retirement age. According to the Population Census 2010, the population size of those who reached 60 during November 2006 to October 20074is about 2.15 million, whereas the population size of the cohort that is 1 year older is only about 1.34 million. This sharp increase in the number of employees reaching the mandatory retirement age is called the “year 2007 problem (2007-nen mondai)”and has been widely publicized in the Japanese media.
This “year 2007 problem” could have affected employers’ behaviors through the fol-lowing two channels. First, the actual number of employees to whom employers have to offer continued employment increased, and wages and employment of other workers may have been adjusted accordingly. Second, in addition to the actual increase in the number of elderly workers, the publicized image about the year 2007 problem may have triggered drastic changes in the wage structure and employment scheme. As pointed out by Hamaaki et al. (2012), population aging and prolonged economic stagnation brought pressure to flatten the wage–age profile of Japanese firms, which used to be much steeper than those of other developed countries. At the same time, as shown by Kawaguchi and Ohtake (2007) and Ariga and Kambayashi (2010), wage cuts harm workers’productivity, causing many firms to hesitate before cutting wages. Under these circumstances, the year 2007 problem might have provided the firms a good excuse to reform wage profiles.
3 Effects on employment for different ages and type of contract
3.1 Data: establishment panel constructed from the Employment Trend Survey
The main source of data used in this section is the Employment Trend Survey (here-after ETS) conducted by the Ministry of Health, Labour and Welfare. I construct a panel of establishments from the ETS, although, as explained below, the year-on-year matching of the establishments is not perfect. Another limitation is that the ETS re-cords the number of employees using a 5-year—and not a 1-year—age range, and thus, detailed cohort-level analyses are not feasible.
Unfortunately, the ETS does not retain a unique establishment identifier over the entire period, because it is not designed as panel data. However, the sampling weights of the ETS vary with the establishment size, and it is a complete survey for establishments with more than 500 employees. Thus, although the survey is designed as a repeated cross sec-tion, it is possible to construct a panel of establishments with more than 500 employees so long as the same establishment can be identified across samples of different years.
The respondents of the ETS are sampled from the list of establishments listed in the Establishment and Enterprise Census (hereafter EEC), which is a complete survey of es-tablishments conducted every few years by the Statistics Bureau. The respondents to the ETS are resampled when a new list of establishments based on the new EEC be-comes available, and the establishment’s identifier (ID) within the ETS is renewed. Thus, the establishment’s ID within the ETS can be linked for only a few years between consecutive EECs.
For the years 2004–2011, however, the establishment IDs in the EECs are also avail-able. Specifically, ETS 2004–2006, ETS 2007–2008, and ETS 2009–2011 can be linked to EEC 2001, EEC 2004, and EEC 2006, respectively. Since a particular EEC uses the es-tablishment IDs of the previous EEC, I can link ETS 2004–2011 using the establish-ment IDs available from the relevant EEC.
Although ETS 2002 and 2003 are also sampled from EEC 1999, the establishment IDs for this EEC are not available to me. Thus, I use prefectures, number of employees, and two-digit industries to match the establishments in ETS 2004 and ETS 2003. This matching is not perfect; only about 60 % of the establishments in the 2003 survey can be matched with those in the 2004 survey. To link ETS 2002 with later years, I use the establishment IDs common to ETS 2003 and 2002.
I use the ratio of male full-time employees aged 55–59 as of the end of June 2003 as a proxy for the impact of the EESL revision in 2006 for each establishment. I choose 2003 as the base year because 2003 is the last year before the EESL revision was passed and announced in June 2004. I focus on male full-time workers, because in practice, re-employment after mandatory retirement, which is decreed by the EESL, typically covers employees who were on full-time regular employment until the mandatory retirement age. Most women in the relevant cohort do not qualify for this condition.
younger than 25 is intended to measure the degree of substitution or complementarity between young and old workers, and analyzing the number of female part-time em-ployees will help capture substitution or complementarity between elderly men on re-employment contracts and married women on non-regular contracts.
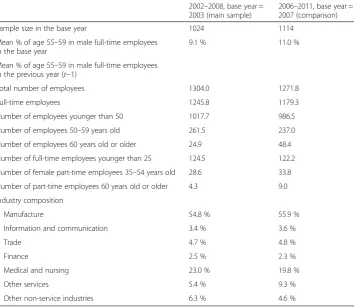
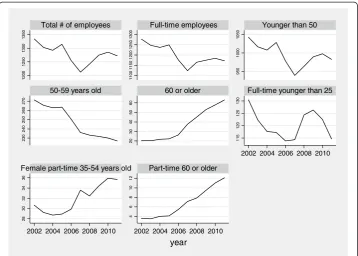
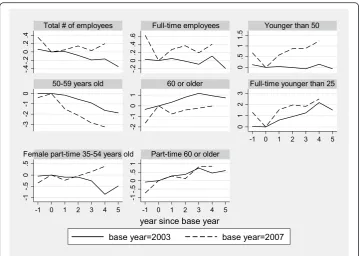
Table 1 presents the sample size and industry composition. The first column shows the sample used in the main analysis. I limit the sample to establishments that can be tracked at least from 2003 to 2008. Also, for comparison, I repeat the same analysis, setting 2007 instead of 2003 as the base year. Column (2) shows the sample for this analysis, which in-cludes establishments that can be tracked from 2006 to 2011. The industry compositions5 of the two samples are very similar.6Figure 1 shows the mean of outcome variables over years. Here, I pool the samples in two columns of Table 1 (many of them overlap).
3.2 Empirical model
As the main specification, I estimate the following equation:
Yijt¼αþ X
τ≠2003
βτXij20031ðt¼τÞ þvjtþuiþεijt ð1Þ
where Yijtis the outcome variable of establishment i in industry j observed in yeart,
Xij2003 is the ratio of male full-time employees aged 55–59 among all male full-time employees in 2003, andβτ, the coefficient ofXij, varies with the year and is normalized
to 0 in 2003, the base year.vjtrepresents the industry-year effect, anduirepresents the
Table 1Summary statistics of the Employment Trade Survey
2002–2008, base year = 2003 (main sample)
2006–2011, base year = 2007 (comparison)
Sample size in the base year 1024 1114
Mean % of age 55–59 in male full-time employees in the base year
9.1 % 11.0 %
Mean % of age 55–59 in male full-time employees in the previous year (t−1)
Total number of employees 1304.0 1271.8
Full-time employees 1245.8 1179.3
Number of employees younger than 50 1017.7 986.5
Number of employees 50–59 years old 261.5 237.0
Number of employees 60 years old or older 24.9 48.4
Number of full-time employees younger than 25 124.5 122.2
Number of female part-time employees 35–54 years old 28.6 33.8
Number of part-time employees 60 years old or older 4.3 9.0
Industry composition
Manufacture 54.8 % 55.9 %
Information and communication 3.4 % 3.6 %
Trade 4.7 % 4.8 %
Finance 2.5 % 2.3 %
Medical and nursing 23.0 % 19.8 %
Other services 5.4 % 9.3 %
Other non-service industries 6.3 % 4.6 %
establishment fixed effect. εijt is the remaining error, which may be correlated within the establishment over time. To consider this potential correlation forεijt, standard er-rors are clustered at the establishment level.7
βτrepresents changes in the outcome variables for establishments that, relative to other establishments, had more employees reaching age 60 under the legal obliga-tion of continued employment until the pension eligibility age. It is intended to capture employers’ responses to the EESL revision. If a plot of βτ over τ shows some trend breaks around 2006, such a change in trend is likely to be attributable to the revision of the EESL implemented in 2006. On the other hand, if the plot of βτ shows some secular trend, it may simply reflect a dynamic pattern of em-ployee age composition not related to the EESL. If so, changing the base year should not change such secular trends. To check this, I also estimate the same equation replacing the base year with 2007, 1 year after the implementation of the revised EESL.
The reason I do not use the ratio of workers currently over 60 is that even under the revised EESL, a substantial number of workers retire at the age of 60. This is particularly a concern for large firms; Kondo (2014) show that 30 % of those who were employed at firms with more than 1000 employees retire at age 60 even after the EESL revision in 2006. How many employees retire at age 60 would be presumably correlated with the firm’s adjustment in other workers’ employment and the wage offers made to employees over 60. For example, firms that do not want to reduce the number of young workers may want to induce more employees to voluntarily “retire” at age 60, generating a spurious negative correlation between elderly and youth employment.
1200
1250
1300
1350
1100
1150
1200
1250
1300
950
1000
1050
230
240
250
260
270
20
30
40
50
60
115
120
125
130
28
30
32
34
36
4
6
8
10
12
2002 2004 2006 2008 2010
2002 2004 2006 2008 2010 2002 2004 2006 2008 2010
Total # of employees Full-time employees Younger than 50
50-59 years old 60 or older Full-time younger than 25
Female part-time 35-54 years old Part-time 60 or older
year
It would be also informative to estimate the effect of previous years’ employment shares of workers in their late fifties on the same set of outcomes. For this purpose, I estimate the following equation:
Yijt¼αþβtXijt−1þvjtþuiþεijt ð2Þ
Xijt−1 is the ratio of male full-time employees aged 55–59 among all male full-time employees in the previous year, and the other variables are the same as in equation (2).
Furthermore, for the following outcome variables, it is possible to calculate the “ pre-dicted” number of workers in yeart from the data in yeart−5: employees aged 30–49 (instead of younger than 50), employees aged 50–59, employees aged 60 or older, fe-male part-time employees aged 35–55, and part-time employees aged 60 or older.8For example, the predicted number of employees aged 30–49 in 2008 is calculated as the number of employees aged 25–44 in 2003. For these outcome variables, I define the ra-tio of the actual number in 2008 to the predicted number calculated from the 2003 sur-vey and estimate the following equation:
Yij2008=⌢Yij2008¼αþβXij2003þvjþεijt ð3Þ
The estimated βimplies the effect of the ratio of workers who are subject to contin-ued employment mandated by the revised EESL on deviation of the employment from the predicted path.
3.3 Results
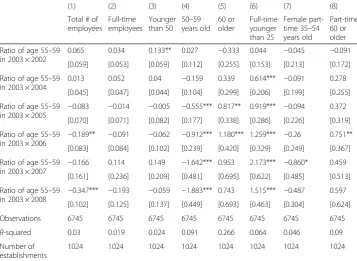
Table 2 shows estimates ofβτin equation (1), the coefficients of the interaction term of the ratio of male full-time workers aged 55–59 in 2003 to year dummies. Column (1) shows that establishments that had relatively more male full-time employees in their late fifties before the EESL revision reduced their relative employment size. The size of the ef-fect is, however, modest: a 1 % point increase in the share of male full-time workers aged 55–59 in 2003 reduces the total employment by at most 0.4 % in 2008. Furthermore, col-umns (2) and (3) show insignificant effects on full-time employees and those younger than 50. As expected, columns (4) and (5) show that the number of employees in their fifties decreases and that in their sixties increases. This is a mechanical change, since those who were in their late fifties in 2003 enter their early sixties by 2008.
Interestingly, the ratio of male full-time workers aged 55–59 in 2003 has a signifi-cantly positive effect on the number of full-time employees younger than 25. This im-plies that even under the mandated continued employment under the EESL, employers hire young workers as more incumbent workers reach 60. In other words, hiring of new graduates increases as the number of workers who reach the mandatory retirement age increases, even if firms have to offer reemployment opportunities after the mandatory retirement. This result suggests that reemployed elderly workers do not per-fectly substitute young full-time workers.
Table 2The effect of the ratio of 55–59 years old in male full-time workers in 2003 on log number of various types of employees
(1) (2) (3) (4) (5) (6) (7) (8)
Total # of employees
Full-time employees
Younger than 50
50–59 years old 60 or older Full-time younger than 25 Female part-time 35–54 years old
Part-time 60 or older
Ratio of age 55–59 in 2003 × 2002
0.065 0.034 0.133** 0.027 −0.333 0.044 −0.045 −0.091
[0.059] [0.053] [0.059] [0.112] [0.255] [0.153] [0.213] [0.172]
Ratio of age 55–59 in 2003 × 2004
0.013 0.052 0.04 −0.159 0.339 0.614*** −0.091 0.278
[0.045] [0.047] [0.044] [0.104] [0.299] [0.206] [0.199] [0.255]
Ratio of age 55–59 in 2003 × 2005 −
0.083 −0.014 −0.005 −0.555*** 0.817** 0.919*** −0.094 0.372
[0.070] [0.071] [0.082] [0.177] [0.338] [0.286] [0.226] [0.319]
Ratio of age 55–59 in 2003 × 2006 −
0.189** −0.091 −0.062 −0.912*** 1.180*** 1.259*** −0.26 0.751**
[0.083] [0.084] [0.102] [0.239] [0.420] [0.329] [0.249] [0.367]
Ratio of age 55–59 in 2003 × 2007 −
0.166 0.114 0.149 −1.642*** 0.953 2.173*** −0.860* 0.459
[0.161] [0.236] [0.209] [0.481] [0.695] [0.622] [0.485] [0.513]
Ratio of age 55–59 in 2003 × 2008 −
0.347*** −0.193 −0.059 −1.883*** 0.743 1.515*** −0.487 0.597
[0.102] [0.125] [0.137] [0.449] [0.693] [0.463] [0.304] [0.624]
Observations 6745 6745 6745 6745 6745 6745 6745 6745
R-squared 0.03 0.019 0.024 0.091 0.266 0.064 0.046 0.09
Number of establishments
1024 1024 1024 1024 1024 1024 1024 1024
Note: Standard errors with clustering for establishment ID are presented in brackets. *, **, *** indicate coefficients are statistically significantly different from 0 at the 10, 5, and 1 % levels, respectively. Control variables omitted from the table include industry-year dummies. Establishment fixed effects are also controlled
Table 3The effect of the ratio of 55–59 years old in male full-time workers in 2003 on employment share of various types of employees
(1) (2) (3) (4) (5) (6) (7)
Full-time employees
Younger than 50
50–59 years old 60 or older Full-time younger than 25 Female part-time 35–54 years old
Part-time 60 or older
Ratio of age 55–59 in 2003 × 2002
0.000 0.026 −0.019 −0.007 −0.030*** −0.020 0.004
[0.010] [0.018] [0.014] [0.012] [0.008] [0.016] [0.006]
Ratio of age 55–59 in
2003 × 2004 −
0.002 0.020** −0.025* 0.005 0.043*** −0.005 −0.001
[0.006] [0.010] [0.014] [0.008] [0.011] [0.008] [0.005]
Ratio of age 55–59 in 2003 × 2005
0.007 0.056* −0.081*** 0.025** 0.082*** −0.022*** 0.002
[0.014] [0.029] [0.031] [0.011] [0.017] [0.008] [0.009]
Ratio of age 55–59 in 2003 × 2006
0.010 0.094** −0.129*** 0.035*** 0.105*** −0.028* 0.001
[0.019] [0.041] [0.045] [0.013] [0.022] [0.017] [0.009]
Ratio of age 55–59 in 2003 × 2007
0.114* 0.211** −0.256*** 0.045* 0.148*** −0.106* −0.002
[0.067] [0.090] [0.093] [0.027] [0.034] [0.064] [0.011]
Ratio of age 55–59 in 2003 × 2008
0.005 0.196*** −0.302*** 0.106*** 0.138*** −0.044 0.002
[0.025] [0.073] [0.098] [0.033] [0.030] [0.029] [0.012]
Observations 6745 6745 6745 6745 6745 6745 6745
R-squared 0.032 0.071 0.113 0.148 0.112 0.035 0.045
Number of establishments 1024 1024 1024 1024 1024 1024 1024
Table 3 confirms the same pattern when the outcome variables are employment share rather than the log of number of employees.
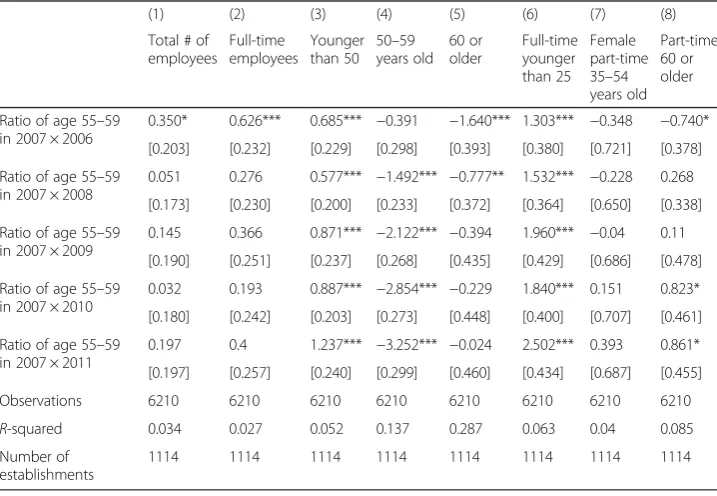
Tables 4 and 5 show the estimated effect of the ratio of employees aged 55–59 in 2007 instead of 2003, and Fig. 2 compares the estimated βτs in Tables 2 and 4. For some reason, the numbers of total employees, full-time employees, and employees younger than 50 are smaller in the base year (2007) than those in the other years; thus, most of the coefficients are positive, and many of them are statistically significant. This should be interpreted as an anomaly for 2007. For the numbers of employees in their fifties and sixties and the number of full-time employees younger than 25, a pattern similar to Table 2 is observed. In contrast, the number of female part-time workers does not decrease when the base year is set to 2007. This may imply that the substitu-tion between female part-time workers and reemployed elderly workers was caused by the revised EESL, and once the adjustment was complete, the number of female part-time workers stopped decreasing.
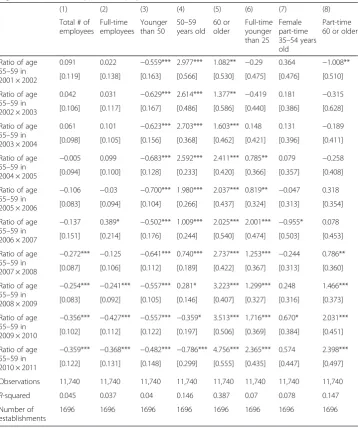
Tables 6 and 7 show the estimated effect of the ratio of employees aged 55–59 in the previous year, as in equation (2). Columns (1) and (2) of Table 6 show that the ratio of employees aged 55–59 started to have a negative effect on total em-ployment after the revised EESL was implemented in 2006. Columns (3) to (5) show that this decline results from the number of employees younger than 50. Note that, however, this result may simply imply that establishments with a higher ratio of older workers tend to have fewer young workers and that more workers are retiring from such establishments. Indeed, column (6) shows a positive effect on the number of full-time workers younger than 25 after the EESL revision. This may mean that these establishments are trying to hire young workers to fill the
Table 4The effect of the ratio of 55–59 years old in male full-time workers in 2007 on log number of various types of employees
(1) (2) (3) (4) (5) (6) (7) (8)
Total # of employees
Full-time employees
Younger than 50
50–59 years old
60 or older
Full-time younger than 25
Female part-time 35–54 years old
Part-time 60 or older
Ratio of age 55–59 in 2007 × 2006
0.350* 0.626*** 0.685*** −0.391 −1.640*** 1.303*** −0.348 −0.740*
[0.203] [0.232] [0.229] [0.298] [0.393] [0.380] [0.721] [0.378]
Ratio of age 55–59 in 2007 × 2008
0.051 0.276 0.577*** −1.492*** −0.777** 1.532*** −0.228 0.268
[0.173] [0.230] [0.200] [0.233] [0.372] [0.364] [0.650] [0.338]
Ratio of age 55–59 in 2007 × 2009
0.145 0.366 0.871*** −2.122*** −0.394 1.960*** −0.04 0.11
[0.190] [0.251] [0.237] [0.268] [0.435] [0.429] [0.686] [0.478]
Ratio of age 55–59 in 2007 × 2010
0.032 0.193 0.887*** −2.854*** −0.229 1.840*** 0.151 0.823*
[0.180] [0.242] [0.203] [0.273] [0.448] [0.400] [0.707] [0.461]
Ratio of age 55–59 in 2007 × 2011
0.197 0.4 1.237*** −3.252*** −0.024 2.502*** 0.393 0.861*
[0.197] [0.257] [0.240] [0.299] [0.460] [0.434] [0.687] [0.455]
Observations 6210 6210 6210 6210 6210 6210 6210 6210
R-squared 0.034 0.027 0.052 0.137 0.287 0.063 0.04 0.085
Number of establishments
1114 1114 1114 1114 1114 1114 1114 1114
Table 5The effect of the ratio of 55–59 years old in male full-time workers in 2007 on employment share of various types of employees
(1) (2) (3) (4) (5) (6) (7) (8)
Total # of employees
Full-time employees
Younger than 50
50–59 years old
60 or older
Full-time younger than 25
Female part-time 35–54 years old
Part-time 60 or older
Ratio of age 55–59 in 2007 × 2006
0.350* 0.626*** 0.685*** −0.391 −1.640*** 1.303*** −0.348 −0.740*
[0.203] [0.232] [0.229] [0.298] [0.393] [0.380] [0.721] [0.378]
Ratio of age 55–59 in 2007 × 2008
0.051 0.276 0.577*** −1.492*** −0.777** 1.532*** −0.228 0.268
[0.173] [0.230] [0.200] [0.233] [0.372] [0.364] [0.650] [0.338]
Ratio of age 55–59 in 2007 × 2009
0.145 0.366 0.871*** −2.122*** −0.394 1.960*** −0.04 0.11
[0.190] [0.251] [0.237] [0.268] [0.435] [0.429] [0.686] [0.478]
Ratio of age 55–59 in 2007 × 2010
0.032 0.193 0.887*** −2.854*** −0.229 1.840*** 0.151 0.823*
[0.180] [0.242] [0.203] [0.273] [0.448] [0.400] [0.707] [0.461]
Ratio of age 55–59 in 2007 × 2011
0.197 0.4 1.237*** −3.252*** −0.024 2.502*** 0.393 0.861*
[0.197] [0.257] [0.240] [0.299] [0.460] [0.434] [0.687] [0.455]
Observations 6210 6210 6210 6210 6210 6210 6210 6210
R-squared 0.034 0.027 0.052 0.137 0.287 0.063 0.04 0.085
Number of establishments
1114 1114 1114 1114 1114 1114 1114 1114
Note: Standard errors with clustering for establishment ID are presented in brackets. *, **, *** indicate coefficients are statistically significantly different from 0 at the 10, 5, and 1 % levels, respectively. Control variables omitted from the table include industry-year dummies. Establishment fixed effects are also controlled
positions of the retirees. The effect on the number of female part-time employees is significantly negative only in the few years after the EESL revision, and there is a positive effect on the number of part-time employees older than 60. Table 7 con-firms the same observations for the employment ratio.
Table 8 shows the estimated coefficients of the ratio of employees aged 55–59 in 2003 on the ratios of the actual number of employees in 2008 to the predicted numbers. Col-umn (1) shows a greater than predicted increase in the number of employees aged 30–49. Interestingly, establishments with a higher ratio of workers aged 55–59 in 2003 tended to decrease the number of workers aged 60 or older in 2008. This might imply that even under the continued employment mandated by the revised EESL, establishments that have too many older workers tried to reduce their numbers. Although not statistically Table 6The effect of the ratio of 55–59 years old in male full-time workers in the previous year on log number of various types of employees
(1) (2) (3) (4) (5) (6) (7) (8)
Total # of employees
Full-time employees
Younger than 50
50–59 years old 60 or older Full-time younger than 25 Female part-time 35–54 years old
Part-time 60 or older
Ratio of age 55–59 in 2001 × 2002
0.091 0.022 −0.559*** 2.977*** 1.082** −0.29 0.364 −1.008**
[0.119] [0.138] [0.163] [0.566] [0.530] [0.475] [0.476] [0.510]
Ratio of age 55–59 in 2002 × 2003
0.042 0.031 −0.629*** 2.614*** 1.377** −0.419 0.181 −0.315
[0.106] [0.117] [0.167] [0.486] [0.586] [0.440] [0.386] [0.628]
Ratio of age 55–59 in 2003 × 2004
0.061 0.101 −0.623*** 2.703*** 1.603*** 0.148 0.131 −0.189
[0.098] [0.105] [0.156] [0.368] [0.462] [0.421] [0.396] [0.411]
Ratio of age 55–59 in 2004 × 2005
−0.005 0.099 −0.683*** 2.592*** 2.411*** 0.785** 0.079 −0.258 [0.094] [0.100] [0.128] [0.233] [0.420] [0.366] [0.357] [0.408]
Ratio of age 55–59 in 2005 × 2006
−0.106 −0.03 −0.700*** 1.980*** 2.037*** 0.819** −0.047 0.318 [0.083] [0.094] [0.104] [0.266] [0.437] [0.324] [0.313] [0.354]
Ratio of age 55–59 in 2006 × 2007
−0.137 0.389* −0.502*** 1.009*** 2.025*** 2.001*** −0.955* 0.078 [0.151] [0.214] [0.176] [0.244] [0.540] [0.474] [0.503] [0.453]
Ratio of age 55–59 in 2007 × 2008
−0.272*** −0.125 −0.641*** 0.740*** 2.737*** 1.253*** −0.244 0.786** [0.087] [0.106] [0.112] [0.189] [0.422] [0.367] [0.313] [0.360]
Ratio of age 55–59 in 2008 × 2009
−0.254*** −0.241*** −0.557*** 0.281* 3.223*** 1.299*** 0.248 1.466*** [0.083] [0.092] [0.105] [0.146] [0.407] [0.327] [0.316] [0.373]
Ratio of age 55–59 in 2009 × 2010
−0.356*** −0.427*** −0.557*** −0.359* 3.513*** 1.716*** 0.670* 2.031*** [0.102] [0.112] [0.122] [0.197] [0.506] [0.369] [0.384] [0.451]
Ratio of age 55–59 in 2010 × 2011
−0.359*** −0.368*** −0.482*** −0.786*** 4.756*** 2.365*** 0.574 2.398*** [0.122] [0.131] [0.148] [0.299] [0.555] [0.435] [0.447] [0.497]
Observations 11,740 11,740 11,740 11,740 11,740 11,740 11,740 11,740
R-squared 0.045 0.037 0.04 0.146 0.387 0.07 0.078 0.147
Number of establishments
1696 1696 1696 1696 1696 1696 1696 1696
Table 7The effect of the ratio of 55–59 years old in male full-time workers in the previous year on employment share of various types of employees
(1) (2) (3) (4) (5) (6) (7)
Full-time employees
Younger than 50
50–59 years old
60 or older
Full-time younger than 25
Female part-time 35–54 years old
Part-time 60 or older
Ratio of age 55–59 in 2001 × 2002
0.026 −0.468*** 0.566*** −0.098*** −0.114*** 0.009 −0.009
[0.023] [0.094] [0.113] [0.027] [0.036] [0.018] [0.007]
Ratio of age 55–59 in 2002 × 2003 −
0.004 −0.454*** 0.519*** −0.065** −0.097*** 0.016 0.003
[0.030] [0.086] [0.103] [0.029] [0.029] [0.031] [0.014]
Ratio of age 55–59 in 2003 × 2004
0.007 −0.466*** 0.541*** −0.075*** −0.063*** 0.01 −0.002
[0.026] [0.072] [0.083] [0.021] [0.023] [0.021] [0.007]
Ratio of age 55–59 in 2004 × 2005
0.027 −0.469*** 0.523*** −0.054*** −0.016 −0.017 0.003
[0.022] [0.046] [0.049] [0.018] [0.020] [0.016] [0.007]
Ratio of age 55–59 in 2005 × 2006
0.006 −0.395*** 0.434*** −0.040** 0.004 −0.011 0.005
[0.020] [0.049] [0.053] [0.017] [0.017] [0.015] [0.006]
Ratio of age 55−59 in 2006 × 2007
0.173*** −0.239*** 0.267*** −0.028 0.045** −0.135** 0
[0.062] [0.050] [0.040] [0.024] [0.021] [0.056] [0.007]
Ratio of age 55–59 in 2007 × 2008
0.019 −0.242*** 0.212*** 0.030* 0.040** −0.040** 0.007
[0.027] [0.036] [0.039] [0.016] [0.020] [0.020] [0.005]
Ratio of age 55–59 in 2008 × 2009 −
0.017 −0.194*** 0.102*** 0.093*** 0.079*** −0.024 0.017***
[0.022] [0.030] [0.033] [0.018] [0.020] [0.017] [0.006]
Ratio of age 55–59 in 2009 × 2010 −
0.055** −0.131*** −0.021 0.152*** 0.122*** −0.014 0.033***
[0.023] [0.036] [0.039] [0.020] [0.022] [0.017] [0.009]
Ratio of age 55–59 in 2010 × 2011 −
0.043 −0.089* −0.120** 0.209*** 0.169*** −0.023 0.043***
[0.026] [0.047] [0.055] [0.021] [0.026] [0.019] [0.010]
Observations 11,740 11,740 11,740 11,740 11,740 11,740 11,740
R-squared 0.043 0.136 0.234 0.29 0.127 0.051 0.13
Number of establishments
1696 1696 1696 1696 1696 1696 1696
Note: Standard errors with clustering for establishment ID are presented in brackets. *, **, *** indicate coefficients are statistically significantly different from 0 at the 10, 5, and 1 % levels, respectively. Control variables omitted from the table include industry-year dummies. Establishment fixed effects are also controlled
Table 8The effect of the ratio of 55–59 years old in male full-time workers in 2003 on the ratio of actual number of employees to predicted number of employees in 2008
(1) (2) (3) (4) (5)
30–49 years old 50–59 years old 60 or older Female part-time 35–54 years old
Part-time 60 or older
Ratio of age 55–59 in 2003 0.706*** 0.046 −0.502* −0.549 0.739
[0.166] [0.211] [0.304] [0.515] [1.453]
Observations 918 918 917 573 431
R-squared 0.074 0.011 0.049 0.047 0.144
significant, the effect for female part-time workers is negative and that for part-time workers older than 60 is positive, consistent with the results in Tables 2, 3, 4, 5, 6, and 7.
To summarize, the results revealed in this section show no evidence of substitution between old workers and young full-time workers. Neither is there any evidence of a negative effect of the EESL revision on opportunities for full-time employment for youth. Instead, though not very strong, there might have been a substitution effect for female part-time workers, especially during the few years after the EESL revision.
4 Effects on elderly’s earnings
4.1 Data: basic survey on wage structure
The main source of data used in this section is the Basic Survey on Wage Struc-ture (hereafter BSWS), conducted by the Ministry of Health, Labour and Welfare. The BSWS is cross-sectional survey of establishments. It asks surveyed establish-ments to choose their employees randomly to answer detailed information about their salaries, employment status, gender, age, and educational background.9 It also provides information at the establishment level, such as industry type and firm size. I pool all workers in the BSWS surveys conducted from 1998 to 2011.
I use annual earnings excluding bonus as the outcome variable. Overtime pay and other compensations are included. I exclude bonus because the survey records monthly earnings in June of the survey year and the bonus of the previous calen-dar year. This is particularly a problem when analyzing the wage changes at retire-ment and reemployretire-ment, because a 60-year-old worker who is currently on a reemployment contract may refer to the bonus he received before the mandatory retirement.
I limit the sample to male regular employees aged 48–65 and born from 1943
to 1949. More precisely, since the BSWS includes only the age as of June of the survey year, and the EESL defines cohort as those born between April of that year and March of the next year, I define the cohort as (survey year age—1). Thus, the sample includes male regular employees born between July 1943 and June 1950.
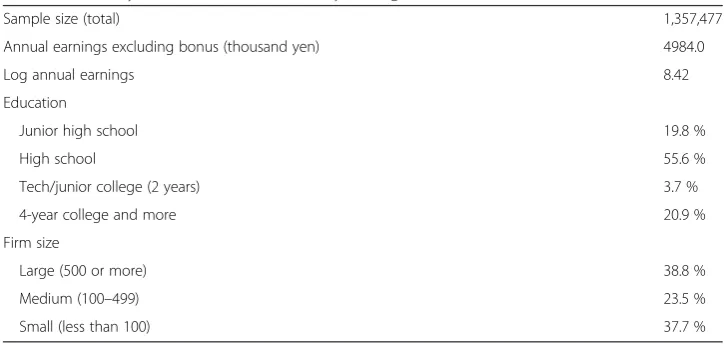
Table 9Summary statistics of the Basic Survey of Wage Structure
Sample size (total) 1,357,477
Annual earnings excluding bonus (thousand yen) 4984.0
Log annual earnings 8.42
Education
Junior high school 19.8 %
High school 55.6 %
Tech/junior college (2 years) 3.7 %
4-year college and more 20.9 %
Firm size
Large (500 or more) 38.8 %
Medium (100–499) 23.5 %
Small (less than 100) 37.7 %
Table 9 presents the summary statistics, and Fig. 3 shows the earnings profile of employees aged 55–65. As seen from the figure, earnings drop sharply at 60. The annual earnings before the employee reaches age 60 are, on average, about 5 million yen, and they drop to less than 4 million yen. Figure 3 also shows how the profile has changed over different cohorts; the decline after age 60 becomes slightly steeper for younger cohorts.
4.2 Empirical model
To measure the relative changes in earnings after age 60 for each birth-year cohort, I estimate the following equation:
logYci¼β0aciþβ1a2ciþ1ðaci≥60Þ β2þβ3aciþβ4a2ci
þXθ≠1945γθ1ðc¼θÞ 1ðaci≥60Þ þδXciþεci ð 4Þ
whereaciis the age of the individualiwho was born in yearc, and the first half of the
right-hand side is intended to approximate the shape of the earnings profile around age 60.10The parameter of my interest is the coefficient of the interaction term between the cohort dummy and dummy for being older than 60, γθ. It captures the differences in the drop in earnings at age 60 across cohorts.Xciincludes other control variables such as education,
co-hort dummies, and calendar year dummies.
It is important to note that the observed change in the earnings drop at age 60 may reflect two different effects. The first effect is the genuine earnings decline for equally productive workers. The second effect refers to the compositional change in workers who continue to work after the mandatory retirement age. Presumably, those who were able to continue to work before the EESL revision were positively selected, and thus, the earnings of those older than 60 may fall after the EESL revision just by reflecting this compositional effect. Unfortunately, the lack of worker-level panel data makes it very difficult to distinguish these two effects.
4.3 Results
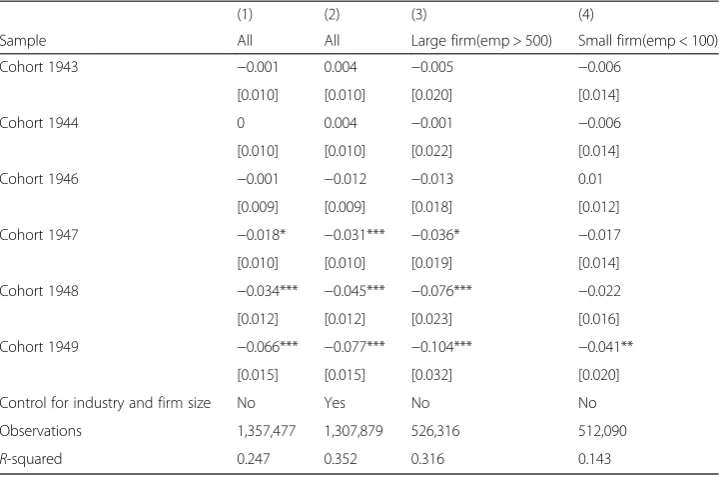
Table 10 presentsγθs, the estimated drop in earnings at age 60 of cohortθrelative to cohort 1945. Figure 4 plots the estimated coefficients in columns (1), (3), and (4) overθ. Column (1) reports estimates from the entire sample; the cohort born in 1947 and later experience larger declines in earnings at age 60. The timing of this decline is 1 year later than the EESL revision and coincides with the so-called year 2007 problem. To put it another way, the baby boomers experienced larger earnings declines upon their mandatory retirement and Table 10The estimated drop in earnings at age 60 by cohort, relative to cohort 1945
(1) (2) (3) (4)
Sample All All Large firm(emp > 500) Small firm(emp < 100)
Cohort 1943 −0.001 0.004 −0.005 −0.006
[0.010] [0.010] [0.020] [0.014]
Cohort 1944 0 0.004 −0.001 −0.006
[0.010] [0.010] [0.022] [0.014]
Cohort 1946 −0.001 −0.012 −0.013 0.01
[0.009] [0.009] [0.018] [0.012]
Cohort 1947 −0.018* −0.031*** −0.036* −0.017
[0.010] [0.010] [0.019] [0.014]
Cohort 1948 −0.034*** −0.045*** −0.076*** −0.022
[0.012] [0.012] [0.023] [0.016]
Cohort 1949 −0.066*** −0.077*** −0.104*** −0.041**
[0.015] [0.015] [0.032] [0.020]
Control for industry and firm size No Yes No No
Observations 1,357,477 1,307,879 526,316 512,090
R-squared 0.247 0.352 0.316 0.143
Note: Standard errors with clustering for establishment ID are presented in brackets. *, **, *** indicate coefficients are statistically significantly different from 0 at the 10, 5, and 1 % levels, respectively. Control variables omitted from the table include age, age squared, over 60 dummy, over 60 dummy × age, over 60 dummy × age squared, education dummies, cohort dummies, and calendar year dummies
reemployment. Column (2) confirms that the results do not change much when industry and firm size are controlled.
Columns (3) and (4) report the estimates from subsamples of large and small firms. The decline in relative earnings of baby boomers is much greater in large firms. This is
Table 11The effect of the ratio of 55–59 years old in male full-time workers in 2003 on log number of various types of employees, interacted with the change in earnings drop at age 60 between cohorts 1943–1945 and 1946–1948
(1) (2) (3) (4) (5) (6) (7) (8)
Total # of employees Full-time employees Younger than 50 50– 59 years old 60 or older Full-time younger than 25 Female part-time 35–54 years old
Part-time 60 or older
Ratio of age 55–59 in 2003 × 2002
0.077 0.036 0.125* 0.069 −0.231 −0.085 0.127 −0.006
[0.067] [0.061] [0.071] [0.108] [0.282] [0.157] [0.227] [0.163]
Ratio of age 55–59 in 2003 × 2002 × earnings drop at age 60
−0.211 −0.138 −0.114 −0.356 −0.64 0.506 −0.416 −0.946** [0.140] [0.165] [0.163] [0.221] [0.742] [0.338] [0.384] [0.415]
Ratio of age 55–59 in 2003 × 2004
0.038 0.058 0.04 −0.036 0.261 0.558** −0.141 0.037
[0.056] [0.053] [0.045] [0.161] [0.409] [0.276] [0.246] [0.298]
Ratio of age 55–59 in 2003 × 2004 × earnings drop at age 60
−0.258 0.009 −0.151 −0.593 0.775 0.399 0.641 1.372 [0.158] [0.129] [0.111] [0.506] [1.306] [0.757] [0.628] [0.886]
Ratio of age 55–59 in 2003 × 2005
−0.091 −0.041 0.015 −0.523*** 0.822** 1.043*** −0.166 0.106 [0.087] [0.077] [0.086] [0.176] [0.413] [0.308] [0.272] [0.325]
Ratio of age 55–59 in 2003 × 2005 × earnings drop at age 60
−0.042 0.244 −0.295 0.298 0.708 0.236 0.777 1.584* [0.223] [0.178] [0.212] [0.508] [1.263] [0.885] [0.643] [0.864]
Ratio of age 55–59 in 2003 × 2006 −
0.172* −0.096 0.007 −0.867*** 1.231** 1.496*** −0.206 0.635
[0.096] [0.087] [0.103] [0.236] [0.565] [0.368] [0.286] [0.432]
Ratio of age 55–59 in 2003 × 2006 × earnings drop at age 60
−0.245 0.062 −0.595*** 0.304 −0.526 −0.766 0.394 0.579 [0.268] [0.228] [0.223] [0.749] [1.677] [1.113] [0.686] [1.203]
Ratio of age 55–59 in 2003 × 2007
−0.09 0.164 0.193 −1.368*** 1.319 2.054*** −1.162** 0.41 [0.144] [0.251] [0.125] [0.459] [0.877] [0.557] [0.566] [0.587]
Ratio of age 55–59 in 2003 × 2007 × earnings drop at age 60
−0.552 0.176 −1.068*** 0.284 −0.378 −0.6 2.057 1.376 [0.433] [0.523] [0.387] [1.334] [2.506] [1.758] [1.715] [1.606]
Ratio of age 55–59 in 2003 × 2008 −
0.344*** −0.208 0.028 −1.842*** 0.606 1.844*** −0.463 0.387
[0.117] [0.130] [0.137] [0.468] [0.876] [0.514] [0.349] [0.746]
Ratio of age 55–59 in 2003 × 2008 × earnings drop at age 60
−0.101 0.298 −0.683** 1.126 1.94 −1.145 0.602 2.955 [0.328] [0.335] [0.298] [1.496] [2.733] [1.444] [0.821] [2.356]
Observations 6108 6108 6108 6108 6108 6108 6108 6108
R-squared 0.031 0.016 0.027 0.084 0.283 0.072 0.051 0.099
Number of establishments
925 925 925 925 925 925 925 925
consistent with the results of Kondo and Shigeoka (2015); the increase in elderly employ-ment due to the EESL is mainly observed in large firms, because the mandatory retireemploy-ment policy was implemented more strictly at large firms.
5 Interaction between employment and earnings adjustments
So far, I have analyzed employment and earnings adjustments separately, even though the employer may take decisions about employment and earnings simultaneously. This is mainly due to data limitations; the different sampling schemes of the ETS and BSWS make it difficult to match the two datasets. As explained in Section 3, the panel data constructed from the ETS includes establishments with 500 or more employees. How-ever, the BSWS is a random sample from the population of establishments, with sam-pling weights depending on the industry, firm size, and region, and unlike the ETS, it is not a complete survey of large establishments. Therefore, except for a few specific es-tablishments that represent a specific firm size of a specific industry in a specific re-gion, most establishments are not covered by the BSWS every year. Hence, matching the BSWS with the ETS not only reduces the sample size substantially but also causes a potentially severe sample selection bias.
In order to avoid these problems, I match the changes in earnings estimated for each industry–region cell from the BSWS to the establishments in the ETS, instead of matching the individual establishments. Admittedly, this approach takes the earnings drop at age 60 as given and examines how it affects employment ment. In reality, the capacity to adjust employment may also affect earnings adjust-ments. Yet, it is very difficult to model the joint determination of earnings and employment adjustments using two separate datasets on employment and earnings that do not match at the individual establishment level. The reason I choose to
Table 12The effect of the ratio of 55–59 years old in male full-time workers in the previous year on log number of various types of employees, interacted with the change in earnings drop at age 60 between cohorts 1943–1945 and 1946–1948
(1) (2) (3) (4) (5) (6) (7) (8)
Total # of employees Full-time employees Younger than 50 50– 59 years old 60 or older Full-time younger than 25 Female part-time 35–54years old
Part-time 60 or older
Ratio of age 55–59 in 2001 × 2002
0.036 −0.051 −0.764*** 3.494*** 0.739 −1.344*** 0.961 −1.141*
[0.147] [0.179] [0.180] [0.334] [0.659] [0.460] [0.661] [0.614]
Ratio of age 55–59 in 2001 × 2002 × earnings drop at age 60
0.27 −0.039 1.178** −3.605*** −0.268 4.065*** −2.621 0.388
[0.440] [0.497] [0.551] [1.396] [1.970] [1.517] [1.699] [1.967]
Ratio of age 55–59 in 2002 × 2003
−0.013 −0.008 −0.669*** 2.426*** 1.304** −0.68 0.232 −0.188 [0.100] [0.117] [0.170] [0.522] [0.613] [0.439] [0.433] [0.641]
Ratio of age 55–59 in 2002 × 2003 × earnings drop at age 60
0.602* −0.135 0.848* 0.106 −2.117 0.637 −0.685 −1.87
[0.326] [0.365] [0.495] [1.845] [2.164] [1.731] [1.270] [2.442]
Ratio of age 55–59 in 2003 × 2004 −
0.004 0.049 −0.748*** 2.770*** 1.436*** −0.256 0.105 −0.387
[0.110] [0.116] [0.169] [0.345] [0.484] [0.449] [0.445] [0.467]
Ratio of age 55–59 in 2003 × 2004 × earnings drop at age 60
0.381 −0.05 0.995** −1.719 −0.757 1.287 0.12 0.588
[0.364] [0.388] [0.471] [1.148] [1.550] [1.555] [1.239] [1.649]
Ratio of age 55–59 in 2004 × 2005 −
0.138 −0.008 −0.843*** 2.566*** 2.263*** 0.58 −0.009 −0.451
[0.099] [0.108] [0.129] [0.217] [0.451] [0.368] [0.393] [0.451]
Ratio of age 55–59 in 2004 × 2005 × earnings drop at age 60
0.556 0.14 0.839* −0.92 −1.128 0.575 0.071 1.043
[0.381] [0.432] [0.495] [0.954] [1.534] [1.611] [1.168] [1.563]
Ratio of age 55–59 in 2005 × 2006 −
0.189** −0.091 −0.776*** 1.918*** 1.994*** 0.757** −0.064 0.177
[0.083] [0.102] [0.104] [0.310] [0.488] [0.308] [0.346] [0.409]
Ratio of age 55–59 in 2005 × 2006 × earnings drop at age 60
0.271 −0.149 0.411 −0.526 −2.278 −0.317 −0.121 −0.029
[0.350] [0.427] [0.443] [0.859] [1.565] [1.414] [1.107] [1.525]
Ratio of age 55–59 in 2006 × 2007 −
0.18 0.371 −0.610*** 1.170*** 2.478*** 1.666*** −1.128** 0.203
[0.168] [0.245] [0.183] [0.248] [0.535] [0.435] [0.505] [0.488]
Ratio of age 55–59 in 2006 × 2007 × earnings drop at age 60
0.325 −0.044 0.321 −0.32 −2.085 −0.252 2.458 0.885
[0.461] [0.557] [0.559] [0.822] [1.666] [1.467] [1.563] [1.583]
Ratio of age 55−59 in 2007 × 2008 −
0.374*** −0.224* −0.703*** 0.601*** 2.858*** 1.349*** −0.219 0.787*
[0.096] [0.119] [0.113] [0.172] [0.432] [0.344] [0.351] [0.409]
Ratio of age 55–59 in 2007 × 2008 × earnings drop at age 60
0.364 0.143 0.234 0.426 −1.803 −0.84 0.036 0.47
[0.319] [0.386] [0.403] [0.658] [1.579] [1.339] [1.049] [1.380]
Ratio of age 55–59 in 2008 × 2009 −
0.290*** −0.273*** −0.553*** 0.314** 3.280*** 1.425*** 0.318 1.545***
[0.089] [0.098] [0.111] [0.149] [0.446] [0.343] [0.344] [0.408]
Ratio of age 55–59 in 2008 × 2009 × earnings drop at age 60
0.332 0.067 0.408 −0.188 −1.394 −0.699 0.112 2.09
take earnings as given, rather than employment, is that the sample size of the BSWS is much larger, thus allowing me to estimate industry–region level adjust-ment measures more precisely.
Specifically, I first estimate equation (4) for subsamples of the BSWS defined by in-dustry and region. Then, for each inin-dustry–region cell, I calculate the average change in the earnings drop at age 60 between cohorts born from 1943 to 1945 and from 1946 to 1948 for industry–region cellras follows:
Dr¼γ1946þγ1947þγ1948
3 −
γ1943þγ1944þ0 3
Then, I add the interaction terms between the ratio of employees aged 55–59 in the base year or previous year andDrto equations (1) and (2):
Yijrt¼αþ X
τ≠2003 β0τXijr2003þβ1τXijr2003Dr
1ðt¼τÞ þvjtþuiþεijrt ð5Þ
Yijrt¼αþβ0tXijrt−1þβ1tXijrt−1Drþvjtþuiþεijrt ð6Þ
Note that Dr itself is not included in the left-hand side of the equation because it is absorbed by establishment fixed effects. If β1tis positive, cutting earnings of employees older than 60 allows the employer to increase Yijrt, the number of a certain group of employees.
The industry coding changed in 2004 and 2009 in the BSWS. Thus, the sample is limited to the following industries that can be coded consistently: manufacturing, trade, finance, and services (medical and nursing + other services). For manufacturing and services, I further divide the sample into 11 regions.11For finance and trade industries, I do not divide the sample into regions because some of the cohort–region–industry cells have no observations. Thus, in total, there are 24 industry–region cells.
Table 12The effect of the ratio of 55–59 years old in male full-time workers in the previous year on log number of various types of employees, interacted with the change in earnings drop at age 60 between cohorts 1943–1945 and 1946–1948(Continued)
Ratio of age 55–59 in 2009 × 2010
−0.353*** −0.432*** −0.509*** −0.267 3.798*** 1.952*** 0.663 2.042*** [0.111] [0.120] [0.130] [0.205] [0.566] [0.385] [0.412] [0.488]
Ratio of age 55–59 in 2009 × 2010 × earnings drop at age 60
0.208 −0.151 0.296 −0.583 −2.19 −1.236 0.442 2.087
[0.355] [0.393] [0.426] [0.702] [1.795] [1.319] [1.296] [1.633]
Ratio of age 55–59 in 2010 × 2011 −
0.324** −0.335** −0.425*** −0.671** 5.232*** 2.668*** 0.631 2.618***
[0.132] [0.141] [0.159] [0.325] [0.607] [0.451] [0.490] [0.543]
Ratio of age 55–59 in 2010 × 2011 × earnings drop at age 60
0.155 −0.127 0.171 −0.065 −2.916 −1.659 −0.125 0.203
[0.391] [0.426] [0.475] [0.881] [1.934] [1.404] [1.482] [1.942]
Observations 10,681 10,681 10,681 10,681 10,681 10,681 10,681 10,681
R-squared 0.046 0.034 0.046 0.132 0.402 0.077 0.085 0.16
Number of establishments
1531 1531 1531 1531 1531 1531 1531 1531
Table 11 presents the estimated coefficients of equation (5). Most of the interaction terms between earnings drop and ratio of employees aged 55–59 in 2003 are statistically insignificant. Somehow, some of the coefficients of the interaction terms are significantly negative in column (3); that is, firms in which the elderly have lower earnings tend to de-crease employment of those younger than 50. This result may be a reflection of the busi-ness conditions at the regional level; that is, when a firm faces poor busibusi-ness conditions, it tries to cut the earnings of the elderly and decreases the number of new hires.
Figure 5 plots the estimated effect of the ratio of employees aged 55–59 in 2003 at the quartiles of the change in earnings drop, that is, β0tβ1tDr. The median is 0.045 (equivalent to a 4.5 % earnings cut), the 25th percentile is−0.072, and the 75th percent-ile is 0.145. There seems to be no complementarity between earnings and employment adjustments, except for part-time employees older than 60.
Table 12 and Fig. 6 repeat the same exercise for equation (6), which refers to the ef-fect of the ratio of employees aged 55–59 in the previous year on various outcomes. It is puzzling that the larger wage drop after 2006 is associated with the smaller decrease in the number of employees younger than 50 in the early 2000s. For other groups, again, there does not seem to be complementarily between earnings and employment adjustments.
6 Conclusions
This paper examines the effect of increased elderly employment, mainly caused by the legal obligation of continued employment up to the pension eligibility age enacted in 2006, on employment of other workers and elderly’s earnings.
Consistent with existing studies, such as Gruber et al. (2010), I find no evidence for substitution between young full-time workers and elderly workers. As already pointed
out by Böheim (2014), since youth unemployment is a pressing problem in many devel-oped countries, many of which also suffer from population aging, the lack of a trade-off between young and old workers has an important policy implication. Despite the popu-lar perception, policies to promote elderly employment do not harm employment pros-pects of the young.
I also find substantial decline in earnings of baby boomers, who reach 60 after 2006, in their early sixties. Combined with the modest negative effect on middle-aged female part-time workers, the results of my study suggest that in response to the mandated continued employment of elderly workers, firms primarily cut wages of elderly workers, and some firms reduced the number of female part-time workers. Also, I find suggest-ive evidence that wage cuts of the elderly did not lead to an increase in younger workers’employment.
Endnotes
1
Among establishments with 30 or more employees, 81 % of establishments still set 60 as the mandatory retirement age, and as of 2012, most of them had instituted an ex-plicit rule for either reemployment (80 %) or employment extension (20 %) rather than extending the mandatory retirement age (General Survey on Working Conditions, MHLW, 2012).
2
This definition is found in many official publications of the Ministry of Health, Labour and Welfare.
3
The numbers of births are sourced from the Vital Statistics. Data for 1944–1946 are not available because of the war.
4
Strictly speaking, the relevant population refers to those who reached 60 after April 2006; however, the best information available from the Population Census provides the age as of October 31.
5
The industry codes changed a few times during 2002–2011. I use the code in the 2004 survey to maintain consistency.
6
Admittedly, the composition is not representative of the Japanese labor force be-cause the sample is limited to large establishments that have existed since a long time.
7
Since a firm is likely to determine the number of employees for different age groups or employment status jointly, ideally, it would be more efficient to estimate equations with different dependent variables as a system, rather than estimating a separate regres-sion for each dependent variable. Residuals are indeed strongly correlated for some pairs of the dependent variables; however, it is practically difficult to incorporate fixed effects in the SUR model. Omitting these correlations would not cause any bias to the coefficients, though it reduces the efficiency of the estimates.
8
We cannot calculate this value for variables including workers aged 25–29 and younger, because they are likely to be hired within 5 years from the survey.
9
10
This specification does not allow any changes in the slopes of age profiles across cohorts, because it is practically difficult to allow all coefficients to change in a cohort with a finite sample size. Note that if the wage curve had been flattened after the EESL revision, it would have narrowed the earnings drop at age 60.
11
The 11 regions are Hokkaido, Tohoku, Kitakanto (Tochigi, Ibaraki, and Gunma), Minamikanto excluding Tokyo, Tokyo, Tokai (Shizuoka, Aichi, Gifu, Mie), Koshinetsu and Hokuriku (Yamanashi, Niigata, Nagano, Toyama, Ishikawa, and Fukui), Kinki, Chugoku, Shikoku, and Kyushu. Regions other than Kitakanto, Tokai, Koshinetsu, and Hokuriku are the same as the ten regions officially defined by the Statistics Bureau.
Competing interests
The IZA Journal of Labor Policy is committed to the IZA Guiding Principles of Research Integrity. The author declares that she has observed these principles.
Acknowledgements
I would like to thank the anonymous referees and the editor for the useful remarks.
This research is supported by JSPS KAKENHI Grant Numbers 23730235, 15K17072 (PI: Ayako Kondo), and 24330074 (PI: Ryo Kambayashi). The use of microdata of the Employment Trend Survey, the Establishment and Enterprise Census, and the Basic Survey on Wage Structure is approved by the Ministry of Health, Labour and Welfare and by the Statistics Bureau of the Ministry of Internal Affairs and Communications. I especially thank Hitoshi Shigeoka for our extensive discussion about empirical strategy in the early stages of this project and Ryo Kambayashi for helping me to obtain the data. I am also grateful to the editor and an anonymous reviewer of this journal, Karine Ishii, and seminar participants at the RIETI/IZA Workshop: Changing Demography and the Labor Market, Kyoto Summer Workshop on Applied Economics, University of Tokyo, and the Ministry of Health, Labour and Welfare for valuable comments. Responsible editor: Daiji Kawaguchi
Received: 23 June 2015 Accepted: 7 January 2016
References
Ariga K, Kambayashi R (2010) Employment and wage adjustments at firms under distress in Japan: an analysis based upon a survey. J Jpn Int Econ 24(2):213–235
Böheim R (2014) The effect of early retirement schemes on youth employment. IZA World of Labor., June 2014 Gruber J, Milligan K, Wise DA (2010) Introduction and Summary. In: Gruber J, Wise DA (eds) Social security programs
and retirement around the world: the relationship to youth employment. University of Chicago Press, Chicago, pp 1–45
Hamaaki J, Hori M, Maeda S, Murata K (2012) Changes in the Japanese employment system in the two lost decades. Ind Labor Relat Rev 65(4):810–846
Kawaguchi D, Ohtake F (2007) Testing the morale theory of nominal wage rigidity. Ind Labor Relat Rev 61(1):59–74 Kondo A (2014) Koureisha Koyo Anteiho no Eikyo Bunseki, Iwamoto Y, Kantori M, Shioji E and Teruyama H eds,
Gendai Keizaigaku no Choryu 2014, Tokyokeizai, Tokyo, Japan.
Kondo A, Shigeoka H (2015) The effectiveness of government intervention to promote elderly employment: evidence from elderly employment stabilization law., http://papers.ssrn.com/sol3/papers.cfm?abstract_id=2341680 Martins PS, Novo AA and Portugal P (2009) Increasing the legal retirement age: the impact on wages, worker flows and
firm performance. IZA Discussion Paper No. 4187.
Munnel AH, and Wu AY (2012) Will delayed retirement by the baby boomers lead to higher unemployment among younger workers? Center for Retirement Research at Boston College Working Paper
2012-22.
Nagano H (2014). Koureisou no Koyo to Hoka no Nenreisou no Koyou—Koyo-doko-chosa Jigyoshohyo Kohyo Data no Bunseki. The Japanese Journal of Labour Studies, No. 643 (in Japanese)
Oshio T, Shimizutani S, Oishi AS (2010) Does social security induce withdrawal of the old from the labor force and create jobs for the young? The case of Japan. In: Gruber J, Wise DA (eds) Social security programs and retirement around the world: the relationship to youth employment. University of Chicago Press, Chicago, pp 217–241 Vestad OL (2013) Early retirement and youth employment in Norway., Presented at European Association of Labour
Economics