R E S E A R C H
Open Access
The balance of autonomous and
centralized control in scheduling problems
Henning Blunck
1, Dieter Armbruster
2, Julia Bendul
1*and Marc-Thorsten Hütt
3*Correspondence:
1RWTH Aachen University, School of Management & Economics, Kackertstr. 8, 52062 Aachen, Germany
Full list of author information is available at the end of the article
Abstract
The scheduling of processes in a network is a core logistic challenge with a multitude of applications in our complex industrialized world. Often, scheduling decisions are based on incomplete and unreliable information. Here, a simple rule of ’more
information, better decisions’ may no longer hold and heuristics balancing global and local information, or centralized and autonomous control, may yield better
performance. So far, only anecdotal evidence for the potential benefit of autonomous control in scheduling exists. Here, we explore this hypothesis within a minimal model derived from scheduling principles and the phenomenology of dynamical processes on graphs. In this model, centralized and autonomous control can be represented and quantitatively assessed, performance is well defined and problem complexity can be varied.
Our model shows that a balance of centralized and autonomous control can enhance the performance in networks of decision-making entities. The mechanistic insight gained from the model also reveals the limitations of hybrid control setups: We find that communication at a high hierarchy level can give an advantage to centralized control. Counter-intuitively, it arises not from a higher degree of coordination and quicker convergence towards a common solution, but rather from an accelerated sampling of candidate choices leading to a measurable increase in information flow from higher to lower hierarchical levels. Our study allows us to formulate a new view of autonomous control in industrial production and derive a set of suggestions with the potential to enhance performance under realistic conditions of scheduling heuristics of jobs in a production process.
Keywords: Distributed decision making, Complex networks, Graph coloring dynamics, Industrial production, Industry 4.0
Background
Diverse real-world organizational challenges can be mapped onto the abstract problem of scheduling events on a network (Pinedo2012). The corresponding networks could be towns connected by highways (Rosvall et al.2005), machines connected by material flows (Becker et al.2011) or routers connected by internet connections (Vázquez et al.2002).
In an idealized world, with infinite computational resources (in particular a negligi-ble processing time of information), an absolute knowledge about the functioning of the system (leading to optimal decision algorithms), and in the absence of noise and uncer-tainty in the data, the quality of a decision will necessarily increase with the amount of
information included. In real-world situations, however, rapid decisions need to be made based on limited and occasionally unreliable information in systems, whose mechanistic rules of organization and functioning are partially unknown (Yang et al.2007; Mula et al.
2006). In industrial production, autonomous control is perceived as a promising approach to achieve robustness against the increasing dynamical and structural complexity of production networks (Scholz-Reiter et al.2009).
The general picture is the following: A decision requires evaluating the transition from one system state to another. Compared to evaluating global information, the combi-natorial explosion of decision complexity is dramatically reduced by processing local information only. The gain in processing speed is generally considered the main advantage of autonomous control. A more subtle effect is that distal information can be systemat-ically wrong or outdated due to the longer transmission time, leading to an increase in erroneous decisions, as they are based on essentially random information. This is partic-ularly fascinating when the deterioration of distal information arises from the decision process itself (i.e. from the updates / decisions occurring at distal system sites), linking the topic of local decisions to the general framework of emergent collective behaviors and self-organization (Moreira et al.2004a; Marr and Hütt2006; Tang et al.2014).
Evidence for global behavior arising from local decisions (or “autonomous control”) has been provided for a multitude of applications, ranging from how social patterns arise (fads, fashions, youtube videos ’going viral’) from localized conformity (Bikhchandani et al.
1992) to how stomatal cells in plant leaves compute their optimal opening state in a dis-tributed fashion (Peak et al.2004) and vehicle flow through bottlenecks (Lämmer and Helbing2008).
The highly aggregated question of a benefit of autonomous control is situated at the interface of algorithmics, decision theory, logistics and systems science. It is encountered in a myriad of application scenarios – ranging from biology (Peak et al.2004; Mott and Peak2006) and social sciences (Schreyögg and Sydow2010; Sales-Pardo et al.2013) to information and communication technologies (Moreira et al.2004a; Tang et al.2014) and industrial production (Trentesaux2009; Duffie et al.2013).
In production networks, relevant information for centralized decision making is either not available at all or only after a time delay. Autonomous control strategies seem promis-ing to overcome the related problems: Decentralized coordination of intelligent logistics objects (parts, orders, machines etc.) and the adaptive routing through the manufac-turing and assembly system can positively impact logistics performance of industrial production (Scholz-Reiter and Freitag2007; Scholz-Reiter et al.2009). To achieve self-organization and emergent behavior, the logistic objects are capable to process local information, to decide and to communicate autonomously and to flexibly react on dynamic framework conditions and changing as well as conflicting target dimensions (Scholz-Reiter et al.2005).
(Duffie et al.2013; Scholz-Reiter et al.2010; Duffie2008; Hongler et al.2010; Schuh et al.
2014)).
Ever clearer links between network topology and the dynamical performance of sup-ply, distribution and manufacturing networks have emerged over the last years (see, e.g., (Meyer et al.2015; Perera et al.2017; Matous and Todo2017)).
Abstract, minimal process models provide a suitable formal framework for addressing such universal dynamical properties of networks (see, Watts (2002); Müller-Linow et al. (2008a); Bornholdt (2005); de Menezes and Barabási (2004) for examples from diverse fields). A similar approach can be employed for acquiring a generic insight into the bal-ance of local and global information (or autonomous vs. centralized control) in scheduling decisions on networks (Windt and Hütt2010). Some cornerstones of our understand-ing of this situation have already been contributed by such minimal process models in the past:
In Moreira et al. (2004b) the loss of performance due to noise for a specific local deci-sion task, density classification, is analyzed. The result is that high performance can be restored by inserting distal information (shortcuts, representing a form of centralized control) into the local neighborhoods (representing autonomous control). Studying cel-lular automata on graphs, in Marr and Hütt (2006) it has been shown that shortcuts can also serve as noise sources by inserting random input into homogeneous local patterns. Relatedly, in the forest-fire model (Drossel and Schwabl1992) (a minimal model of self-organized criticality) shortcuts can functionally substitute random excitation probability, which is the control parameter of the critical state (Graham and Matthai2003).
In order to study, how a balance of centralized and autonomous control affects the performance of a production system, we employ a minimal model of the scheduling of (production) events on a graph:Graph coloring, the process of placing colors on a graph, such that no same colors are linked, is an algorithmic problem directly associated with a formal scheduling problem. De Werra and Hertz (2015) note that Graph Coloring “may provide a natural tool for dealing with a variety of scheduling problems”. Determining, for a given graphG, the smallest number of colorsχ = χ(G), for which such a color-ing is possible (known as the graph’s chromatic number), is an NP-hard problem (Karp
1972). The underlying notion of conflicts (represented as edges in a graph) and conflict resolution under constraints (represented by the limited number of colorsχ), makes the graph coloring problem an ideal minimal model for resource allocation problems. It has been explored in various application areas, such as packet switching in shared radio chan-nels (Yeo et al.2002), register allocation (Smith et al.2004), and diverse other scheduling problems (Myszkowski2008; Halldórsson et al.2003; Pardalos et al.1999; Marx2004).
The model we explore,graph coloring dynamics(GCD) for a given chromatic number, has been previously used in a sociological study (Kearns et al.2006) yielding fascinating empirical results on the solvability of different network architectures under local informa-tion. The idea to investigate not the minimal number of colors necessary to color a given graph, but the time and effort required for distributed decision-making entities (asso-ciated with graph vertices) to reach a conflict-free coloring, given a feasible amount of colors was initially discussed as an abstract model to study distributed constraint satisfac-tion problems (Fabiunke1999). In GCD a node selects a color from a given list (of length
nodes, until the graph is ’solved’. GCD is thus a dynamical process on a graph operating on a discrete state space ofχelements. In addition to being an interesting test scenario for social coordination, GCD is also an excellent framework for assessing (independently of experiments) the scheduling performance of both, network architectures and deci-sion heuristics, when formally encoding and parameterizing different solution strategies (Hadzhiev et al.2009; Windt and Hütt2010).
The remainder of the article is structured as follows: First, we reproduce the hypothesis of Philipp et al. (2006); Windt et al. (2008) about the balance of tralized and autonomous control, which leads us to a counter-intuitive role of cen-tralized control. Next, we develop a mechanistic understanding by studying the time evolution of solution regimes on the graph. Lastly, we explore the real-life signifi-cance of the findings obtained with a schematic model by evaluating realistic per-formance indicators for industrial production. Details on our model, the evaluation of performance and the parameters used throughout the paper are provided in the “Methods” section.
Results
Performance as a function of autonomous control
Combining a regular (e.g., ring) architecture with a few randomly inserted shortcuts has become the most famous random graph model for small-world architectures, uniting high local clustering with a small average shortest path length (Watts and Strogatz1998). Since the average path length decreases dramatically, already with a small percentage of short-cuts added, their insertion can be seen as a shift from a decentralized, local control to a more collective, centralized (even though disordered) control (Watts and Strogatz1998). From the viewpoint of production planning and control, variation of the amount of hierarchy in the network is typically considered a suitable way of structurally varying the balance between decentralized and centralized control – with highly hierarchical structures being associated with centralized, global control, while more spread-out, het-erarchical structures are associated with decentralized, local control (Trentesaux2009). Particularly when employing highly aggregated representations of dynamical processes, like cellular automata (Wolfram1984), a variation of the update scheme (Marr and Hütt
2009) could provide an interesting alternative to the network strategies for varying the control type. Increasing neighborhood size could allow the transition towards ever more centralized control. In practice, however, such rule-based changes of the control type are not easy to implement: (1) update rules operating on different neighborhood sizes are dif-ficult to compare (due to the different sizes of the underlying rule space); (2) in industrial production systems realistic networks typically have a few hundred nodes; in this case, the diameter of the graph is so small that when going from nearest neighbors to next-to-nearest neighbors in a node’s update rule, already a substantial portion of the graph is covered1.
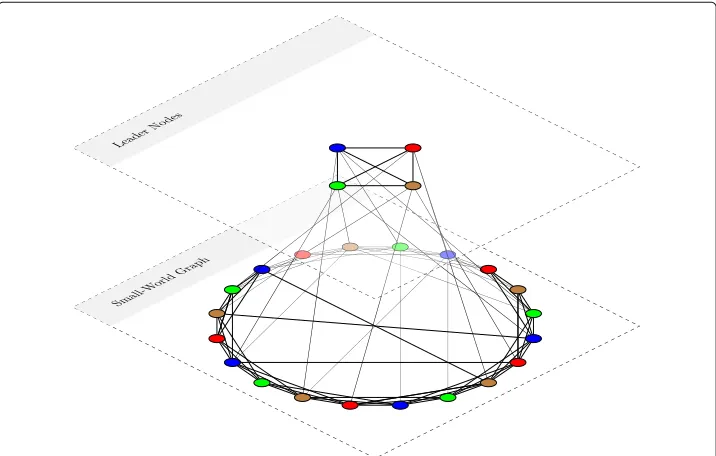
organized – main, ring-like part of the network. Figure 1 illustrates the setup of the system.
Summarizing, a GCD networkG = G(N,l,c,χ,s,kL,h)is then characterized by the
number of ring nodes,N, the number of leader nodes,l, the number of connected neigh-bors,c, to the left and right of each node on the ring, the graph’s chromatic number,χ, the number of shortcutss, as well as the number of links per leader node onto the main network,kL, and a binary variablehindicating whether the leader nodes are connected
(i.e. they form a complete subgraph).
With the structural prerequisites of our model fixed, we define the dynamical model representing decision and scheduling processes. To test our hypotheses, we need an experimental setup, a conflict graph, that can expressed analytically as the result of a gen-erating procedure. This is not only necessary to be able to change the degree of hierarchy in the system gradually and purposefully, but also to measure the problem-solving per-formance across multiple different “benchmark scenarios” (Hernando et al.2016). Our model, GCD for a given chromatic number, is executed in the following way (Hadzhiev et al. 2009; Windt and Hütt 2010): Given an initial distribution of colors, nodes are scheduled for an update according to the ’channeled excitation’ scheme from (Hadzhiev et al. 2009), where color changes in the neighborhood prompt an update. For such a color update of a node, the colors in the neighborhood are evaluated and the conflict-minimizing color is picked. If the node already has the conflict-conflict-minimizing color, no update is performed (with probabilityp) or a random color is selected (with probability 1−p). The number of color changesrC(G)until the system converges to a fully solved
graph, averaged over many initial color distributions, is then measured. Details are given in the “Methods” section. Figure1 gives an example of a successful coloring with four colors (χ=4).
In the following investigation, we will systematically vary the chromatic numberχ(and, consequently, the coordination numberc; see “Methods” section)2, as well as the number of links per leader nodekL, and measure the ability of the networks to solve the GCD
problem. Since we are interested in the effect of network structure on the solution process we normalizerC(G)by the number of color changes required by a network with equal number of nodes and links (see “Methods” section), to remove the effect of increasing network connectivity investigated in Hadzhiev et al. (2009). We will consider a system where every leader node is connected to as many ring nodes as possible (kL=(χ−1)/χ·
N), to have 0% autonomous control and a system with unconnected leader nodes (kL=0)
to exhibit 100% autonomous control.
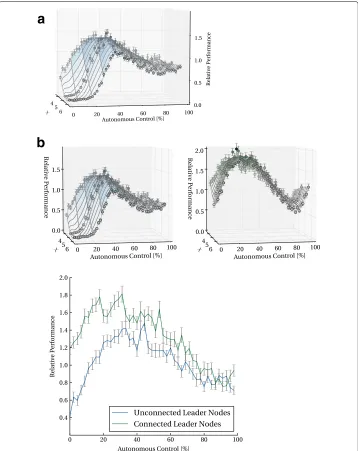
Figure2shows the main result obtained in this numerical framework. Figure2a repro-duces precisely the salient features sketched in a speculative manner in Philipp et al. (2006); Windt et al. (2008); Zambrano Rey et al. (2014): Indeed, a balance of central-ized and autonomous control leads to the highest gain in performance over the reference setting and the peak becomes more pronounced with increasing complexity of the com-putational problem (here: with an increasing chromatic number of the graph). With Fig. 2b, the numerical findings go beyond the hypotheses put forward before: For a higher level of coordination within centralized control (here: represented by the links among leader nodes) performance increases and the region of highest performance is shifted further towards centralized control (higher connectivity between leader nodes and ring nodes). The initial increase is in agreement with our intuition about the per-formance of the scheduling heuristics: An increase in centralized control increases the performance. The two counter-intuitive features of Fig.2 are the subsequent decrease of performance at even higher centralized control and the dramatic qualitative change of this behavior, as soon as the leader nodes (representing centralized control or ”upper management”) are interconnected. For visual clarity, Fig. 2bshows two representative curves (for unconnected and connected leader nodes) at fixedχ. A 2D version of Fig.2a
is available as Additional file 1, together with the corresponding figure for connected leader nodes.
Time evolution of solution regimes
Our minimal model now allows us to go beyond the mere numerical observation of these effects and to understand the underlying organizational principles in more detail. To this end, we analyze the solution domains forming over time. A solution domain is a solved region in the graph, e.g. a sequence of nodes which are all in the same solution regime (see “Methods” section).
a
b
Fig. 2Performance as a function of the level of autonomous control and the chromatic numberχ(a) for unconnected leader nodes, (b) comparison between connected and unconnected leader nodes forχ= 4
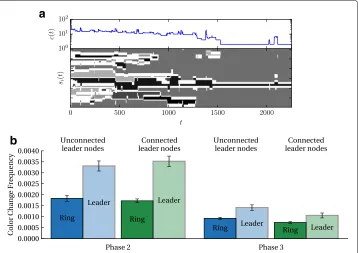
of color changes for leader nodes and ring nodes for the last two of the phases discussed above both in the case of unconnected and of connected leader nodes.
Figure3bdoes not reveal any difference between connected and unconnected leader nodes. However, in both configurations we observe systematically higher frequencies of color changes for leader nodes compared to ring nodes3. On the basis of this observation, we will now investigate the information transmission from leader nodes to ring nodes and the functional role of these high-frequency leader nodes.
a
b
Fig. 3Individual and collective node activity over time.aExemplary domain evolution along the ring-nodes, together with the evolution of conflictsc(t)in the graph (log-scale). Parameter settings are:
N=60,χ=4,s=30,kL=20 with no connection between leader nodes.bColor change frequencies over
the last two phases of the solution process. Error bars show standard error of sample mean
Figure4 reveals that connections among leader nodes enhance information transfer towards ring nodes when measured on the binary alphabet of whether a node is in a solution regimes. The communication among leader nodes consequently accelerates the process of solution regime formation and dissolution of local, globally incompatible regimes, rather than affecting the compatibilities of different solution regimes. This is confirmed by directly measuring the average number of incompatible solution regimes in both cases as well as by evaluating the information transfer on the level of colors (rather than solution regimes) (see Additional file1).
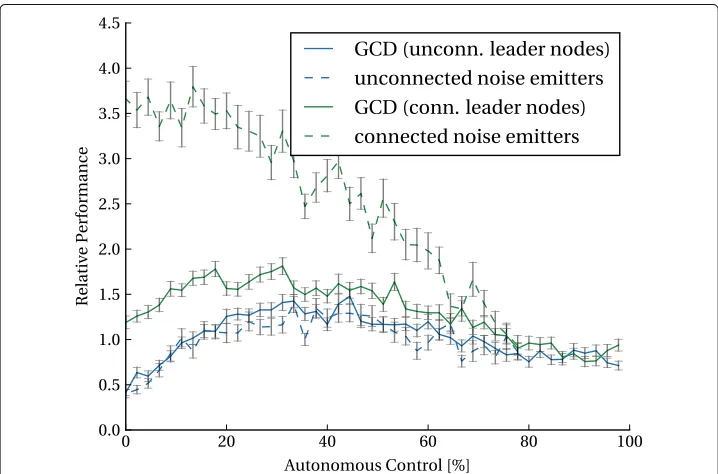
Noise-emitting leader-nodes
The high color change frequencies of leader nodes, together with the enhanced informa-tion transfer from leader nodes to ring nodes, leads to the hypothesis that color changes in leader nodes drive the solution search process in the ring. This hypothesis can be further substantiated, when discussing the leader nodes as noise emitters in the solution pro-cess that can instigate ring nodes to leave local optima, similar to a distributed simulated annealing process (cf. (Arshad and Silaghi2004)). In such metaheuristics, the probabil-ity that the search process leaves attained local minima decreases with time. The specific approach applied here is described in “Methods” section.
Fig. 4Mutual information from leader to ring nodes based on solution regimes as a function of the degree of autonomous control
The initial increase of performance with increasing degree of the leader nodes can be mimicked by substituting the leader nodes by noise sources. The rapid color fluctuations of leader nodes insert enough random information into the ring that the system moves out of regional solutions, which are globally incompatible. The frequency of color changes of the leader nodes decreases with time (and decreasing color conflicts in the system), even though the frequency is still higher than for the ring nodes. The function of leader nodes is thus reminiscent of noise in simulated annealing. Indeed, simulated annealing strategies for graph coloring have been studied in Johnson et al. (1991).
The main qualitative difference between connected and unconnected leader nodes is the decrease of the relative performance with increasing centralized control for the case of unconnected leader nodes. This decrease sets in at around 50−60% percent connectivity of leader nodes, i.e. when each ring node on average is linked to 2 or 3 leader nodes.
In this range of centralized control, coordination among leader nodes becomes vital and connections among leader nodes reduce systematically incompatible information passed on to ring nodes. In lieu of such coordination4, performance starts decreasing again,
resulting in an optimum at an intermediate level of leader node connectivity, i.e. for a balance of autonomous and centralized control.
Extension towards realistic performance indicators
As actual time does not exist in our minimal model of production, so far we cannot dis-tinguish between performance of the scheduling task and the performance of the actual production. The convergence time of the GCD process discussed so far provides only an indirect estimate of logistic performance for a version of autonomous control given a temporal pattern of jobs (represented as a conflict graph) and a set of machines.
In order to bring our model closer to reality, we will employ a ’forward model’ strategy5. The forward model applied here is described in “Methods” section. Note that the forward model investigation also does no longer depend on performance normalization through reference networks.
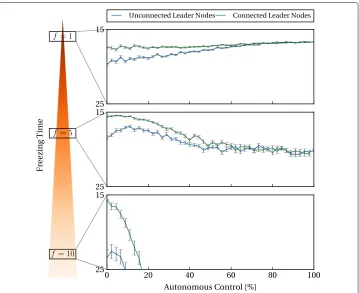
If a node did not change its color forftime steps, it is scheduled to be ’produced’ on the machine represented by its current color. We callf the ’freezing parameter’. Looking at the performance as a function off provides qualitative insight into properties of generic scheduling paradigms: At lowf the scheduling becomes practically random. At very high f, the scheduling requires essentially a fully solved graph with all nodes of the same color being transferred to the corresponding machine almost simultaneously, which again leads to long queues.
The intermediate regime off allows us to evaluate how the features of the GCD suc-cessfully translate into scheduling and production. An example of such a feature is the competition between locally established solution regimes. Figure6shows the throughput time as a function of the leader node degree, both for unconnected leader nodes, suc-cessfully reproducing the results from Fig.2. Varyingf, reveals an interesting shift in peak performance as a function off: For low values off, lowkLattains maximum performance,
whereas higher degrees of hierarchical control seem more desirable for long ’freezing times’. Hence, our model provides quantitative evidence for the previously only hypothe-sized (Trentesaux2009) understanding that decentralized production control structures are better in situations where scheduling decisions have to be made quickly, whereas more hierarchical structures perform better, when more time is available for the individual decision process.
Discussion
Within the debate of autonomous control, very few reliable, quantitative facts have emerged from the diverse research directions in algorithmics (Yokoo and Hirayama
Fig. 6Makespan of the scheduling problem as a function of the level of autonomous control and freezing time. Makespan is shown ony-axis, inverted to reflect notion of performance.n=60,χ=4,s=30
provide some helpful hints towards understanding autonomous control (Windt and Hütt
2010). Here we provide a detailed model study, how the balance of centralized and autonomous control can affect the performance of scheduling and production processes. In our abstract representations of production systems, we find the highest performance at intermediate levels of autonomous control. However, the details matter: (1) The graph’s chromatic number regulates the size and shape of this performance peak, (2) connections among leader nodes (i.e. a high level of communication among the agents of centralized control) lead to a strong increase in performance and a shift of maximal performance towards high centralized control. In order to evaluate the relevance of these results for real life applications, we extend the generic framework of GCD to realistic logistic performance indicators (via a forward model extending GCD into the production realm). Some basic rules of organizing a production process can be derived from the generic findings presented here: (1) Identifying the links between leader nodes with com-munication in upper management, we see that centralized control that includes such communication outperforms autonomous control alternatives. (2) The chromatic num-ber of a production network or a time pattern of orders can be a useful heuristic indicator of the problem complexity and thus indirectly of the expected logistics performance. (3) Often, a mixture of centralized and autonomous control will lead to the highest logistic performance.
comprising the system. Here, our leader nodes are part of the system and are only struc-turally prepared to serve as central authorities. We expected the color dynamics to organize into an information flow, where essentially the leader nodes settle into conflict-free states and then impose compatible states on the ring nodes (thus enslaving the ring nodes and turning into central authorities in the common sense). In contrast, we observe that the self-organized color dynamics turn the ’leader nodes’ into noise sources and that this functional role facilitates the convergence towards a conflict-free state.
Among the many possible directions into which this analysis can be extended, three seem most promising.
First, the interplay of performance, balance of centralized and autonomous control and network architecture can be explored. Network science has put forward a huge number of topological identifiers influencing how dynamical processes organize on such networks6. Such network properties may also affect the performance resulting from a certain bal-ance of centralized and autonomous control. An additional important question is whether more general network architectures can be associated with the control paradigms dis-cussed here. A detailed analysis of GCD on scalefree graphs (or, in general, graphs with a broad degree distribution) could reveal, whether such categories of nodes (i.e. hubs serv-ing as leader nodes controllserv-ing a large number of low-degree ’rserv-ing’ nodes) emerge under these dynamics.
Second, with the forward model as an interface to real life performance indicators, the development of a novel scheduling tool based on GCD could be envisioned. To this end, extending the work from Hadzhiev et al. (2009) the specific algorithm of GCD (the update scheme and the neighborhood evaluation rule) and its impact on the relationship between performance and control need to be further understood.
Third, the role of information quality in GCD deserves a closer look. Qualitatively speaking, with GCD we see a minimal model implementation of the information mis-match problem mentioned in the Introduction: The incongruous information provided to ring nodes by leader nodes leads to a decrease of performance with increasing central-ized control. This aspect deserves a much more detailed analysis in future investigations, distinguishing between three types of information errors: (1) erroneous status percep-tion, (2) time delay of status perceppercep-tion, and (3) true color errors (random color changes). With the distinction of leader nodes and ring nodes in mind, one can also distinguish between status information errors (management is not properly informed) and decision information errors (management does not inform properly).
Conclusion
The empirical investigation of graph coloring dynamics (Kearns et al. 2006) was an early example of a ’virtual lab’ experiment to understand collective problem solving. In (Hadzhiev et al.2009) cellular automata-like update rules have been developed for the purpose of explaining the counterintuitive findings from Kearns et al. (2006).
Here we argue that the process of graph coloring dynamics, together with the formal representation via cellular automata from Hadzhiev et al. (2009) , can serve as a test sce-nario for understanding performance under variation of the balance between centralized and autonomous control.
In Shore et al. (2015) the dependence of the problem solving perfomance on network architecture has been studied in more detail. Recently, in Becker et al. (2017) the impact of social networks on the quality of a collective estimation challenge has been analyzed. In contract to the wide range of studies, where comparatively simple tasks are employed, team performance as a function of team size has recently been studied for a complex task (’crisis mapping’, which requires to organize incoming information about crisis events in real time), in order to understand the balance of loss by reduced individual efforts and gain by collaboration (Mao et al.2016).
How models from statistical physics can be employed to understand some ’stylized facts’ about human cooperation and the associated distributed decisions is discussed in (Perc et al.2017).
Recently, the work by Kearns et al. (2006) was extended towards a large-scale ’virtual lab’ experiment, where in addition to human subjects noisy bots (i.e., network nodes controlled by error-prone machines) work included (Shirado and Christakis2017). The main result was that moderately noisy bots placed in central positions in the network help solve locally unresolvable color conflicts and thus improve global coordination (Shirado and Christakis2017); see also Gächter (2017). Our numerical results are in line with this observation: The leader nodes in our setup introduce noise enabling ring nodes to consolidate globally incompatible regions of local solutions. Our investigation, how-ever, additionally points to the fact that coordination of the ’noise sources’ (i.e., the leader nodes) is of relevance for the global performance.
Materials & methods GCD model
We use Graph Coloring Dynamics (GCD), the agent-based version of the well-studied graph coloring problem. In this setting,Nagents play on a network, seeking to choose a color (state)xsuch that no neighboring agent has the same color. The number of available colors (the size of the action spaceC is limited to χ, the graphs chromatic number. While GCD has been applied to investigate problems of packet switching in shared radio channels (Yeo et al.2002) and register allocation problems (Smith et al.2004) and we have previously laid out is applicability to study the effect changing environmental conditions on distributed production planning systems (Windt and Hütt2010).
The time evolution of the color state vector
x(t)=x1(t),x2(t),. . .,xn(t),y1(t),y2(t),. . .,yχ(t)
(1)
(where xi(t) andyi(t) indicate the color of ring-nodes leader nodes respectively at t) is generated like the update for a stochastic cellular automaton with asynchronous update. The time evolution requires the specification of two elements: the update scheme (indicating the order, in which nodes are scheduled for update) and the neighborhood evaluation rule (indicating how the new colorxi(t+1)is computed fromxi(t)and the corresponding neighboring nodes.
the proportion of ’strategic waiting’ in this scheme. Regarding attention waves, we run a simple dynamical process of discrete excitable dynamics (operating on a state space
E = {S,E,R}, denoting susceptible, excited and refractory nodes, respectively, where nodes go from excited to refractory (E→R) at each time step, go from refractory to sus-ceptible (R→S) after a fixed refractory period of two time steps and go from susceptible to excited (S → E), when there is an excitation in the direct neighborhood. Addition-ally, there is a small probability (f=0.05) for spontaneous excitations (S → E). At each moment in time, color updates are performed on all excited nodes, thus organizing the color updates to follow ’attention waves’ running through the graph based on the excitable dynamics. Such discrete excitable dynamics on graphs have been studied for example in Müller-Linow et al. (2008b); Garcia et al. (2012); Messé et al. (2018).
Networks
We build upon the investigation and rule space characterization in Hadzhiev et al. (2009). In particular, we focus on strategies featuring ’attention waves’ (the passing of ability to change color along network edges) and ’strategic waiting’ (the tendency to remain with the current color if it is the sole conflict minimizing color), that have shown to cope well with increasing complexity.
Following the setup in Kearns et al. (2006), we define a ring-graph of N nodes to form the underlying network. Every ring node is connected to its(χ −1)neighbors on either side, enforcing a chromatic number ofχ. A total ofsshortcuts is added between ring nodes at random, though maintainingχ-colorability (i.e. when node numbersiare mapped to modulo classes with respect toχ,a(i) = imodχ, then a shortcut between nodesiandjis allowed ifa(i) =a(j)). Finally, we addχ“leader-nodes” to the network, that are connected to the underlying ring graph throughkL links each. We will use the
parameterkL to adjust the leader-nodes’ impact on the underlying graph. The resulting
networks are defined by the tupleG = G(N,l,c,χ,s,kL,h)7. Typical choices for these
parameters areN=60,l=0 (no leader nodes) orl=χ(one leader node per color) and c=χ−1.
Assessment of performance
A key result of our investigation is the change of performance with the number of leader node links. Performance of graphs with leader nodes is defined as the number of color changes required for solving a graph, compared to a graph without leader nodes, which has the same total number of nodes and non-ring links. Let rC(G) denote the
aver-age number of color changes required for solving graph G(with averages performed over many initial color configurations). For graphs with unconnected leader nodes, the performancePcan be expressed as8
P(G)=
rC(G(N,χ,χ−1,χ,s,kL, 0))
rC(G(N+χ, 0,χ−1,χ,s+χkL, 0, 0)) −1
. (2)
A performance ofP>1 means that the graph with leader nodes has been solved with fewer color changes than a reference graph with the same number of nodes and links. The arrangement ofχkLlinks as leader node links (implementing a form of hierarchical,
We quantify the performance via this comparison to a reference graph, in oder to elim-inate the potential dependence of the runtime (or number of comor changes) on the average node degree (which changes with increasing centralized control).
Information flow
Time-delayed mutual information is an established measure to assess the flow of infor-mation between a sender and a receiver (Kirst et al.2016). Networks are set up such that the coordination numbercof the initial ring determines the network’s chromatic number, c=χ−1 (i.e. each node is linked to itsχ−1 neighbors in both directions).
As a consequence, out of theχn+χpossible graph state vectors, expressing the color of each ring and leader node as a vector component, only those states are feasible solutions, where the sequence of colors of anyχ neighboring ring nodes or the leader nodes is a permutation ofC. From theχ! possible permutations, only(χ −1)! are distinct in that they are not circular permutations of each other, i.e. do not correspond to different ’reading frames’. We call these(χ−1)! permutations “solution regimes” and their setS(0).
(0)
S =
σ1,σ2, ...,σ(χ−1)!
.
The graph is solved if and only if all nodes are assigned to the same solution regime. In this investigation, we are interested in the binary indicator, if a node is part of a solution regime. A nodeiis considered to be in a solution regime at timetif and only if the sequence of colors
xi(t),xi+1(t), ...,xi+(χ−1)(t)
corresponds to a solution inS(0). In this case, we setsi(t)=1. If a color conflict appears in this sequence,si(t)=0.
This framework can now be used to compute the information transfer from, e.g., leader nodes to ring nodes. Leti be a leader node andja ring node connected toi. At each time pointt, the pair{si(t),sj(t)}can be computed. On a time window [t,t+T] pair probabilitiespcs(c,s ∈ C), can be estimated, which in turn allow the computation of a mutual information as a measure for the information transfer from leader nodeito ring nodej:
m=
c∈C,s∈S
pcslog
pcs
pcps
. (3)
wherepcandpsdenote the probabilities of statescin time seriessiandsin time seriessj,
respectively.
Simulated annealing model
excited and may change its color individually, whereas connected leader nodes in this model consider and decide collectively, acting on a wider decision space of all possible solution regimes (C =S(0)).
Forward model
Up to now, the performance analyzed has been an abstract statistical feature, measuring whether the network can be solved with fewer color changes, if the links are arranged according to a centralized control paradigm, rather than a random arrangement. Now we will augment our graph coloring dynamics scheme by a production module, which works along the following set of rules: To assess solutions in terms of schedule quality (rather than just the speed of the solution process), we add a time component to our model: One simulation time unit equalsN rounds of the GCD-algorithm. Scheduling is attained as follows:
1 A ring-node (job) that has not changed its color during the previousf time steps will be passed to the machine corresponding to its current color for processing. 2 A node processed in this way will be removed from the graph, i.e. will not be
updated or influence the color changing decisions of its neighbors any more. 3 Machines need 1 time step for the processing/production of a job. Additional jobs
being queued at that machine during this production time will be delayed accordingly. Jobs are processed one at a time in the sequence of assignment.
Once all nodes (jobs) are transferred into the production process in this way, the total throughput time (i.e. the time until all jobs have been successfully processed) is computed and used as a performance indicator.
The time span between the start time of the first and end time of the last operation (in simulation time units) is considered the makespan of the schedule.
Endnotes
1For ER graphs the diameter scales with logN (Albert and Barabási 2002), for BA
scalefree graphs the diameter scales with log logN(Cohen and Havlin2003).
2We claim that the chromatic number is an apt handle to change the problem’s
complexity.
3A naive interpretation of Fig. 2, where connected leader nodes settle first into a
conflict-free phase and then force this solution regime upon the rest of the graph, would have led to a much lower frequency of color changes for connected leader nodes, particularly in the later phases.
4i.e., for unconnected leader nodes.
5See Stephan et al. (2008) for an example from computational neuroscience, where a
comparison of experimental data and a stylized model of neuronal excitations is achieved by formulating a model acting upon the simulation results and translating them into a data set with similar statistical features as empirical observations.
6Examples include modularity, degree correlations, hierarchy and non-random
sub-graph compositions.
7withN, the number of ring nodes;l, the number of leader nodes;c, the coordination
ring;kLthe degree of the leader nodes and the binary variablehindicating, if the leader
nodes form a complete network amongst each other
8In the case of interconnected leader nodes, the reference graph would be G(N +
χ, 0,χ,χ,s+χkL+χ(χ−1)/2, 0, 0).
Additional file
Additional file 1:As supporting information this file contains a more detailed description of the methods and additional numerical investigations. (PDF 894 kb)
Acknowledgements
We thank Katja Windt for her support of the development of the idea to use GCD to model scheduling processes.
Authors’ contributions
HB implemented the model and all analyses. DA, JB, and MH developed the forward model and simulated annealing idea. JB and MH wrote the main manuscript. All authors reviewed the manuscript. HB prepared the manuscript for submission. All authors read and approved the final manuscript.
Competing interests
The authors declare that they have no competing interests.
Publisher’s Note
Springer Nature remains neutral with regard to jurisdictional claims in published maps and institutional affiliations.
Author details
1RWTH Aachen University, School of Management & Economics, Kackertstr. 8, 52062 Aachen, Germany.2School of
Mathematical and Statistical Sciences, Arizona State University, 85287-1804 Tempe, AZ, USA.3Jacobs University Bremen, Campus Ring 1, 28759 Bremen, Germany.
Received: 4 March 2018 Accepted: 13 June 2018
References
Albert R, Barabási A-L (2002) Statistical mechanics of complex networks. Rev Mod Phys 74:47–97.https://doi.org/10.1103/ RevModPhys.74.47
Arshad M, Silaghi MC (2004) Distributed simulated annealing. In: Zhang W, Sorge V (eds). Distributed Constraint Problem Solving and Reasoning in Multi-Agent Systems. 112. STM Publishing House, Amsterdam
Becker T, Beber ME, Windt K, Hütt M-T, Helbing D (2011) Flow control by periodic devices: a unifying language for the description of traffic, production, and metabolic systems. J Stat Mech Theory Exp 2011(05):05004.https://doi.org/10. 1088/1742-5468/2011/05/P05004
Becker J, Brackbill D, Centola D (2017) Network dynamics of social influence in the wisdom of crowds. Proc Natl Acad Sci 201615978
Bikhchandani S, Hirshleifer D, Welch I (1992) A theory of fads, fashion, custom, and cultural change as informational cascades. J Polit Econ 100(5):992–1026
Bornholdt S (2005) Less is more in modeling large genetic networks. Science 310(5747):449–451.https://doi.org/10.1126/ science.1119959.http://www.sciencemag.org/content/310/5747/449.full.pdf
Cohen R, Havlin S (2003) Scale-free networks are ultrasmall. Phys Rev Lett 90:058701.https://doi.org/10.1103/ PhysRevLett.90.058701
de Menezes MA, Barabási A-L (2004) Fluctuations in network dynamics. Phys Rev Lett 92:028701.https://doi.org/10.1103/ PhysRevLett.92.028701
De Werra D, Hertz A (2015) Chromatic scheduling. In: Beineke LW, Wilson RJ (eds). Topics in Chromatic Graph Theory. Encyclopedia of Mathematics and Its Applications, vol. 156, eds. Cambridge University Press. pp 255–276. Chap. 12. https://doi.org/10.1017/CBO9781139519793.015
Drossel B, Schwabl F (1992) Self-organized critical forest-fire model. Phys Rev Lett 69:1629–1632.https://doi.org/10.1103/ PhysRevLett.69.1629
Duffie NA (2008) Challenges in design of heterarchical controls for dynamic logistic systems. In: Dynamics in Logistics. Springer, Berlin. pp 3–24
Duffie N, Fenske J, Vadali M (2013) Coordination of capacity adjustment modes in work systems with autonomous wip regulation. In: Robust Manufacturing Control. Springer, Berlin. pp 135–145
Fabiunke M (1999) Parallel distributed constraint satisfaction. In: Proceedings of the International Conference on Parallel and Distributed Processing Techniques and Applications, PDPTA 1999. CSREA Press. pp 1585–1591.http://citeseerx. ist.psu.edu/viewdoc/download?doi=10.1.1.40.4233&rep=rep1&type=pdf
Fraigniaud P, Gavoille C, Ilcinkas D, Pelc A (2007) Distributed computing with advice: Information sensitivity of graph coloring. In: Arge L, Cachin C, Jurdzi ´nski T, Tarlecki A (eds). Automata, Languages and Programming. Lecture Notes in Computer Science, vol. 4596. Springer. pp 231–242.https://doi.org/10.1007/978-3-540-73420-8_22
Gächter S (2017) Behavioural economics: Occasional errors can benefit coordination. Nature 545(7654):297–298 Graham I, Matthai CC (2003) Investigation of the forest-fire model on a small-world network. Phys Rev E 68:036109.
https://doi.org/10.1103/PhysRevE.68.036109
Hadzhiev B, Windt K, Bergholz W, Hütt M-T (2009) A model of graph coloring dynamics with attention waves and strategic waiting. Adv Complex Syst 12(6):549–564.https://doi.org/10.1142/S0219525909002386
Halldórsson MM, Kortsarz G, Shachnai H (2003) Sum coloring interval and k-claw free graphs with application to scheduling dependent jobs. Algorithmica 37:187–209.https://doi.org/10.1007/s00453-003-1031-8
Helbing D, Deutsch A, Diez S, Peters K, Kalaidzidis Y, Padberg-Gehle K, Lämmer S, Johansson A, Breier G, Schulze F, Zerial M (2009) Biologistics and the struggle for efficicency: Concepts and perspectives. Adv Complex Syst 12(6):533–548. https://doi.org/10.1142/S0219525909002374
Hernando L, Mendiburu A, Lozano JA (2016) A tunable generator of instances of permutation-based combinatorial optimization problems. IEEE Trans Evol Comput 20(2):165–179.https://doi.org/10.1109/TEVC.2015.2433680 Hongler M-O, Gallay O, Hülsmann M, Cordes P, Colmorn R (2010) Centralized versus decentralized control—a solvable
stylized model in transportation. Physica A: Stat Mech Appl 389(19):4162–4171
Johnson DS, Aragon CR, McGeoch LA, Schevon C (1991) Optimization by simulated annealing: An experimental investigation; part ii, graph coloring and number partitioning. Oper Res 39(3):378–406.https://doi.org/10.1287/opre. 39.3.378
Karp RM (1972) Reducibility among combinatorial problems. In: Miller RE, Thatcher JW, Bohlinger JD (eds). Complexity of Computer Computations. The IBM Research Symposia Series. Springer. pp 85–103. https://doi.org/10.1007/978-1-4684-2001-2_9
Kearns M, Suri S, Montfort N (2006) An experimental study of the coloring problem on human subject networks. Science 313(5788):824–827.https://doi.org/10.1126/science.1127207.
http://www.sciencemag.org/content/313/5788/824.full.pdf
Kirst C, Timme M, Battaglia D (2016) Dynamic information routing in complex networks. Nat Commun 7:11061.https:// doi.org/10.1038/ncomms11061
Lämmer S, Helbing D (2008) Self-control of traffic lights and vehicle flows in urban road networks. J Stat Mech Theory Exp 2008(04):04019.https://doi.org/10.1088/1742-5468/2008/04/P04019
Mao A, Mason W, Suri S, Watts DJ (2016) An experimental study of team size and performance on a complex task. PloS ONE 11(4):0153048
Marr C, Hütt M-T (2006) Similar impact of topological and dynamic noise on complex patterns. Phys Lett A 349(5):302–305.https://doi.org/10.1016/j.physleta.2005.08.096
Marr C, Hütt M-T (2009) Outer-totalistic cellular automata on graphs. Phys Lett A 373(5):546–549.https://doi.org/10.1016/ j.physleta.2008.12.013
Marx D (2004) Graph coloring problems and their applications in scheduling. Period Polytech Electrial Eng 48(1-2):11–16 Matous P, Todo Y (2017) Analyzing the coevolution of interorganizational networks and organizational performance:
Automakers’ production networks in japan. Appl Netw Sci 2(1):5
Messé A, Hütt M-T, Hilgetag CC (2018) Toward a theory of coactivation patterns in excitable neural networks. PLoS Comput Biol 14(4):1006084
Meyer M, Hütt M-T, Bendul JC (2015) The elementary flux modes of a manufacturing system: a novel approach to explore the relationship of network structure and function. Int J Prod Res 16.https://doi.org/10.1080/00207543.2015.1106612. http://www.tandfonline.com/doi/pdf/10.1080/00207543.2015.1106612
Moreira AA, Mathur A, Diermeier D, Amaral LA (2004a) Efficient system-wide coordination in noisy environments. Proc Natl Acad Sci U S A 101(33):12085–12090
Moreira AA, Mathur A, Diermeier D, Amaral LAN (2004b) Efficient system-wide coordination in noisy environments. Proc Natl Acad Sci U S A 101(33):12085–12090.https://doi.org/10.1073/pnas.0400672101.
http://www.pnas.org/content/101/33/12085.full.pdf+html
Mott KA, Peak D (2006) Stomatal patchiness and task-performing networks. Ann Bot 99(2):219–226.https://doi.org/10. 1093/aob/mcl234
Moussaïd M, Helbing D, Theraulaz G (2011) How simple rules determine pedestrian behavior and crowd disasters. Proc Natl Acad Sci 108(17):6884–6888.https://doi.org/10.1073/pnas.1016507108.
http://www.pnas.org/content/108/17/6884.full.pdf+html
Mula J, Poler R, García-Sabater JP, Lario FC (2006) Models for production planning under uncertainty: A review. Int J Prod Econ 103(1):271–285.https://doi.org/10.1016/j.ijpe.2005.09.001
Müller-Linow M, Hilgetag CC, Hütt M-T (2008a) Organization of excitable dynamics in hierarchical biological networks. PLoS Comput Biol 4(9):1000190.https://doi.org/10.1371/journal.pcbi.1000190
Müller-Linow M, Hilgetag CC, Hütt M-T (2008b) Organization of excitable dynamics in hierarchical biological networks. PLoS Comput Biol 4(9):1000190
Myszkowski PB (2008) Solving scheduling problems by evolutionary algorithms for graph coloring problem. In: Xhafa F, Abraham A (eds). Metaheuristics for Scheduling in Industrial and Manufacturing Applications. Studies in
Computational Intelligence, vol. 128. Springer. pp 145–167.https://doi.org/10.1007/978-3-540-78985-7_7 Naor M, Stockmeyer L (1995) What can be computed locally?. SIAM J Comput 24(6):1259–1277.https://doi.org/10.1137/
S0097539793254571.http://dx.doi.org/10.1137/S0097539793254571
Pardalos PM, Mavridou T, Xue J (1999) The graph coloring problem: A bibliographic survey. In: Du D-Z, Pardalos P (eds). Handbook of Combinatorial Optimization. Springer. pp 1077–1141.https://doi.org/10.1007/978-1-4613-0303-9_16 Peak D, West JD, Messinger SM, Mott KA (2004) Evidence for complex, collective dynamics and emergent, distributed
computation in plants. Proc Natl Acad Sci U S A 101(4):918–922.https://doi.org/10.1073/pnas.0307811100. http://www.pnas.org/content/101/4/918.full.pdf
Perc M, Jordan JJ, Rand DG, Wang Z, Boccaletti S, Szolnoki A (2017) Statistical physics of human cooperation. Phys Rep 687(2017):1–51
Philipp T, Böse F, Windt K (2006) Evaluation of autonomously controlled logistic processes. In: Proceedings of 5th CIRP International Seminar on Intelligent Computation in Manufacturing Engineering. CIRP, The International Academy for Production Engineering, Ischia. pp 347–352.https://www.journals.elsevier.com/procediacirp/
Pinedo ML (2012) Scheduling: Theory, Algorithms, and Systems. Springer, Berlin. https://doi.org/10.1007/978-1-4614-2361-4
Rosvall M, Trusina A, Minnhagen P, Sneppen K (2005) Networks and cities: An information perspective. Phys Rev Lett 94(2):028701
Sales-Pardo M, Diermeier D, Amaral LAN (2013) The impact of individual biases on consensus formation. PloS ONE 8(5):58989.https://doi.org/10.1371/journal.pone.0058989
Scholz-Reiter B, Frazzon EM, Makuschewitz T (2010) Integrating manufacturing and logistic systems along global supply chains. CIRP J Manuf Sci Technol 2(3):216–223
Scholz-Reiter B, Freitag M (2007) Autonomous processes in assembly systems. CIRP Ann - Manuf Technol 56(2):712–729. https://doi.org/10.1016/j.cirp.2007.10.002
Scholz-Reiter B, Freitag M, de Beer C, Jagalski T (2005) Modelling dynamics of autonomous logistic processes: Discrete-event versus continuous approaches. CIRP Ann - Manuf Technol 54(1):413–416.https://doi.org/10.1016/ S0007-8506(07)60134-6
Scholz-Reiter B, Görges M, Philipp T (2009) Autonomously controlled production systems - influence of autonomous control level on logistic performance. CIRP Ann - Manuf Technol 58(1):395–398.https://doi.org/10.1016/j.cirp.2009.03. 011
Schreyögg G, Sydow J (2010) Crossroads – organizing for fluidity? dilemmas of new organizational forms. Organ Sci 21(6):1251–1262.https://doi.org/10.1287/orsc.1100.0561.
http://pubsonline.informs.org/doi/pdf/10.1287/orsc.1100.0561
Schuh G, Potente T, Varandani R, Hausberg C, Fränken B (2014) Collaboration moves productivity to the next level. Procedia CIRP 17:3–8
Shirado H, Christakis NA (2017) Locally noisy autonomous agents improve global human coordination in network experiments. Nature 545(7654):370–374
Shore J, Bernstein E, Lazer D (2015) Facts and figuring: An experimental investigation of network structure and performance in information and solution spaces. Organ Sci 26(5):1432–1446
Smith MD, Ramsey N, Holloway G (2004) A generalized algorithm for graph-coloring register allocation, vol. 39. ACM, New York. pp 277–288.https://doi.org/10.1145/996893.996875.http://doi.acm.org/10.1145/996893.996875
Stephan KE, Kasper L, Harrison LM, Daunizeau J, den Ouden HEM, Breakspear M, Friston KJ (2008) Nonlinear dynamic causal models for fmri. NeuroImage 42(2):649–662.https://doi.org/10.1016/j.neuroimage.2008.04.262
Tang Y, Gao H, Kurths J (2014) Distributed robust synchronization of dynamical networks with stochastic coupling. Circ Syst I Regular Papers, IEEE Trans 61(5):1508–1519.https://doi.org/10.1109/TCSI.2013.2285699
Trentesaux D (2009) Distributed control of production systems. Eng Appl Artif Intell 22(7):971–978.https://doi.org/10. 1016/j.engappai.2009.05.001. Distributed Control of Production Systems
Vázquez A, Pastor-Satorras R, Vespignani A (2002) Large-scale topological and dynamical properties of the internet. Physical Review E 65(6):066130
Watts DJ (2002) A simple model of global cascades on random networks. Proc Natl Acad Sci 99(9):5766–5771.https://doi. org/10.1073/pnas.082090499.http://www.pnas.org/content/99/9/5766.full.pdf+html
Watts DJ, Strogatz SH (1998) Collective dynamics of ’small-world’ networks. Nature 393(6684):440–442.https://doi.org/10. 1038/30918
Windt K, Böse F, Philipp T (2008) Autonomy in production logistics: Identification, characterisation and application. Robot Comput Integr Manuf 24(4):572–578.https://doi.org/10.1016/j.rcim.2007.07.008. ICMR2005: Third International Conference on Manufacturing Research
Windt K, Hütt M-T (2010) Graph coloring dynamics: A simple model scenario for distributed decisions in production logistics. CIRP Ann - Manuf Technol 59(1):461–464.https://doi.org/10.1016/j.cirp.2010.03.082
Wolfram S (1984) Cellular automata as models of complexity. Nature 311(5985):419–424.https://doi.org/10.1038/ 311419a0
Yang S, Ong Y-S, Jin Y (eds) (2007) Evolutionary Computation in Dynamic and Uncertain Environments. Springer.https:// doi.org/10.1007/978-3-540-49774-5
Yeo J, Lee H, Kim S (2002) An efficient broadcast scheduling algorithm for tdma ad-hoc networks. Comput Oper Res 29(13):1793–1806.https://doi.org/10.1016/S0305-0548(01)00057-0
Yokoo M, Hirayama K (1996) Distributed breakout algorithm for solving distributed constraint satisfaction problems. In: Proceedings of the Second International Conference on Multi-Agent Systems. pp 401–408.http://citeseerx.ist.psu. edu/viewdoc/summary?doi=10.1.1.21.65