A RT I C L E
Published online: 23 February 2016
© The Author(s) 2016. This article is published with open access at Springerlink.com
The O*NET content model: strengths and limitations
Michael J. Handel1
und repräsentativen Befragungen von Beschäftigten. Die substanzielle Reichweite und Zusammensetzung des
Datensatzes ist beeindruckend, auch wenn er signifikante
Lücken und Dopplungen enthält. Die zugrunde liegenden Konstrukte, Frageformulierungen und Antwortmöglich-keiten sind vielfach vage und allzu komplex. Gleichwohl bestehen zwischen den Items in O*NET und den Löhnen im Allgemeinen merkliche Korrelationen. In Verbindung mit der großen Reichweite des Datensatzes bietet dies die Gewähr dafür, dass O*NET ein hoher Stellenwert in der Arbeitsmarkt- und Berufsforschung zukommt.
As the papers in this volume attest, measuring job skill requirements and related job characteristics has always been challenging. One of the earliest and best known sources of direct measures is the Dictionary of Occupational Titles (DOT), a government reference publication produced by the United States Department of Labor’s Employment and Training Administration (ETA). ETA has replaced the DOT with the Occupational Information Network (O*NET), which has attracted growing interest but is much less well-known than the DOT. O*NET represents an impressive
effort to develop a systematic body of information on occu -pational characteristics. O*NET has been used in academic studies (e.g., Feser 2003; Hirsch 2005; Krueger and Sch-kade 2007), and it is likely that interest in O*NET among social scientists studying work and employment will grow, so some understanding of its characteristics as a source of social science data is useful.
The project’s principals have published extensive evalu-ations of the pretest (Peterson et al. 1999; Peterson et al. 2001), but the other background reports and documentation from the O*NET project are somewhat fragmented and the existing record contains notable gaps. There is no published, Michael J. Handel
1 Department of Sociology, Northeastern University,
539 Holmes Hall, 02115 Boston, MA, USA
Abstract This paper describes the Occupational Informa-tion Network (O*NET), a relatively recent database con-taining measures of occupational characteristics produced by the United States Department of Labor as a replace-ment for the Dictionary of Occupational Titles. O*NET scores cover cognitive, interpersonal, and physical skill requirements, as well as working conditions, and are de-rived mostly from survey responses of large, representa-tive samples of workers. O*NET’s substanrepresenta-tive scope and
sampling are impressive, but there are also significant gaps
and duplication in content. Underlying constructs, item wording, and response options are often vague or overly complex. However, O*NET items have generally sensible correlations with wages, which, along with the richness of the database, ensure O*NET’s place among researchers in-terested in work and labour markets.
Stärken und Grenzen des O*NET-Models
Zusammenfassung Dieser Artikel beschreibt das Oc-cupational Information Network (O*NET), einen relativ neuen Datensatz des amerikanischen Arbeitsministeriums,
A large set of measures assessed job requirements in terms of the aptitudes (e.g., manual dexterity), tempera-ments (e.g., directing others), interests (e.g., artistic), physi-cal demands (e.g., lifting) and environmental conditions (e.g., exposure to chemicals).
The data contained in the DOT was collected by trained
job analysts in ETA field offices across the United States
based on their observations and interviews at selected job sites. Job analysts visited workplaces on a continuous basis and each new edition of the DOT replaced existing scores with the new scores collected in the intervening period.
Although the DOT was devised primarily to serve practi-cal purposes, social scientists began using the data in the 1960s (Miller et al. 1980, p. 7). Social science use of the DOT grew after Spenner’s (1979) seminal work and the large-scale evaluation of the DOT by Miller et al. (1980) sponsored by the National Academy of Sciences, which
resulted in the first widely available machine-readable data files with DOT scores linked to standard U.S. Cen -sus occupation codes. The crosswalk of more than 12,000 DOT occupation codes to the much smaller set of
approxi-mately 450 Census occupation codes permitted researchers
to merge DOT scores with standard labour force surveys. Nevertheless, the DOT was devised by applied psycholo-gists and practitioners for career counselling, not social science research, and the evaluation by Miller et al. (1980) raised a number of questions regarding the quality of the data. They found the DOT over-represented blue-collar manufacturing jobs, the jobs rated were a convenience sample rather than a probability sample, and most ratings in the fourth edition (1977) were simply carried from previ-ous editions, often dating to the 1950s and 1960s without necessarily reevaluating them thoroughly because the scale
of the required field visits proved prohibitively time-con -suming and costly. Others noted that the DOT scores are occupation averages, which means the measures contain no within-occupation variation (Miller et al. 1980; Attewell 1990; Spenner 1990; Vallas 1990; U.S. Department of Labor 1993, p. 20).
Although some research shows DOT measures perform better than some of the critics suggest (Kohn and Schooler 1983; Handel 2000), the age of the DOT data, nature of the sample, and quality of the measures argued for new and better information on skill requirements and other job characteristics.
2 The development of occupational information network (O*NET)
Responding to methodological criticisms of the DOT and the costs of in-person job analysis, the Advisory Panel for the Dic-tionary of Occupational Titles (APDOT) was created in 1990 independent evaluation of O*NET comparable to Miller et
al. ’s (1980) work on the DOT. This paper synthesizes exist-ing published and informally collected information to give researchers an introduction to O*NET. The paper discusses some of O*NET’s conceptual strengths and limitations, and presents some empirical analyses of the database’s proper-ties to illuminate these issues.
The first section provides a brief description of the
DOT as background because its limitations provided the motivation for O*NET. The second section gives a brief description of the development of O*NET. The third sec-tion describes the structure of the database and the data col-lection process. The fourth section discusses some general
issues related to O*NET content. The fifth section provides
a more detailed evaluation of the measurement properties
of O*NET items and scales. A final section presents some
concluding observations.
1 Background: the dictionary of occupational titles
The first edition of the Dictionary of Occupational Titles
(DOT) was published by the U.S. Department of Labor in 1939 to assist the Employment Service in matching job-seek-ers to vacant positions during the Depression. Subsequent edi-tions of the DOT appeared in 1949, 1965, and 1977. In 1991 a
partial revision of the fourth edition appeared as the final DOT
database. In addition to helping the United States
Employ-ment Service find jobs for the unemployed, the DOT was also
intended as a source of occupational information for career counsellors and students interested in understanding education
and training requirements and other demands of different jobs. In her introduction to the final edition of the DOT, the Secre -tary of Labor, Lynn Martin, noted that it “appears at a time when there is growing recognition of the need for lifetime learning [and] when rapid technological change is making the jobs of current workers more complex than they were even a few years ago…” (United States Department of Labor 1991, p. iii). These sentiments are still relevant today; indeed, they have been voiced continuously in the subsequent two decades.
In addition to narrative job descriptions, the principal content of the DOT is various measures of job skill require-ments and other important job characteristics for over 12,000
specific job titles. The DOT rated the level of General Edu
-cational Development (GED) and Specific Vo-cational Prepa
-ration (SVP), or job-specific training, required by jobs.
programs, and voluntary industry skills standards, as well as the traditional functions of the employment service (U.S. Department of Labor 1993, p. 18, 26 f., 38; Peterson et al. 1999, pp. 9 ff., 300).
The final APDOT report called for new measures that are
“accurate, reliable, and valid” and could serve as a basis for rating both job demands and worker abilities in order to improve person-job matching and help policy makers esti-mate future skill needs more accurately (U.S. Department of Labor 1993, p. 7, 14, 17, 20, 31). It was hoped that the use of survey self-reports would permit ratings to be updated on a regular basis. To facilitate this process, the new system would aggregate occupational categories from over 12,000 titles to less than 1000 occupational units using a slightly
modified version of the Standard Occupational Classifica -tion system, which would also facilitate linkage to other government labour market data (U.S. Department of Labor 1993).
The APDOT report anticipated that a prototype could
be created by 1994 and a final database would be ready
by 1996, though later estimates pushed the completion date to 2003 (U.S. Department of Labor 1993, pp. 23 f.; Peterson et al. 2001, p. 481). As a bridge, early versions of O*NET reviewed raw data collected for the DOT in previ-ous decades and recoded them in terms of the new O*NET variables. O*NET began collecting new data from surveys of job incumbents in 2001, replacing the recoded DOT data
on a rolling basis until June 2008, when first complete ver -sion of O*NET based on original data became available, eighteen years after the APDOT panel was established (U.S. Department of Labor 2005, pp. A-12 f., A-44, A-61).
O*NET resurveys occupations on a continuous basis in a 5-year cycle so another completely new set of ratings became available in 2013. This has great potential utility for researchers interested in capturing within-occupation skill change, which was not possible with the DOT. However, researchers will need to exercise caution because the
proj-ect is not organized specifically for research purposes and
new ratings simply replace old ratings for each set of occu-pations on a rolling basis rather than updating all ratings for each new edition. In addition, one skills section previ-ously completed by job-holders is now completed by job analysts who make judgment-based ratings using written job descriptions, rather than site visits. The values of these O*NET variables cannot be assumed to be comparable to prior values derived from incumbent self-reports.
3 O*NET data collection and structure
The first complete O*NET cycle produced a database of 239
items across seven surveys mailed to employers for work-ers to complete and an additional questionnaire assigned to consider alternatives. APDOT recommended the creation
of a new system to replace the DOT, subsequently named the Occupational Information Network (O*NET), which would use standardized surveys of a representative sample of job incumbents instead of job analysts conducting workplace interviews and observations (U.S. Department of Labor 1993; Peterson et al. 1999, pp. 297f.; Peterson et al. 2001).
Intended as an intellectual as well as a methodological break with the DOT, APDOT framed its task in terms of ideas derived from post-industrial and post-Fordist theories. The APDOT report contrasted the Fordist era, when the DOT was developed, to present conditions.
It was a time when mass production largely controlled or limited worker discretion. Jobs were broken into
simple tasks that could be filled by low-skilled work
-ers. Layers of managers directed efforts while sophis -ticated quality control systems caught defects. In describing workers and workplaces, the DOT of the
past reflected centralized hierarchical structures and thousands of narrowly defined jobs. As a result, it fre -quently emphasized manual and manipulative rather than cognitive skill requirements.
Today intense international competition is changing the workplace. The new workplace is characterized by fast-paced product cycles, rapid changes in tech-nology and increased interest in quality and service. To meet these changes, new business arrangements have evolved that encourage faster and more creative
action, increased flexibility and closer partnerships with employees and customers. Competition has also
increased the pressure for performance.
More flexible and adaptable workforces value team
-work over individual effort and net-works and alliances
over rigid hierarchies. Flatter organizations decen-tralize responsibility and create greater employee involvement at all levels. In short, these new high per-formance workplaces demand new technologies, new workplace structures and new skills (U.S. Department of Labor 1993, p. 13; see also Peterson et al. 1999, pp. 293 f.).
O*NET sought to avoid the blue-collar manufacturing bias of the DOT and improve measurement of “the increasingly cognitive demands of jobs and the new ways of thinking and managing that focus on quality, variety, speed and customer service” (U.S. Department of Labor 1993, p. 4). A National Academy of Science panel also endorsed the attention given to employee involvement practices in the early version of
geted in a data collection cycle and construct a sampling
frame of establishments within those industries. Staff con -tact a random sample of employers and mailed surveys to those agreeing to participate, who then distribute surveys to a random group of employees in the target occupation(s).
All employers receive a mix of different questionnaires for
each occupation to help ensure the representativeness of data. Respondents receive a prepaid $ 10 incentive for com-pleting the survey. Spanish-language versions of the sur-veys are sent to workers who need them as determined by employers and notices accompany all survey packets indi-cating the availability of Spanish-language versions, though they were not a part of the earliest years of data collection (U.S. Department of Labor 2005, pp.B-18 f., B-27 f.).
According to one estimate, 70 % of eligible establish-ments agreed to distribute surveys to their employees, of whom 65 % returned completed surveys; response rates
have been rising over time due to various efforts to increase
them (U.S. Department of Labor 2005, p. A-13, B-28). Though documentation is not always clear, it appears all O*NET measures are based on at least 15 respondents per occupation and often many more (U.S. Department of Labor 2005, p. B-6). O*NET does not publish information on total sample size, at least not in an easily accessed document, but
one staff member estimated that currently approximately
125,000 incumbent questionnaires were collected toward
the end of the first round of original data collection (personal communication, customer service staff, National Center for
O*NET Development). This would mean there are roughly 31,000 respondents per item because each of the question-naires is completed by only one-quarter of the sample, and there is an average of 39 respondents per item within each
of the 809 occupations in the first complete database. Nev -ertheless, this calculation should be considered very
infor-mal because it is very difficult for a researcher to determine
such basic facts about the O*NET sample as total number of respondents and number of respondents per occupation per questionnaire.
O*NET’s sampling methodology is a significant
improvement over the DOT and even standard household surveys. The sample is large and undoubtedly covers rela-tively rare occupations with higher reliability than house-hold surveys. Using employers to identify incumbents of
different occupations undoubtedly reduces measurement
error relative to household surveys, in which occupational
classification is based on self-reports that vary greatly in
detail and quality (Mellow and Sider 1983; Mathiowetz 1992). Improved occupational assignment, in turn, reduces noise and improves accuracy in the calculation of means for substantive variables (Abraham and Spletzer 2009).
However, the absence of easily accessed summary information about the distribution of respondents by
back-ground characteristics makes it difficult to assess how well
to job analysts because the questions proved too abstract for job incumbents to answer (U.S. Department of Labor 2005, pp. A-4, A-9). The incumbent questionnaires are titled Education and Training, Knowledge, Work Activities,
Work Context, Work Styles, and Skills. A small sample of
job analysts complete the Abilities questionnaire based on written job descriptions and in 2008 assumed responsibility for the Skills questionnaire from job incumbents, creating a
break in this series. These questionnaires cover different but
sometimes overlapping substantive domains.1
To reduce respondent burden, individuals within occu-pations are randomly selected to receive a subset of questionnaire(s) requiring about a half-hour to complete, rather than completing all surveys.
Responses are averaged across respondents on the assumption that any within-occupation variation represents
measurement error, which partly reflects traditional thinking
within the guiding discipline of Industrial/Organizational (IO) psychology (Peterson et al. 1999, p. 303; Peterson et al. 2001, p. 485; cf. U.S. Department of Labor 2005, p. A-60). Like the DOT, then, the O*NET database consists of occu-pation mean values and the original micro-data is not avail-able to researchers. This is a clear drawback to the O*NET database because job-level information on job skill require-ments is relatively rare and researchers have been concerned for a long time that occupation-level data may mask impor-tant variation within occupations (e.g., Spenner 1990).
In addition to the main surveys, all respondents complete
a checklist of representative occupation-specific tasks indi -cating the tasks that apply to their job.
All respondents also complete a Background question-naire giving information on personal characteristics and their job, such as age, gender, education, race and ethnic-ity, tenure, and any limiting physical or mental conditions, among others. Unfortunately, the information from the Background survey is not made publicly available in elec-tronic form, in published tabulations, or even mentioned in numerous background reports consulted for this paper, so
the demographic profile of O*NET respondents, the pur -pose of this information, and the use to which it is put are unclear.
Although there is nothing in principle that prevents the release of individual-level data for research purposes, there have never been plans for such release. This means, for example, that it is not possible to calculate the association between O*NET scores and demographic variables from the Background survey on the basis of microdata.
To draw samples of job incumbents, O*NET staff use
data from the U.S. Bureau of Labor Statistics to identify
industries that make significant use of the occupations tar
-1 For full text of all questionnaires, see http://www.onetcenter.org/
these influences may impart an upward bias to estimates of
job skill requirements relative to true population values and
otherwise affect estimated means. However, O*NET does
not publish the data necessary to address these issues further.
4 O*NET content
There are 239 distinct items across all O*NET survey instruments, not counting the Background questionnaire. The Knowledge, Skills, Abilities, and Work Activities ques-tionnaires ask two-part questions about both the Importance and Levels of a given skill or characteristic, such as the item on Negotiation below. These surveys account for 161
items or two-thirds of the total. In principle the different surveys cover different substantive domains, but in practice
the division of labour between them is imprecise and the content overlapping. The size of the O*NET database and
the looseness of its conceptual structure make it difficult to
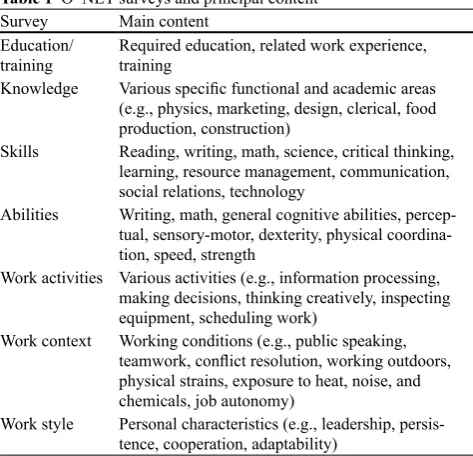
summarize the content parsimoniously, but Table 1 gives some indication of the major content areas covered by the
different surveys.
The content is strong in a number of areas. The education and training items are crisp and thoughtful. The response options are detailed, easy for respondents to understand, and expressed in natural units, such as educational degrees and units of time. The only drawback is that information on apprenticeships, which would be interesting to use in conjunction with other data from the U.S. Bureau of Labor Statistics, are not publicly available at least in the
down-loadable spreadsheet files on the O*NET web site. O*NET has succeeded in its efforts to ensure representa
-tiveness. Perhaps due to O*NET’s applied orientation, an extensive review of published O*NET reports did not turn up any information on the demographic composition of respondents. Therefore, it is not possible to compare the
distribution of O*NET respondents with Census population
values for age, education, gender, race/ethnicity, and Span-ish-language use, although response rates are available by occupation, industry, employer size class, and region (U.S. Department of Labor 2005, Appendix E).
If response rates within occupations are higher for more educated workers, which might be expected from the expe-rience of other surveys, the estimates of mean occupational skill requirements might be higher than the population val-ues. This is an issue for all voluntary surveys, but O*NET does not seem to have considered the issue of demo-graphic representativeness or the use of sampling weights to compensate for any imbalances even though it collects information on individual respondents that would permit
identification and correction of any sampling biases.
Because O*NET is a mailout-mailback survey that makes
significant literacy demands on respondents, it is likely that
responses are skewed to some degree toward the more edu-cated, those with higher cognitive abilities, and citizens and legal residents. Immigrants who speak neither English nor
Spanish are effectively outside the universe of respondents,
and even Spanish-speakers are likely to be underrepresented, especially undocumented immigrants. Because it samples people through employers, O*NET may also underrepre-sent various kinds of casual employment, such as temporary
workers (National Research Council 1999, p. 203). All of
web site, over 32,000 tools and technology are represented in the database, coded into over 18,000 non-duplicative UN
Standard Products and Services Codes (UNSPSC). This is a valuable and detailed checklist of specific equipment and software used in different occupations.
However, because the data were not on the incumbent surveys there is no information on the rates of technology use within occupations or the level of knowledge required. A number of occupations might use robots, but the T2 data-base cannot say whether the proportion of workers within them using robots is 5 % or 95 %. Likewise, while both
sec-retaries and financial analysts may use spreadsheets, there
is no way to know whether the software is being used as
a simple electronic ledger or to conduct complex financial
modelling. The absence of incidence rates and level of com-plexity is a problem for O*NET’s measures of technology use.
Employee involvement practices are also absent from O*NET, though apparently were included in pretests (Peter-son et al. 1999, pp. 147 ff.; Peterson 2001, p. 482). Although there are a few general measures of related ideas, such as job autonomy and group-based work, O*NET is relatively weak on measures of self-directed teams, involvement in quality improvement, and related concepts that are promi-nent in recent debates on the changing nature of work.
Despite the stated desire to reorient O*NET away from the DOT’s focus on manual occupations (Peterson et al. 1999, pp. 11,16), physical, perceptual, sensory, and psy-chomotor variables receive some of the most concentrated
attention with 38 items. This may reflect O*NET’s reliance
on pre-existing job analysis schemes and the understandable desire to assume the DOT’s function in disability determina-tions (Peterson et al. 2001, pp. 457 ff.). These variables may
be useful for measuring changes in physical job demands,
such as the declining importance of bodily work (Zuboff
1988), but research indicates that physical job requirements are not strongly related to wages, for example (Rotundo and Sackett 2004, pp. 137 ff.).
Likewise, there are other areas of overlap across surveys. There are four items on mathematics skills, mathematics knowledge, mathematical reasoning, and number facility (a = 0.92). In contrast, there is no item on the specific kinds
of math used on the job (e.g., algebra, calculus), which might be more helpful to job seekers, educators, and policy planners, as well as researchers. There are items on writing skills, writing comprehension, and written expression, but
none on the specific kinds or maximum length of documents
read or written on the job. There is an item on “judgment and decision making” and another on “making decisions and solving problems,” and others on freedom to make deci-sions and frequency of decision-making. There are separate
items on dealing with angry people, resolving conflicts, and frequency of conflict situations.
The Knowledge questionnaire also has a potentially useful
set of questions on the extent to which specific academic
subjects and functional knowledge are required by all oc-cupations (e.g., medicine, biology, chemistry, physics, for-eign language, engineering, mechanical knowledge, cleri-cal, administration and management). Unfortunately, the anchors for the Levels scales have problems in common with most of the other surveys, as discussed below. There is an extensive set of items on interpersonal and
problem-solving skills across different instruments. Items on physi -cal and other stressors and hazardous working conditions
in the Work Contexts questionnaire are clear and objective,
and a rare source of representative data on these important topics.
Unfortunately, although the APDOT report commented explicitly on the need to understand “new technologies, new workplace structures and new skills” (U.S. Department of Labor 1993, p. 13), O*NET’s coverage of the first two
domains is weak.
There are items on working with manufacturing technol-ogy, but very few relating to information technology and they tend to be too general or ambiguous to be very infor-mative. This is a bit peculiar since one of its goals was to replace the DOT with measures more relevant to the infor-mation economy.
Perhaps to fill this gap, O*NET recently began a new
Tools and Technology (T2) module, a massive data
collec-tion effort that involves sifting through informacollec-tion from
occupational information databases, professional associa-tions, vocational education, education/training curricula, and job listings, and consultation with subject matter experts. Most of the data appears to be collected through internet
searches (Dierdorff et al. 2006). According to the O*NET Table 1 O*NET surveys and principal content
Survey Main content Education/
training Required education, related work experience, training Knowledge Various specific functional and academic areas
(e.g., physics, marketing, design, clerical, food production, construction)
Skills Reading, writing, math, science, critical thinking, learning, resource management, communication, social relations, technology
Abilities Writing, math, general cognitive abilities, percep-tual, sensory-motor, dexterity, physical coordina-tion, speed, strength
Work activities Various activities (e.g., information processing, making decisions, thinking creatively, inspecting equipment, scheduling work)
Work context Working conditions (e.g., public speaking, teamwork, conflict resolution, working outdoors, physical strains, exposure to heat, noise, and chemicals, job autonomy)
gaps in content. In other cases, the underlying construct of interest is itself unclear, which is considered further in the following section.
5 Measurement: O*NET items and scales
O*NET items from the four surveys with two-part ques-tions raise three kinds of concerns: the distinction between
Importance and Levels, construct definition and question
wording, and response scale anchors.
5.1 Importance and levels
The Knowledge, Skills, Abilities, and Work Activities ques-tionnaires contain 161 two-part items that ask respondents the importance of the characteristic for their job (e.g., deci-sion making) and, if at least somewhat important, the level of the characteristic needed for their job. By contrast, the
Work Context questionnaire uses mostly frequency, time
spent, and other conventional response scales, such as not important/extremely important and none/a lot. The Educa-tion and Training quesEduca-tionnaire uses degree obtained and required times as response options.
There are at least a dozen questions on general cogni-tive ability (a = 0.97), such as analytical thinking, critical thinking, analyzing data or information, deductive reason-ing, and inductive reasoning.2 Although distinctions among these concepts may be clear to psychologists who work with these constructs, they are likely lost on respondents and perhaps even some job analysts rating occupations on the Abilities instrument. Informal inspections of correla-tions between these items also suggests there may be survey
effects, i.e., correlations seem lower between items from different surveys with relatively close meanings compared
to correlations between items from the same survey with less similar meanings. In other words, there may be a ten-dency for respondents to respond in systematic ways to the items within a survey when they belong to the same domain, rather than responding to each item independently.
In short, the individual surveys contain much that is use-ful but also seem to have been constructed with less coor-dination than desirable, resulting in both duplication and
2 The full list is (1) analytical thinking; (2) critical thinking; (3)
ana-lyzing data or information; (4) deductive reasoning; (5) inductive reasoning; (6) processing information; (7) complex problem solving; (8) updating and using relevant knowledge; (9) active learning; (10) thinking creatively; (11) fluency of ideas; and (12) category flexibility.
Fig. 2 Percentage distribution of importance and level correlations
● Judging the Qualities of Objects, Services, or People
Assessing the value, importance, or quality of things or people
● Systems Evaluation
Identifying measures or indicators of system perfor-mance and the actions needed to improve or correct performance, relative to the goals of the system
These and other O*NET items presume a single, easily-rated dimension, but the questions arguably encompass
many complex and difficult to rate dimensions. Some, such
as “systems evaluation”, “critical thinking” and “active learning” use behavioural science jargon that is likely to be unfamiliar and unclear to many lay respondents.
The anchoring examples do not necessarily clarify mat-ters. For Systems Evaluation the anchors are determining why a coworker was unable to complete a task on time (Level 2), understanding why a client is unhappy with a product (Level 4), and evaluating the performance of a computer system (Level 6). It is not at all clear that this item
measures a single, clearly defined construct.
Job analysis techniques often derive general constructs
from factor analyses of many specific items and it appears
that the O*NET surveys try to skip the use of concrete items and ask respondents to rate their jobs directly on the
higher-order constructs. Given the difficulty even many
social scientists have making substantive sense of the fac-tors resulting from exploratory factor analyses, this does not seem a promising approach for surveys completed by lay people.
Variables on the Abilities questionnaire seem particularly prone to this problem. Questions originally intended for
completion by job incumbents carry names like “fluency of ideas”, “category flexibility”, “speed of closure” and “rate
control”. The instrument contained so many technical terms that it was assigned to job analysts to complete rather than
workers once final data collection began (Donsbach et al.
2003). The Skills questionnaire, which was completed by
workers in O*NET’s first 5-year cycle, was also transferred to job analysts in 2008 because of the cognitive difficulties
its items created for respondents.
The APDOT panel recommended that “information should be presented in an easily understood format with a minimum of technical jargon” (U.S. Department of Labor 1993, p. 23). Lead project staff seemed generally satisfied
that this goal was met.
[Survey items] differ from technical definitions, how
-ever, in that each skill is defined in simple English… In
creating the O*NET questionnaires, every effort was made to write the descriptor definitions and anchors at
Analyses of pretest data indicated that Importance and Level items are so highly correlated (r = 0.95) as to be largely redundant, but O*NET made no changes to this aspect of the questionnaires (Peterson et al. 1999, pp. 61,
290 f., 302). Analyses of current O*NET data confirms
that the Importance and Level items are largely redundant. When Importance and Level scores are correlated across the full sample of 809 occupations for all 161 questions using this format, the mean correlation is 0.92 and the median is 0.94 (author’s calculations). Approximately 19 % of the cor-relations are 0.98 or above, and only 15 % are below 0.88. Figures 1 and 2 present the full percentage distribution of the correlations in banded intervals and by individual value, respectively. It is unfortunate that the evident redundancy of these two sets of scales across 161 items coexists with the under-representation of content on information technology and employee involvement.
5.2 Construct definition and question wording
Specialists in the design of survey research agree that best practice argues for survey questions that are phrased clearly,
avoid jargon, and measure a single, well-defined con -cept or construct, a property known as unidimensionality (Tourangeau et al. 2000, pp. 23ff., 61). Many O*NET items
violate these principles. There are numerous examples of vague, complex, jargon-laden, potentially confusing, and multi-barrelled items that bundle more than one concept
into the same question. Even the definitions used to clarify
questions are often long and complex. Points along the Lev-els scales are anchored by behavioural examples that have their own problems, discussed in the next section.
For example, one item asks the extent to which jobs require “Identifying Objects, Actions, and Events,” which
is defined as
Identifying information by categorizing, estimating,
recognizing differences or similarities, and detecting
changes in circumstances or events.
Testing an automobile transmission apparently involves a relatively low level of this construct, while determining the reaction of a virus to new drug represents a relatively high level. (The questionnaire text for this and the following examples are reproduced in the Appendix).
Other examples include:
● Estimating the Quantifiable Characteristics of Products,
Events, or Information
at three points with specific examples to give respondents
common benchmarks in assigning scores to their jobs. The intent is to improve consistency across respondents and increase the objectivity of the ratings.
However, the behavioural anchors have three poten-tial drawbacks: violation of the equal interval assumption, extreme anchoring and scale truncation, and questionable overall helpfulness of the anchors.
1. It is not obvious that the anchors divide the scales into equal intervals. The item on speaking skill is anchored by three behavioural examples at Levels 2, 4, and 6: ex-plaining tourist attractions, interviewing applicants, and
arguing a legal case before the U.S. Supreme Court (see
Appendix). On its face, the level of speaking skill re-quired for the middle anchor seems much closer to the
first task than the third task, yet the survey asks respon
-dents to treat the behaviours as marking off
equally-spaced ranges of the construct.
2. There is also a systematic and rather puzzling tendency to use extreme examples to anchor level 6, which is one level below the maximum scale value. Level 6 anchors include writing a legal brief challenging a federal law, creating a new technology for producing industrial dia-monds, judging the value of recently discovered ancient art, and maintaining information on orbital satellites (see Appendix). Another Level 6 anchor, estimating the amount of natural resources beneath the world’s oceans, is not obviously a job responsibility for any occupation. Other Level 6 anchors, such as arguing a case before the
Supreme Court, negotiating a treaty as an ambassador,
and designing a new personnel system for the Army, are performed by a tiny fraction within their respective oc-cupations. Even if one were to grant that respondents in other jobs could relate their tasks to these highly
occu-pation-specific anchors, they would cover a very small
fraction of the workforce. If these behaviours are one level below their respective scale maxima, one wonders how many jobs could possibly qualify for the maximum ratings.
Indeed, only 81 of the 130,249 ratings (809 occupations times 161 items) or 0.06 % of ratings are between 6.50 and 7 (author’s calculations). It seems likely that respon-dents almost never use the maximum scale value, probably because the Level 6 anchors tend to be so extreme. Scores at Level 6 (occupational means between 5.50 and 6.49 inclu-sive) are only slightly more common, representing 1.68 % of all ratings. Thus, out of 130,249 ratings, approximately 1.75 % is 5.5 or above.
The designers of O*NET seemed unaware of potential problems with the anchors, such as scale compression. While they acknowledged that individual anchors might
have idiosyncratic effects, “It is difficult, however, for us to
no more than an eighth-grade reading level (Peterson et al. 1999, p. 57, 243).
However, following the pretest, the conclusion from expert reviews, cognitive interviews, and focus groups was that survey questions were often “hard to understand, interpret, and answer” (Hubbard et al. 2000, p. 11). “Focus group par-ticipants sometimes found the right-side (example) anchors to be of limited utility in making a rating judgment about their job” (Hubbard et al. 2000, p. 14). Survey questions
used difficult vocabulary, overlong sentences, and complex concepts that assumed knowledge and were difficult for
respondents to relate to their own jobs (Hubbard et al. 2000, p. 11).
The task of answering such an item requires a fair level of verbal ability (to understand the words pre-sented), cognitive sophistication (to conceptualize these novel concepts), and abstract thinking (to gen-eralize from their own experiences to make judgments about people who they imagine might do their job).
Respondents must also be sufficiently familiar with
questionnaires to easily project their mental represen-tation onto a rating scale that is itself complex and
dif-ficult to understand.
Most of the questions refer to high level abstractions of everyday activities. This makes it hard to (1) under-stand what the question is asking about and (2) retrieve and combine information to formulate an answer. This can result in unreliable and invalid answers. It is likely that high levels of education—higher than high school—are necessary, due to the extensive vocabu-lary used in these instruments (Hubbard et al. 2000, pp. 12 f.).
In short, answering many of the O*NET questions often appears to be a very complex judgment task. Survey research indicates that when survey questions present respondents with a complex task they are more likely to answer in a pragmatic fashion using heuristics based on their general views of the subject rather than responding to the particular content of the items as intended by researchers (Krosnick 1999, pp. 547 ff.). In other words, it is unlikely that all of the item ratings reflect independent judgments along dis
-tinct dimensions; answers to groups of items may reflect a
response set.
5.3 Level scale anchors
The Knowledge, Skills, Abilities, and Work Activities sur-veys use Level of complexity scales that range from 1 to
7. In addition, O*NET staff assign a score of zero when
tain useful information. Research on occupational prestige scales within sociology shows that when respondents are asked to sort occupational titles without further instructions, they rank them in a manner consistent with other surveys asking respondents to rank occupations in terms of their prestige (Kraus et al. 1978). Prestige scores, in turn, cor-relate strongly with objective data on occupational earnings and education levels (Hauser and Warren 1997). Respon-dents who are trying to make sense out of ambiguous or confusing tasks will supply their own meanings or best guesses in such situations. Therefore, it would not be sur-prising if O*NET respondents provided broadly reasonable ratings of their jobs even if both the question wording and behavioural anchors were somewhat confusing and distract-ing. Respondents undoubtedly use the ranking implicit in the numerical scale as a guide if nothing else. Averaging ratings over respondents within occupations also reduces
the influence of idiosyncratic rating behaviours. The high
reported response rates, including low rates of item non-response, also suggest that the O*NET instruments have face validity, though the reassignment of the Skills ques-tionnaire from incumbents to analysts because of respon-dent confusion over the instrument also argues for caution. The greater reliability of O*NET’s occupational coding also improves the reliability of its occupational skill scores.
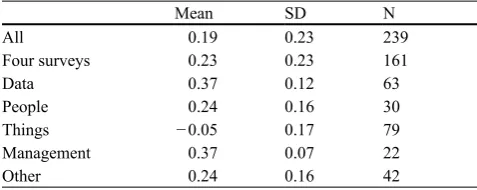
Indeed, according one test O*NET items show reasonably strong criterion validity. When O*NET items are correlated with wages the measures often perform well. Table 2 shows descriptive statistics for bivariate correlations between indi-viduals’ wages and O*NET occupation-level scores, after O*NET data were appended to individual-level records in
the Current Population Survey (2005) (ncps = 223,011). The
first row for all measures can be compared to the second row
for the four surveys using the anchors and Importance-Level format (Knowledge, Skills, Abilities, Work Activities). The average correlation with wages is 0.19 for all items and 0.23 for those from the four surveys with anchors. While not all correlations are high, 40.2 % of all ratings and 48 % of ratings from the four surveys are greater than 0.30 (not shown). When believe that the chosen anchors plausibly could have
seri-ous, systematic effects” (Peterson et al. 1999, p. 244). The rest of the distribution of ratings across levels shows good variation (see Fig. 3). However, O*NET creates
poten-tial confusion among respondents by offering response
options that are then precluded by the choice of extreme examples for Level 6 anchors. Most survey researchers try to prevent compression of the response distribution to capture as full and detailed range of variation as possible. O*NET truncates its own scales unnecessarily by discour-aging respondents from using the top two scale values and generates puzzlement among researchers and, one suspects, respondents, as well.
3. At the most general level, it is not clear that O*NET’s behavioural anchors make the rating task easier than an unlabelled or less complexly labelled scale, such as the Importance scales. Because the anchors are so
occupa-tion-specific, respondents may have problems relating
their own job tasks to them and locating themselves on the scale. For example, the item on “Documenting/Re-cording Information” assumes people know how much documentation is required for a crime scene investiga-tion and can judge their own job’s paperwork require-ments relative to this anchor point (see Appendix). This is not to endorse the Importance scales over the Level scales because in principle the concept of level of com-plexity or trait intensity is more meaningful than impor-tance. However, it is quite possible that respondents are relying more on the numerical part of the Level scale than on the anchors, which are highly occupation-specif-ic, often esoteroccupation-specif-ic, and would seem to present a complex judgment task for respondents, who would need to relate these examples to their own particular job.
5.4 Implications
Despite the limitations of the O*NET items and scales, there is reason to believe à priori that the O*NET rankings con-Fig. 3 Distribution of O*NET
refers to questions dealing with personality traits, double-barrelled items, and other topics.
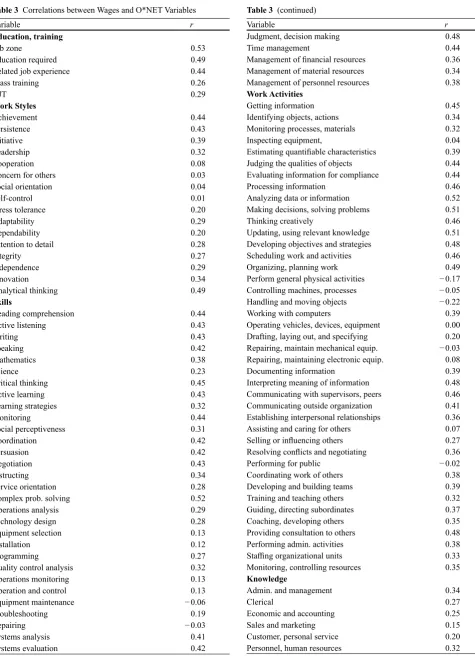
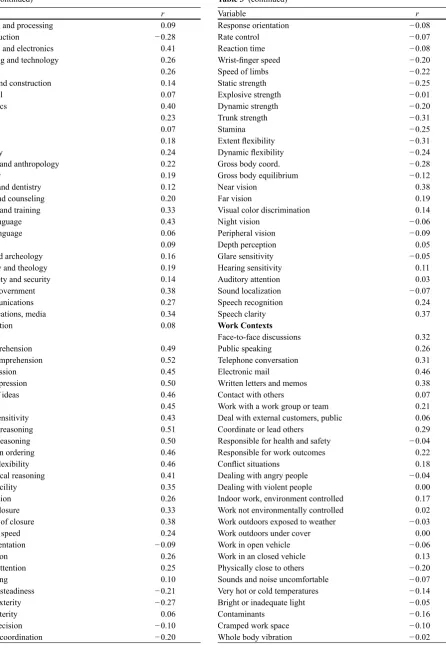
Table 3 shows the full set of 239 correlations in the order
they appear on the different O*NET questionnaires. The
absolute and relative magnitudes of many of the individual correlations appear reasonable, but others less so and argue for further analysis (e.g, wages correlate 0.38 with require-ments for near vision ability and 0.46 with email use, but only 0.27 with programming skills). Needless to say, multivariate analyses might alter conclusions drawn from Tables 2 and 3.
Nevertheless, despite various exceptions, it appears that the implications of O*NET’s limitations for the validity of its measures are smaller than might be expected, at least based on this initial analysis.
6 An alternative approach
Although O*NET is useful one might ask if there might be a better approach to measuring job skill requirements. O*NET sought to create a common language for describ-ing worker and job requirements to improve person-job matching and help policy makers estimate future skill needs more accurately (U.S. Department of Labor 1993, p. 7,14, 17, 20,31; Peterson et al. 1999, p. 18). However, the level scales have an arbitrary metric that make direct
compari-sons between job characteristics and worker traits difficult.
The rating scales may be useful for comparisons across jobs and over time, but they do not have an absolute meaning or one considers that wages may not be a suitable criterion for
all O*NET variables, these aggregate results seem reasonable. Indeed, the results are in some cases even stronger when the correlations are disaggregated by subject. The
items reflecting involvement with data and management
tasks correlate 0.37 with wages on average and many are higher. Items relating to interpersonal tasks and skills
cor-relate 0.27 with wages on average. Correlations for involve -ment with things, sensory-motor, and other physical tasks
cluster around zero, with a significant number of negative
values. The correlations for data-related and management tasks are not only larger, they are also more consistently related to wages (see Fig. 4). Another three items measur-ing job autonomy correlate 0.37 with wages on average (not shown). The residual category in the last row of Table 2 Table 2 Correlations between wages and O*NET items
Mean SD N
All 0.19 0.23 239
Four surveys 0.23 0.23 161
Data 0.37 0.12 63
People 0.24 0.16 30
Things − 0.05 0.17 79
Management 0.37 0.07 22
Other 0.24 0.16 42
N number of correlations. The four surveys in the second row are Knowledge, Skills, Abilities, and Work Activities. Correlations produced by merging O*NET ratings onto microdata from the Current Population Survey outgoing rotation group files (2005) (n = 223,011)
Variable r
Education, training
Job zone 0.53
Education required 0.49
Related job experience 0.44
Class training 0.26
OJT 0.29 Work Styles Achievement 0.44 Persistence 0.43 Initiative 0.39 Leadership 0.32 Cooperation 0.08
Concern for others 0.03
Social orientation 0.04
Self-control 0.01
Stress tolerance 0.20
Adaptability 0.29
Dependability 0.20
Attention to detail 0.28
Integrity 0.27
Independence 0.29
Innovation 0.34
Analytical thinking 0.49
Skills
Reading comprehension 0.44
Active listening 0.43
Writing 0.43
Speaking 0.42
Mathematics 0.38
Science 0.23
Critical thinking 0.45
Active learning 0.43
Learning strategies 0.32
Monitoring 0.44
Social perceptiveness 0.31
Coordination 0.42
Persuasion 0.42
Negotiation 0.43
Instructing 0.34
Service orientation 0.28
Complex prob. solving 0.52
Operations analysis 0.29
Technology design 0.28
Equipment selection 0.13
Installation 0.12
Programming 0.27
Quality control analysis 0.32
Operations monitoring 0.13
Operation and control 0.13
Equipment maintenance − 0.06
Troubleshooting 0.19
Repairing − 0.03
Systems analysis 0.41
Systems evaluation 0.42
Table 3 Correlations between Wages and O*NET Variables
Variable r
Judgment, decision making 0.48
Time management 0.44
Management of financial resources 0.36
Management of material resources 0.34
Management of personnel resources 0.38
Work Activities
Getting information 0.45
Identifying objects, actions 0.34
Monitoring processes, materials 0.32
Inspecting equipment, 0.04
Estimating quantifiable characteristics 0.39
Judging the qualities of objects 0.44
Evaluating information for compliance 0.44
Processing information 0.46
Analyzing data or information 0.52
Making decisions, solving problems 0.51
Thinking creatively 0.46
Updating, using relevant knowledge 0.51 Developing objectives and strategies 0.48
Scheduling work and activities 0.46
Organizing, planning work 0.49
Perform general physical activities − 0.17 Controlling machines, processes − 0.05
Handling and moving objects − 0.22
Working with computers 0.39
Operating vehicles, devices, equipment 0.00 Drafting, laying out, and specifying 0.20 Repairing, maintain mechanical equip. − 0.03 Repairing, maintaining electronic equip. 0.08
Documenting information 0.39
Interpreting meaning of information 0.48 Communicating with supervisors, peers 0.46 Communicating outside organization 0.41 Establishing interpersonal relationships 0.36
Assisting and caring for others 0.07
Selling or influencing others 0.27
Resolving conflicts and negotiating 0.36
Performing for public − 0.02
Coordinating work of others 0.38
Developing and building teams 0.39
Training and teaching others 0.32
Guiding, directing subordinates 0.37
Coaching, developing others 0.35
Providing consultation to others 0.48
Performing admin. activities 0.38
Staffing organizational units 0.33
Monitoring, controlling resources 0.35
Knowledge
Admin. and management 0.34
Clerical 0.27
Economic and accounting 0.25
Sales and marketing 0.15
Customer, personal service 0.20
Personnel, human resources 0.32
Variable r
Production and processing 0.09
Food production − 0.28
Computers and electronics 0.41
Engineering and technology 0.26
Design 0.26
Building and construction 0.14
Mechanical 0.07 Mathematics 0.40 Physics 0.23 Chemistry 0.07 Biology 0.18 Psychology 0.24
Sociology and anthropology 0.22
Geography 0.19
Medicine and dentistry 0.12
Therapy and counseling 0.20
Education and training 0.33
English language 0.43
Foreign language 0.06
Fine arts 0.09
History and archeology 0.16
Philosophy and theology 0.19
Public safety and security 0.14
Law and government 0.38
Telecommunications 0.27
Communications, media 0.34
Transportation 0.08
Abilities
Oral comprehension 0.49
Written comprehension 0.52
Oral expression 0.45
Written expression 0.50
Fluency of ideas 0.46
Originality 0.45
Problem sensitivity 0.43
Deductive reasoning 0.51
Inductive reasoning 0.50
Information ordering 0.46
Category flexibility 0.46
Mathematical reasoning 0.41
Number facility 0.35
Memorization 0.26
Speed of closure 0.33
Flexibility of closure 0.38
Perceptual speed 0.24
Spatial orientation − 0.09
Visualization 0.26
Selective attention 0.25
Time sharing 0.10
Arm-hand steadiness − 0.21
Manual dexterity − 0.27
Finger dexterity 0.06
Control precision − 0.10
Multilimb coordination − 0.20
Table 3 (continued)
Variable r
Response orientation − 0.08
Rate control − 0.07
Reaction time − 0.08
Wrist-finger speed − 0.20
Speed of limbs − 0.22
Static strength − 0.25
Explosive strength − 0.01
Dynamic strength − 0.20
Trunk strength − 0.31
Stamina − 0.25
Extent flexibility − 0.31
Dynamic flexibility − 0.24
Gross body coord. − 0.28
Gross body equilibrium − 0.12
Near vision 0.38
Far vision 0.19
Visual color discrimination 0.14
Night vision − 0.06
Peripheral vision − 0.09
Depth perception 0.05
Glare sensitivity − 0.05
Hearing sensitivity 0.11
Auditory attention 0.03
Sound localization − 0.07
Speech recognition 0.24
Speech clarity 0.37
Work Contexts
Face-to-face discussions 0.32
Public speaking 0.26
Telephone conversation 0.31
Electronic mail 0.46
Written letters and memos 0.38
Contact with others 0.07
Work with a work group or team 0.21
Deal with external customers, public 0.06
Coordinate or lead others 0.29
Responsible for health and safety − 0.04
Responsible for work outcomes 0.22
Conflict situations 0.18
Dealing with angry people − 0.04
Dealing with violent people 0.00
Indoor work, environment controlled 0.17 Work not environmentally controlled 0.02 Work outdoors exposed to weather − 0.03
Work outdoors under cover 0.00
Work in open vehicle − 0.06
Work in an closed vehicle 0.13
Physically close to others − 0.20
Sounds and noise uncomfortable − 0.07
Very hot or cold temperatures − 0.14
Bright or inadequate light − 0.05
Contaminants − 0.16
Cramped work space − 0.10
Whole body vibration − 0.02
selling, public policy planning for education and training, and research on the congruence or mismatch between the distributions of the nation’s workforce characteristics and the jobs available. If people and jobs are not measured on the same or equivalent scales, they cannot be compared.
Explicit scaling is an alternative approach that would address this and some of the other problems described above. Explicit scaling involves questions and response options that are objective, concrete, correspond directly to the target of interest, and have absolute meanings for respondents. Questions are phrased in terms of facts, events, and behaviours, rather than attitudes, evaluations, and holis-tic judgments. Items are general enough to encompass the
wide range of jobs within the economy, but sufficiently
concrete that they have stable meanings across respondents. Response options use natural units when possible and
dis-criminate a wide range of levels to avoid floor and ceiling effects. Rating scales, vague quantifiers, and factor scores, which have arbitrary metrics and lack specific or objective
referents, are a last resort. The exhibit on the following page contrasts O*NET’s items on mathematics with those from the author’s survey of Skills, Technology, and Management Practices (STAMP), which used explicit scaling principles (see Handel 2008 and this issue for more detail on the implementation of explicit scaling in STAMP). The alterna-tive questions are clear and objecalterna-tive, correspond to person measures, and are well aligned with policy-relevant school curriculum categories.
Items constructed using an explicit scaling approach would be expected to have high face validity and ease of use (unlike the O*NET Abilities and Skills questionnaires), and to produce less measurement error because there is less room for subjective interpretation and self-enhancing biases. Because of their more direct correspondence to the target phenomenon or concept, such measures have greater external or ecological validity. They are more meaningful outside the context of a particular survey instrument because of their greater faithfulness to some observable, real-world condition or concept. Their strength is their verisimilitude.
While absolute or externally meaningful scales can be
difficult to construct for some job characteristics, O*NET
also missed opportunities to construct more objective mea-sures of math, reading, writing, physical demands, technol-ogy skills, and employee involvement, among others. For example, O*NET measures of physical demands could have been greatly improved if the project had produced more objective measures aligned with policy by collaborating with other disciplines, such as ergonomics and occupational health, and other government agencies, such as the National Institute for Occupational Safety and Health, Occupational Safety and Health Administration, and the Social Security Administration’s Division of Disability Research.
external referent. Likewise, abstract factor scores built from several such variables (e.g., Peterson et al. 1999, pp. 251 ff.)
use arbitrary rather than natural units. There are usually no commensurate person measures to which they can be com-pared directly to test for possible mismatch.
One of the principles of Item Response Theory is to array both items and subjects on the same scale. This same prop-erty would be desirable for measures of job characteristics; they should use the same units as measures of person char-acteristics. For example, one can easily compare O*NET’s measure of occupational educational requirements with the educational attainment of the labour force because jobs and persons are measured in a common, natural unit, i.e., degree levels. By contrast, it is not easy to know whether workers are well matched with jobs on dimensions measured with the 0–7 Level scales because there are no corresponding person measures that use these yardsticks. This limits the usefulness of such items for individual employment
coun-Variable r
Exposed to radiation 0.09
Exposed to disease − 0.01
Exposed to high places 0.00
Hazardous conditions − 0.02
Hazardous equipment − 0.02
Exposed to minor burns − 0.25
Sitting 0.31
Standing − 0.33
Climbing ladders, etc. − 0.04
Walking or running − 0.35
Kneeling, crouching, etc. − 0.25
Keeping balance − 0.29
Using hands with tools − 0.28
Bending or twisting body − 0.34
Repetitive motions − 0.34
Common safety equip. − 0.09
Specialized safety equip. 0.02
Serious mistake possible 0.24
Decisions’ results 0.36
Decisions have impact 0.27
Freedom to make decisions 0.40
Automated job 0.08
Very exact is important 0.24
Repetitious activities 0.00
Freedom to set tasks 0.37
Competitive job 0.29
Meet strict deadlines 0.27
Keep pace set by machine − 0.18
Regular schedule − 0.04
Hours per week 0.39
O*NET ratings merged onto the Current Population Survey outgoing rotation group files (2005)
(n=~216,000). Correlations listed according to order on O*NET questionnaires.
they are drawn, and typically assign extreme anchors for Level 6, consistently discouraging respondents from using the upper end of O*NET’s own chosen scale range. 6. Given the complexity of the information processing
tasks involved, it is likely that respondents answer many questions pragmatically and heuristically, based on their general views of the apparent meaning of the questions and scales, rather than based on the precise, particular or intended meaning of the items and anchoring examples.
Despite these concerns, in the aggregate, 40 % of O*NET’s 239 items correlate moderately or moderately strongly with
wages and the figure is 48 % for the items from the four surveys using the Importance and Level format, suggesting reasonable criterion validity, though individual correlations often have unexpected absolute and relative magnitudes.
However, while many O*NET measures seem to func-tion reasonably well, the data would be more interpretable if the items and response options were more objective. Explicit scaling is one alternative approach. O*NET is now
widely used in career counselling and related fields, which is a tribute to the project’s efforts. Presumably, many of its intended users find it useful. However, the O*NET content model is ponderous and unnecessarily flawed, posing prob -lems of interpretability for workers completing the surveys and probably for job seekers, as well.
For researchers, O*NET presents opportunities but also challenges. The very size of the database is daunting and requires attention in selecting variables. The Importance scales are redundant and can probably be ignored without great loss of information. Many variables have ambiguous or fuzzy mean-ings and the reasonableness of basic descriptive results should always be checked before proceeding to take the meaning at face value. The O*NET project itself could make the database more useful to researchers by publishing basic sampling data from the background survey, clearly archiving each quinquen-nial version of the database, and making available to research-ers the original survey microdata for secondary data analysis.
Open Access This article is distributed under the terms of the Creative Commons Attribution License which permits any use, distribution, and reproduction in any medium, provided the original author(s) and the source are credited.
Conclusion
The Occupational Information Network (O*NET) was designed to replace the Dictionary of Occupational Titles,
which was difficult to update and had generated numerous
questions regarding sampling strategy, content coverage, and measurement strategy. O*NET improves upon the DOT in its sample size, sampling methods, and content coverage. Nevertheless, questions and issues regarding the sample, content, and measurement approach remain.
1. The representativeness of the worker sample with re-spect to basic demographic information, such as edu-cation, gender, race, and ethnicity, is unknown even though O*NET collects this information on its Back-ground survey. It is possible that over-representation of more educated workers because of the survey’s cogni-tive burden biases estimates of skill demands upward, but this remains a hypothesis in the absence of the nec-essary data and analysis.
2. O*NET’s coverage of certain content areas, such as technology and employee involvement practices, is too sparse, while other content is redundant. This
redundan-cy does not seem to reflect design but rather a lack of
coordination in the construction of a very long battery of items across multiple instruments.
3. Four of the main O*NET surveys contain substantial redundancy between the Importance and Level scales; correlations between these scores within items are gen-erally around 0.90 or above. Respondent burden could be reduced and important content on technology and workplace practices created by removing the Impor-tance portion of these items.
4. Many of the items themselves are vague, overly complex, and jargon-laden. O*NET has recognized this fact im-plicitly in transferring responsibility for completing the Abilities and Skills questionnaires from incumbents to job analysts, who receive written information on the oc-cupations they rate but do not make workplace site visits. 5. The anchors for the seven-point Level scales often
vi-olate the equal interval assumption, can be difficult to
7 Appendix
Representative O*NET items
National Research Council.: Committee on the Techniques for the En-hancement of Human Performance: Occupational Analysis. The Changing Nature of Work: Implications for Occupational Analy-sis. National Academy Press, Washington D.C. (1999)
Peterson, N.G., Mumford, M.D., Borman, W.C., Jeanneret, P.R., Fleishman, E.A.: An Occupational Information System for the 21st Century: The Development of O*NET. American Psychologi-cal Association, Washington D.C. (1999)
Peterson, N.G., Mumford, M.D., Borman, W.C., Jeanneret, P.R., Fleishman, E.A., Levin, K.Y., Campion, M.A., Mayfield, M.S., Morgeson, F.P., Pearlman, K., Gowing, M.K., Lancaster, A.R., Sil-ver, M.B., Dye, D.M.: Understanding work using the occupational information network (O*NET): implications for practice and re-search. Pers. Psychol. 54:451–492 (2001)
Rotundo, M., Sackett, P.R.: Specific versus general skills and abili-ties: a job level examination of relationships with wage. J. Occup. Organ. Psychol. 77, 127–148 (2004)
Spenner, K.I.: Temporal changes in work content. Am. Sociol. Rev. 44, 968–975 (1979)
Spenner, K.I.: Skill: meanings, methods, and measures. Work. Occup.
17, 399–421 (1990)
Tourangeau, R., Rips, L.J., Rasinski, K.: The Psychology of Survey Response. Cambridge University Press, New York (2000) United States Department of Labor. Employment and Training
Admin-istration: Dictionary of Occupational Titles, Volume 1, Fourth Edi-tion Revised. Washington D.C. (1991)
United States Department of Labor. Employment and Training Admin-istration: The New DOT: A Database of Occupational Titles for the Twenty-First Century. Final Report of the Advisory Panel for the Dictionary of Occupational Titles (APDOT), Washington D.C. (1993)
United States Department of Labor. Employment and Training Ad-ministration: O*NET Data Collection Program. Office of Manage-ment and Budget Clearance Package Supporting StateManage-ment and Data Collection Instruments, Washington D.C. (2005)
Vallas, S.P.: The concept of skill: A critical review. Work. Occup. 17, 379–398 (1990)
Zuboff, S.: In the Age of the Smart Machine: The Future of Work and Power. Basic Books, New York (1988)
Michael J. Handel is associate professor of Sociology at Northeast-ern University in Boston, Massachusetts, USA. His research areas are trends in earnings inequality and job skill requirements, and their relationships to computer technology and the organization of work, including employee involvement practices. His STAMP survey, dis-cussed in this volume, is the basis for sections and items on job skill requirements used in the World Bank’s multi-country STEP survey and the OECD’s multi-country PIAAC survey.
References
Abraham, K.G., Spletzer, J.R.: 2009. “New Evidence on the Re-turns to Job Skills.” Paper presented to the American Economics Association
Attewell, P.: What is skill? Work. Occup. 17, 422–447 (1990) Dierdorff, E.C., Drewes, D.W., Norton, J.J.: “O*NET Tools and
Tech-nology: A Synopsis of Data Development Procedures.” North Carolina State University. http://www.onetcenter.org/dl_files/ T2Development.pdf (2006). Accessed 13 April 2010
Donsbach, J., Tsacoumis, S., Sager, C., Updegraff, J.: “O*NET Ana-lyst Occupational Abilities Ratings: Procedures.” Alexandria, VA: Human Resources Research Organization (HumRRO). Prepared for National Center for O*NET Development. North Carolina O*NET Center. Raleigh, North Carolina (2003)
Feser, E.J.: What regions do rather than make: A proposed set of knowledge-based occupation clusters. Urban. Stud. 40, 1937– 1958 (2003)
Handel, M.J.: Models of Economic Organization and the New Inequal-ity in the United States. Unpublished doctoral dissertation, Sociol-ogy Department, Harvard University (2000)
Handel, M.J.: “Measuring job content: skills, technology, and man-agement practices.” Institute for Research on Poverty Discussion Paper no. 1357–08. University of Wisconsin, Madison WI. http:// www.irp.wisc.edu/publications/dps/pdfs/dp135708.pdf (2008) Hauser, R.M., Warren, J.R.: Socioeconomic indexes for occupations:
a review, update, and critique. Sociol. Methodol. 27, 177–298 (1997)
Hirsch, B.T.: Why do part-time workers earn less? The role of worker and job skills why do part-time workers earn less? The role of worker and job skills. Ind. Labor Relat. Rev. 58, 525–551 (2005) Hubbard, M., McCloy, R., Campbell, J., Nottingham, J., Lewis, P.,
Rivkin, D., Levine, J.: “Revision of O*NET Data Collection In-struments.” National O*NET Consortium. National Center for O*NET Development. Employment Security Commission, Ra-leigh (2000)
Kohn, M.L., Schooler, C.: Work and Personality. Norwood, NJ, Ablex Publishing (1983)
Kraus, V., Schild, E.O., Hodge, R.W.: Occupational prestige in the col-lective conscience. Soc. Forces. 56, 900–918 (1978)
Krosnick, J.A.: Survey research. Annu. Rev. Psychol. 50, 537–567 (1999)
Krueger, A., Schkade, D.: “Sorting in the Labor Market: Do Gregari-ous Workers Flock to Interactive Jobs?” Princeton University, Department of Economics, Center for Economic Policy Studies, Working Paper (2007)
Mathiowetz, N.A.: Errors in reports of occupation. Public. Opin. Q.
56, 352–355 (1992)
Mellow, W., Sider, H.: Accuracy of response in labor market surveys: evidence and implications. J. Lab. Econ. 1, 331–344 (1983) Miller, A.R., Treiman, D.J., Cain, P.S., Roos, P.A.: Work, Jobs, and