R E S E A R C H
Open Access
Corporate spinoffs and executive
compensation
Justin Law
1*and Wayne Yu
2* Correspondence:afjustin@polyu. edu.hk
1School of Accounting and Finance,
The Hong Kong Polytechnic University, Hung Hom, Hong Kong, China
Full list of author information is available at the end of the article
Abstract
This paper investigates the impact of corporate spinoffs on executive compensation. We find no significant association between executive compensation and stock returns prior to spinoffs, but a significant positive association between the two afterwards. We also find evidence that corporate governance generally improves after the spinoff. In addition, the positive association between executive compensation and stock returns is more pronounced for firms with greater improvements in their corporate governance. Overall, our findings support the notion that spinoffs create value by reducing agency costs.
Keywords:Spinoffs, Corporate governance, CEO compensation
JEL classification:G32, G34, J33
Introduction
Spinoff is a unique form of corporate re-organization in that it creates value (Hite and Owers 1983; Miles and Rosenfeld 1983; Schipper and Smith 1983; Cusatis et al. 1993) without any cash being involved in the process. One explanation advanced in the spin-off value-creation argument is the reduction of agency costs arising from prior corpor-ate diversifications. Specifically, spinoffs reduce agency costs by dismantling internal capital market inefficiencies, improving governance structures, and enhancing contracting efficiency.
In this study, we analyse how spinoff improves contracting efficiency by examining CEO compensation contracts. Specifically, we examine the impact of spinoff on pay-performance sensitivity of CEO compensation for spinoff parent firms. If spinoff improves contracting efficiency, it will promote interest alignment between CEOs and shareholders. Consequently, the CEO pay-performance sensitivity will be improved after spinoff (the interest alignment hypothesis). Alternatively, the CEO may also to use spinoff as an opportunity to re-negotiate his/her compensation contract to hedge against add-itional business risk as the firm is becoming less diversified. As a result, the CEO pay-performance sensitivity may be impaired after spinoff (the risk aversion hypothesis).
Next, we extend the study to examine the role of corporate governance present in spinoff firms on CEO compensation. We use four components of corporate govern-ance mechanisms: board structure, committee independence, board and committee
activities, and institutional ownership. We then combine the scores of the four individual governance mechanisms to investigate the impact of overall governance on CEO pay.
We briefly summarize our findings as follows. Based on a sample of 75 firms spanning the period from 1990 to 1997, CEOs received more stock options after spinoff. This obser-vation is consistent with Seward and Walsh (1996), as well as Jensen et al. (2004), who document a substantial rise in the use of stock options from 1992 to 2000. More import-antly, we find that pay-performance sensitivity improves significantly for the parent firm after a spinoff using stock return as a measure for corporate performance. This finding lends support to the interest alignment hypothesis, which complements the extant literature on the agency cost reduction explanation of spinoff value creation (e.g. Gertner et al.2002; Burch and Nanda2003; Ahn and Walker2007). Third, corporate governance generally im-proves after spinoff, and the improvement in the CEO pay-performance sensitivity after spinoff is more pronounced for firms with greater corporate governance improvement.
Our study contributes to the literature by extending the contracting efficiency prop-osition to empirically examine CEO compensation contracts in spinoff firms. The con-sideration of compensation contracts using a long-window event study enables us to test both the interest alignment and risk aversion hypotheses stemming from the ex-ecutive compensation literature. To the best of our knowledge, this is the first long-window event study to examine the impact of CEO compensation contracts on spinoff firms.1In addition, the use of pay-performance sensitivity methodology directly captures the extent of interest alignment improvement from the spinoff transaction. Fi-nally, this study analyses the role of four aspects of corporate governance in improving interest re-alignment for spinoff firms. Notwithstanding the extensive literature on corporate governance, the literature examining the role of board committees, and board and committee activities, is sparse. Our findings on this aspect of governance will contribute to this small yet growing body of governance literature.
The remainder of this paper is organized as follows. Section 2 describes the related literature and the hypotheses tested in this study. Section 3 discusses the data employed in this study. Section 4 presents our key results on the improvement of interest align-ment. Section 5 further examines the relation between corporate governance and inter-est alignment improvement. Section 6 discusses the additional analysis, and Section 7 concludes the paper.
Related literature
A related set of findings from spinoff literature claims that spinoff firms reduce agency cost by improving governance. Chemmanur and Yan (2004) argue that spinoffs improve efficiency through managerial discipline. As spinoff firms are more likely to be acquired by rivals, managers are presumably motivated to work harder and therefore bring efficiency improvement. Evidence from a more recent study by Chemmanur et al. (2014) suggests that spinoff improves total factor productivity of firms, starting from the first year and continuing for five years after spinoff. The productivity gain arises from decreases in employment, total salary and material costs. Since the improved productivity of spinoff firms stems from an increase in efficiency rather than an in-crease in output, and because the productivity inin-creases arise primarily within parent firms after spinoff, the authors argue that the evidence supports the view that spinoffs discipline managers for subsequent performance improvement.
Some studies also suggest that spinoffs are associated with good governance struc-tures. Seward and Walsh (1996) suggest that most of the board members of spun-off firms are outside directors. Ahn and Walker (2007) state that firms with better govern-ance tend to spin off and that the effective governgovern-ance structure in spinoff firms results in a higher market-to-book valuation after spinoff. Patro (2008) documents that block ownership for spun-off firms increases after spinoff, and that such increase is positively associated with subsequent performance and survival. Chemmanur et al. (2010) find that firms protected by having more antitakeover provisions (ATP) before spinoff are associated with higher announcement returns and enjoy greater post-spinoff operating performance improvements. Additionally, firms which reduce the number of ATP after spinoff are associated with more pronounced operating improvements. Evidence from Feng et al. (2015) indicates that CEOs of firms with stronger equity incentives are more likely to engage in spinoffs, while spinoff firms with weaker CEO equity incentives before the transaction are associated with stronger board independence and a higher percentage of institutional investors.
Another series of studies examines the impact of spinoff on contracting efficiency. Hite and Owers (1983) suggest improvement in contracting efficiency as a potential explan-ation for the positive abnormal returns associated with spinoff announcements. Similarly, Schipper and Smith (1983) explain that the value created in spinoff stems from the elim-ination of diseconomies of decision management and diseconomies of decision control.2 Aron (1991) provides a theoretical model to demonstrate that spinoff facilitates writing and enforcing performance-based contracts. Seward and Walsh (1996) empirically show that spinoff enables firms to implement more efficient control systems by using a correl-ation matrix on data related to the spun-off units. However, as these studies do not offer direct evidence regarding CEO compensation, we extend the contracting efficiency perspective by examining the effect of spinoffs on CEO compensation contracts.
greater incentive to write stronger performance-based CEO compensation contracts, promoting closer alignment between the interests of the CEO and shareholders. We refer to this as the“interest alignment hypothesis”.
In contrast, spinoff effectively increases the CEO’s exposure to firm-specific or idiosyn-cratic risk as the multi-divisional firm becomes less diversified after a spinoff. Thus, the CEO may also consider taking advantage of the spinoff transaction as an opportunity to hedge against the increased risk exposure by re-negotiating his/her compensation contract. From this perspective, the post-spinoff compensation contract will impair the interest alignment of the CEO and the shareholders. We refer this as the“risk aversion hypothesis”. The pay-performance sensitivity measure introduced by Jensen and Murphy (1990) offers a direct approach to examine whether spinoffs can improve contracting efficiency regarding CEO compensation contracts. In essence, this measure captures the extent of interest align-ment between the CEO and the shareholders. There is ample empirical evidence that CEO pay is positively tied to firm performance (Hall and Liebman1998; Murphy1999; Conyon and Murphy2000; Lilienfeld-Toal and Ruenzi2014). Such evidence indicates that the com-pensation contract promotes a closer interest alignment between the CEO and share-holders. However, some studies report an inverse relationship between pay-performance sensitivity and a firm’s risk level, supporting the risk aversion hypothesis (Aggarwal and Samwick1999; Jin2002; Garvey and Milbourn2003; Cao and Wang2013etc).3
Hence, if a firm takes the opportunity to improve contracting efficiency by restructuring the CEO compensation contract, one would expect the pay-performance sensitivity of the parent firm to experience a positive and significant improvement after spinoff, supporting the interest alignment hypothesis. Alternatively, if the CEO regards the spinoff as an opportunity to negotiate a compensation contract that better hedges against potential risk exposure, we would expect to observe a negative and significant change in pay-perform-ance sensitivity after spinoff, supporting the risk aversion hypothesis.
In this study, we maintain that spinoff offers an opportunity for firms to improve contracting efficiency. This is because spinoff separates the multi-divisional firm into two (or more) entities, making it easier and more effective for the market to monitor the performance of the post-spinoff parent firm. In addition, CEO performance is less susceptible to uncontrollable factors found in pre-spinoff multi-divisional organizations. Accordingly, firms will have greater incentives to design CEO compensation contracts with a stronger performance-based component as writing and enforcing such contracts becomes less costly. Consequently, the interest alignment for the CEO and share-holders would improve after spinoff (i.e., the interest alignment hypothesis). Putting this into the context of pay-performance sensitivity, the following is our hypothesis stated in an alternate form:
H1: CEO pay-performance sensitivity improves after spinoff (interest alignment hypothesis).
H2: CEO pay-performance sensitivity improvement is expected to be more pronounced for spinoff firms with stronger governance.
Finally, the enhancement of CEO pay-performance sensitivity is likely to be more sig-nificant for firms with greater improvement in corporate governance after the spinoff transaction. This leads us to hypothesize the following:
H3: Post-spinoff pay-performance sensitivity is positively associated with improvement in corporate governance from this transaction.
Data
Our spinoff sample is drawn primarily from the Thomson Merger and Acquisition SDC database. We identify completed spinoff transactions from the period spanning 1990 to 1997.4This sample period allows us to examine the variation of corporate governance among spinoff firms without a great deal of influence from government regulations such as SOX. This period allows us to examine greater variation of governance mecha-nisms voluntarily implemented by firms. These spinoff transactions were later verified by searching the Lexis-Nexis database using the keywords, “spinoff”, “spin off” and
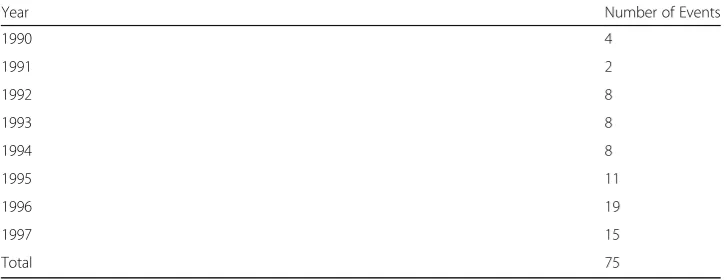
“spin-off”. This yields 160 transactions for the initial sample. To arrive at our final sam-ple, we exclude samples that are motivated by takeover defenses, mergers, bankruptcies and regulatory issues, spinoff firms that are tracking stock, ADRs, or in regulated in-dustries (SIC 4900–4999 and SIC 6000–6999). We also ensure that the sample firms were not previously an equity carve-out. In addition, 17 observations have been ex-cluded due to the absence of CEO compensation data. As a result, our final sample for the analysis is comprised of 75 firms. The profile of the sample distribution by year is reported in Table1.
Fiscal year stock return is used as a proxy for shareholders’ wealth in estimating pay-performance elasticity. This is computed by compounding the monthly stock returns obtained from the CRSP database. To mitigate the potential impact from
Table 1Sample distribution by year
Year Number of Events
1990 4
1991 2
1992 8
1993 8
1994 8
1995 11
1996 19
1997 15
Total 75
outliers, firms with annual returns above 3.5 are excluded from further analysis.5 CEO compensation typically includes 4 components: (1) salary and bonus, (2) stock op-tions, (3) restricted stock and (4) other compensation.6Components (1) and (4) represent cash compensation whereas (2) and (3) represent equity compensation. The primary source of CEO compensation data is the Standard and Poor’sExecuCompdatabase. The four components of CEO compensation identified above are available fromExecuComp. However, compensation data for spinoff firms prior to 1992 and firms outside the S&P 1500 are not available. Given this fact, we manually collected compensation data from the firms’proxy statements in theDirect Edgerdatabase for those not available from Execu-Comp. Of the four components of CEO compensation, stock option grants are not re-ported in monetary terms on the proxy statements. To ensure consistency with the data in ExecuComp, we adopted the ExecuComp modified Black-Scholes option valuation methodology to compute the monetary value for option grants in the manually- collected compensation data.
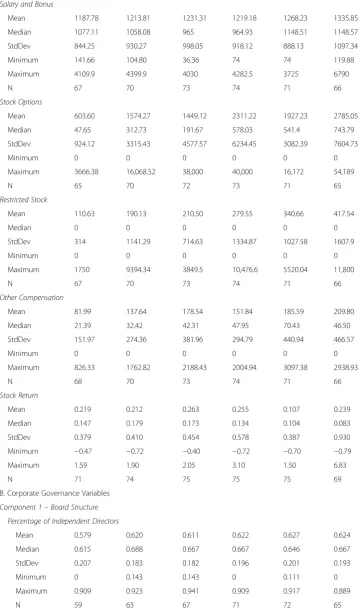
The summary statistics on the compensation and performance variables for the spinoff parent firms are presented in Panels A and B of Table 2, respectively. Year 0 in the table denotes the year of spinoff. The period reported in Table 2
includes six years in total starting from two years before spinoff (i.e., Year −2) and ending three years after spinoff (i.e., Year + 3). From Panel A in Table 2, we can see that CEOs’compensation, on average, is much higher after spinoff. Com-paring the components of CEO compensation from Year −2 to the post-spinoff periods (i.e., Years + 1 to + 3), CEOs receive much higher equity-based compensa-tion (stock opcompensa-tions and restricted stocks) after spinoff. Such CEO compensacompensa-tion characteristics are consistent with findings of Seward and Walsh (1996), and Jen-sen et al. (2004).
The summary statistics for stock returns can also be found in Panel A in Table
2. The mean stock return increases from 21.2% in Year −1 to 26.3% in Year 0, and remains high at 25.5% in Year + 1. We have also computed summary statistics on the size of spinoffs, but they are not tabulated in order to conserve space. Fol-lowing previous literature, spinoff size is defined as the market value of the spun-off unit divided by the combined market value of the post-spinoff parent and spun-off unit.7 For our sample, the mean (median) spinoff size is about 30.2% (24.3%), generally comparable to those reported by Burch and Nanda (2003) and Ahn and Denis (2004).
Table 2Descriptive statistics
A. CEO Compensation and Performance Variables
Salary and Bonus
Mean 1187.78 1213.81 1231.31 1219.18 1268.23 1335.85
Median 1077.11 1058.08 965 964.93 1148.51 1148.57
StdDev 844.25 930.27 998.05 918.12 888.13 1097.34
Minimum 141.66 104.80 36.36 74 74 119.88
Maximum 4109.9 4399.9 4030 4282.5 3725 6790
N 67 70 73 74 71 66
Stock Options
Mean 603.60 1574.27 1449.12 2311.22 1927.23 2785.05
Median 47.65 312.73 191.67 578.03 541.4 743.79
StdDev 924.12 3315.43 4577.57 6234.45 3082.39 7604.73
Minimum 0 0 0 0 0 0
Maximum 3666.38 16,068.52 38,000 40,000 16,172 54,189
N 65 70 72 73 71 65
Restricted Stock
Mean 110.63 190.13 210.50 279.55 340.66 417.54
Median 0 0 0 0 0 0
StdDev 314 1141.29 714.63 1334.87 1027.58 1607.9
Minimum 0 0 0 0 0 0
Maximum 1750 9394.34 3849.5 10,476.6 5520.04 11,800
N 67 70 73 74 71 66
Other Compensation
Mean 81.99 137.64 178.54 151.84 185.59 209.80
Median 21.39 32.42 42.31 47.95 70.43 46.50
StdDev 151.97 274.36 381.96 294.79 440.94 466.57
Minimum 0 0 0 0 0 0
Maximum 826.33 1762.82 2188.43 2004.94 3097.38 2938.93
N 68 70 73 74 71 66
Stock Return
Mean 0.219 0.212 0.263 0.255 0.107 0.239
Median 0.147 0.179 0.173 0.134 0.104 0.083
StdDev 0.379 0.410 0.454 0.578 0.387 0.930
Minimum −0.47 −0.72 −0.40 −0.72 −0.70 −0.79
Maximum 1.59 1.90 2.05 3.10 1.50 6.83
N 71 74 75 75 75 69
B. Corporate Governance Variables
Component 1–Board Structure Percentage of Independent Directors
Mean 0.579 0.620 0.611 0.622 0.627 0.624
Median 0.615 0.688 0.667 0.667 0.646 0.667
StdDev 0.207 0.183 0.182 0.196 0.201 0.193
Minimum 0 0.143 0.143 0 0.111 0
Maximum 0.909 0.923 0.941 0.909 0.917 0.889
Table 2Descriptive statistics(Continued)
Percentage of Interlocked Directors
Mean 0.039 0.029 0.025 0.024 0.024 0.023
Median 0 0 0 0 0 0
StdDev 0.069 0.052 0.052 0.054 0.060 0.061
Minimum 0 0 0 0 0 0
Maximum 0.333 0.2 0.231 0.308 0.308 0.333
N 58 62 66 71 72 65
Percentage of Female Directors
Mean 0.074 0.080 0.079 0.077 0.080 0.089
Median 0.083 0.083 0.083 0.083 0.083 0.091
StdDev 0.075 0.068 0.070 0.068 0.071 0.072
Minimum 0 0 0 0 0 0
Maximum 0.3 0.231 0.25 0.273 0.3 0.273
N 59 63 67 71 72 65
Year−2 Year−1 Year 0 Year + 1 Year + 2 Year + 3 CEO Power
Mean 1.32 1.38 1.35 1.37 1.46 1.32
Median 1 1 1 1 1.5 1
StdDev 0.68 0.68 0.71 0.73 0.79 0.74
Minimum 0 0 0 0 0 0
Maximum 3 3 3 3 3 3
N 59 63 66 70 70 63
Component 2–Committee Independence
Percentage of Independent Directors in Audit Committee
Mean 0.82 0.83 0.84 0.85 0.87 0.84
Median 1 1 1 1 1 1
StdDev 0.23 0.22 0.19 0.24 0.23 0.26
Minimum 0 0 0.33 0 0 0
Maximum 1 1 1 1 1 1
N 57 61 64 70 71 63
Percentage of Independent Directors in Compensation Committee
Mean 0.80 0.83 0.85 0.86 0.87 0.88
Median 0.8 1 1 1 1 1
StdDev 0.24 0.26 0.26 0.26 0.25 0.22
Minimum 0 0 0 0 0 0
Maximum 1 1 1 1 1 1
N 57 59 61 69 69 61
Component 3–Board and Committee Meetings Board Meetings
Mean 7.71 7.31 8.16 7 7.14 7.18
Median 8 7 8 7 6 6
StdDev 2.68 2.8 3 2.22 3.1 2.54
Minimum 1 1 1 1 1 1
Maximum 16 15 18 12 24 18
Measures of corporate governance
We examine four broad components of corporate governance: board structure, committee independence, board and committee activities, and institutional ownership. Variables included in each component are drawn from the previous literature.
Board structure
As indicated by Fama and Jensen (1983), the board of directors is the apex of corporate governance. The characteristics of board members as a whole are crucial to the Table 2Descriptive statistics(Continued)
Audit Committee Meetings
Mean 3.38 3.46 3.26 3.35 3.22 3.48
Median 3 3 3 3 3 3
StdDev 1.40 1.43 1.57 1.47 1.30 1.78
Minimum 1 0 0 0 1 1
Maximum 7 7 8 8 7 11
N 58 63 66 66 64 61
Compensation Committee Meetings
Mean 4.63 4.92 4.79 4.45 4.47 4.39
Median 4 5 5 4 4 4
StdDev 2.02 1.97 2.36 1.92 2.13 2.05
Minimum 1 1 0 1 1 1
Maximum 9 9 13 9 13 10
N 56 59 63 66 62 59
Component 4–Institutional Ownership
Mean 0.491 0.521 0.538 0.567 0.573 0.580
Median 0.535 0.568 0.571 0.603 0.633 0.632
StdDev 0.186 0.195 0.198 0.199 0.190 0.198
Minimum 0 0.059 0.049 0.044 0.039 0.057
Maximum 0.791 0.935 1 0.993 0.846 0.900
N 72 72 73 73 70 64
effectiveness of a firm’s governance. The first variable we include in this component is the percentage of outside independent directors on the board. Independent outside di-rectors are didi-rectors who do not have outside business or a family relationship with the firm, and have not been employed by the firm in the previous 3 years. As indicated by prior studies (Rosenstein and Wyatt 1990; Karamanou and Vafeas 2005; Cornett et al.
2008; Chhaochharia and Grinstein2009; Nguyen and Nielsen2010), independent out-side directors can serve as effective monitors of the company as they are not influenced by a firm’s management and can thus exert greater pressure on management due to more independent views as compared to inside directors.8 Armstrong et al. (2014) document that the proportion of independent directors on the board is positively asso-ciated with transparency. It thus follows that a higher percentage of outside independ-ent directors on the board represindepend-ents more effective governance.
The next variable included in this component is the percentage of interlocked directors. Two directors are considered“interlocked”when one director is serving as a board mem-ber of the other director’s company. The close relationship between interlocked directors can impair board independence by mutually influencing each other’s choices for their per-sonal advantage, thereby detracting from the boards’monitoring role. Thus, a higher per-centage of interlocked directors indicates poor corporate governance. This view is expressed by a number of corporate governance studies (Hallock 1997; Core et al.1999; Larcker et al.2005; Bizjak et al.2009;, Dah and Frye2017), along with regulators and pro-fessional bodies (the Securities and Exchange Commission and the National Association of Corporate Directors).
As a measure of board diversity, we use the percentage of female directors. Morck (2008) states that a heterogeneous board can eliminate directors’tendencies to submit to authority, such as the CEO, resulting in broader perspectives and lower levels of groupthink. Lavy and Schlosser (2011) suggest that having a diverse board can promote peer monitoring between genders in the decision making process. Furthermore, Carter et al. (2003), Adams and Fer-reira (2009), García-Meca et al. (2015), and Green and Homroy (2018) document that board diversity, proxied by the percentage of female directors, promotes better monitoring and leads to improved firm performance. Additionally, a recent study by Schwartz-Ziv (2017) finds that boards are more active when more than 3 women are present in board meetings; boards with at least 3 directors of each gender are 79% more active; and underperforming CEOs are likely to be replaced by more gender-balanced boards.
The final variable included in this component is CEO Power. CEO Power is a meas-ure of structural power which is a composite score based on three indicator variables: the CEO being the chairman of the board, the CEO being the founder of the firm, and the CEO being the only insider on the board. Thus, the range of this composite score varies from 0 to 3, where a higher score represents stronger CEO influence on the board and therefore on corporate decisions. These three measures of CEO Power have been used previously in the literature (Adams et al.2005; Cheng2008; Liu and Jiraporn
personal leverage and the firm’s leverage (Korkeamäki et al. 2017), and difficulty of removal by the board (Morck et al.1989).
Board committee Independence
For this component, we examine the independence of two important board commit-tees: the audit and compensation committees appointed by a board. Klein (1998) argues that the audit committee can mitigate agency problems by ensuring the presence of proper internal controls in the organization; whereas the compensation committee does so by designing incentive schemes which promote interest alignment among share-holders and managers. Armstrong et al. (2014) also find that audit committee inde-pendence is associated with higher-quality financial reporting and stronger commitment to internal controls. Following Klein (1998), Anderson et al. (2004), Uzun et al. (2004), and Guo and Masulis (2015), we use the percentage of independent direc-tors on these two committees as a measure of committee independence. The intuition is straightforward: just as more independent directors on a board enhance the board’s monitoring function, so should their presence on these committees. Klein (2002), Anderson et al. (2004) and Vafeas (2003) provide consistent evidence for this view.
Board and committee meetings
The performance and effectiveness of a board and its committees are related to the work carried out by the board and committee members. Following Vafeas (1999), Beas-ley et al. (2000), and Karamanou and Vafeas (2005), we use the number of board and committee meetings to measure the effort and time spent by board and committee members. Active boards and committees meet more often and thus increase the amount of time spent on monitoring efforts, consequently improving governance (Conger et al. 1998; Anderson et al. 2004; Karamanou and Vafeas 2005; Andres and Vallelado2008; Chou et al.2013).
Institutional ownership
Jensen (1993) suggests that institutional investors have both the incentive and the ability to actively monitor management to safeguard their financial interests in the firm. In line with prior studies such as Core et al. (1999), Hartzell and Starks (2003), Yun (2009), Boone and White (2015), Crane et al. (2016), and Bena et al. (2017), we use the level of institutional ownership as a measure of external monitoring.
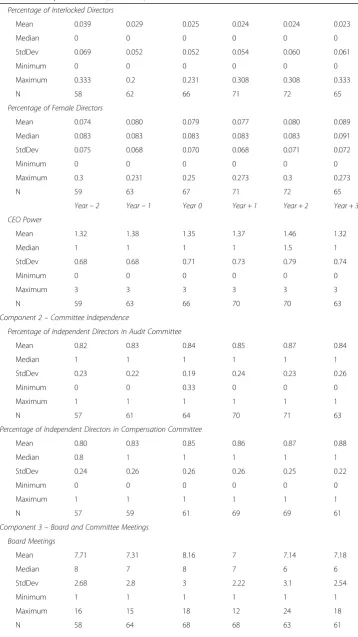
evidence from the summary statistics broadly suggests that board structure for parent firms improves after spinoff.
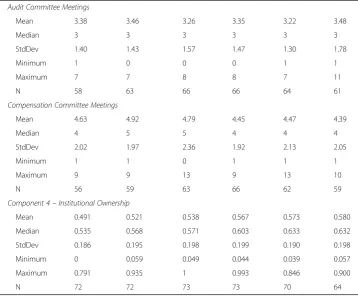
In terms of committee independence, both audit and compensation committees be-come more independent after spinoff. From Year−2 to Year + 3, the mean percentage of independent directors in audit and compensation committees has increased by 2 percentage points and 8 percentage points, respectively. In fact, the average percentage of independent directors among these two committees are 80% or above throughout the event years. Taken together, spinoff firms on average have very independent board committees, and the level of independence increases after spinoff. Our findings are consistent with those of Seward and Walsh (1996), suggesting that the majority of the members in compensation committees are outside directors.
With regards to board and committee meetings, the median board meets 6 to 8 times per year; the median audit committee meets 3 times per year; and the median compensation committee meets 4 to 5 times per year. These observations are consistent with Vafeas (1999) and Karamanou and Vafeas (2005). In addition, the average board and compensation committee meet slightly more during Year−1 to Year 0. This is likely related to the occur-rence of the spinoff event. With the exception of the audit committee, the mean board and compensation committee meetings are reduced slightly from Year−2 to Year + 3.
Institutional investors, on average, own more equity after spinoff: the mean (median) ownership increases from 49.1% (53.5%) in Year−2 to 58% (63.2%) in Year + 3. The in-crease in institutional ownership after spinoff indicates an improvement in external monitoring.
Overall, the statistics suggest that the general governance structure improves after spinoff, consistent with our conjecture.
Interest alignment and spinoff
Pay-performance sensitivity before and after spinoff
The purpose of this study is to examine whether spinoff improves CEO-shareholder interest alignment. We first examine the pay-performance sensitivity for spinoff firms before and after spinoff by estimating the following model:
lnðCEO payt=CEO payt−1Þ ¼β1þβ2Δðshareholder wealthtÞ þβ3Δðshareholder wealtht−1Þ ð1Þ
Equation (1) is based on the pay-performance sensitivity model by Hall and Liebman (1998) and Murphy (1999), which tests the association between the change in both contemporaneous and lagged shareholder wealth on the change in CEO compensa-tion.9The dependent variable is the first difference of CEO compensation. Consistent with prior compensation literature, we use two alternate measures of CEO compensa-tion: the first is cash compensation consisting of salary and bonus only, and the second is total compensation consisting of salary and bonus, stock options and restricted stock grants, and other compensation.
improves immediately, and in the long term after spinoff. Improved pay-performance sensitivity coefficients (i.e., β2and β3) after spinoff would suggest better interest
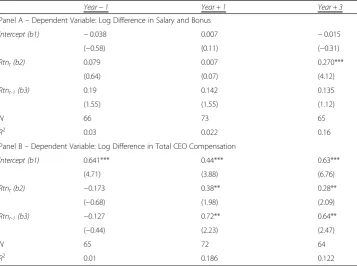
align-ment whereas a deteriorated trend in these coefficients would suggest risk aversion. Table 3 shows the results of the yearly pay-performance sensitivity regressions for Year−1, Year + 1 and Year + 3. Panel A uses salary and bonus as a proxy for a CEO’s wealth whereas Panel B uses total compensation. The R-squares for all specifications tend to be low, consistent with the extant pay-performance sensitivity literature (Hall and Liebman1998; Murphy1999; and Conyon and Murphy2000). In spite of this, the R-square for the post spinoff regressions are much higher than pre-spinoff counter-parts. From the perspective of precision, this result suggests that post-spinoff pay-performance sensitivity coefficients are considered better than those in the pre-spinoff year.
As can be seen from Panel A in Table3, CEO’s cash compensation (salary and bonus only) is not statistically significantly related to firm performance, except for Year + 3, in which the coefficient on contemporaneous stock returns is positive and significant at the 1% level. Thus, there is some evidence of improved interest alignment in the longer horizon after spinoff.
The results in Panel B where CEO’s total compensation is used present much stron-ger evidence that spinoffs improve interest alignment. Specifically, CEO total
Table 3Yearly pay-performance elasticity regressions: stock returns
Year−1 Year + 1 Year + 3
Panel A–Dependent Variable: Log Difference in Salary and Bonus
Intercept (b1) −0.038 0.007 −0.015
(−0.58) (0.11) (−0.31)
Rtnt(b2) 0.079 0.007 0.270***
(0.64) (0.07) (4.12)
Rtnt-1(b3) 0.19 0.142 0.135
(1.55) (1.55) (1.12)
N 66 73 65
R2 0.03 0.022 0.16
Panel B–Dependent Variable: Log Difference in Total CEO Compensation
Intercept (b1) 0.641*** 0.44*** 0.63***
(4.71) (3.88) (6.76)
Rtnt(b2) −0.173 0.38** 0.28**
(−0.68) (1.98) (2.09)
Rtnt-1(b3) −0.127 0.72** 0.64**
(−0.44) (2.23) (2.47)
N 65 72 64
R2 0.01 0.186 0.122
This table reports results on the yearly pay-performance elasticity regressions for the parent firms before and after spinoff using stock returns as a proxy for shareholders’wealth. The Year represents the event year to the spinoff event (Year 0). Panels A and B show the pay-performance elasticity regressions using the log difference in Salary and Bonus and Total CEO Compensation to proxy for CEOs’wealth. Total CEO Compensation is measured by the cash compensation (i.e., salary and bonus, and other compensation), with stock options and restricted stocks grants for the year. Stock return is the annual stock return for the firm’s fiscal year and is computed by compounding the monthly returns obtained from theCRSPdatabase.Rtntis the variable for contemporaneous returns andRtnt-1is the variable for lagged return. Thet
-statistics, which are based on White standard errors robust to within firms’cluster correlation, are reported in parenthesis. ***, ** and * denote significance at the 1%, 5%, and 10% level respectively. Variation in sample size is due to
compensation before spinoff is not significantly related to shareholders’wealth. But for both Year + 1 and Year + 3, both the contemporaneous and lagged pay-performance sensitivity coefficients are positive and significant at the 5% level. Interpreting this find-ing with the correspondfind-ing post spinoff estimates in Panel A, stock options and re-stricted stocks granted to the CEO after spinoff seem to improve interest alignment. This is consistent with the CEO compensation literature findings that equity compen-sation is a key component in driving the total pay-performance sensitivity. This is also consistent with the notion that the use of equity-based compensation promotes a closer interest alignment between a CEO and shareholders (Jensen and Murphy 1990; Hall and Liebman1998; Murphy1999; Conyon and Murphy2000).
The key insight from the yearly regressions indicates that spinoff improves pay-performance sensitivity. This finding is more apparent in cases in which total CEO compensation is used. This evidence also provides a first support to our interest alignment hypothesis.
Panel pay-performance sensitivity analysis
Having established the trend that spinoff improves pay-performance, we next proceed to formally testing whether the improvement in interest alignment is statistically significant (i.e., hypothesis H1). We perform our analysis by using the following panel regression model:
lnðCEOpayt=CEOpayt−1Þ ¼β1þβ2ΔðshareholderwealthtÞ þβ3Δðshareholderwealtht−1Þ
þβ4SpDþβ5SpDΔðshareholderwealthtÞ þβ6SpDΔðshareholderwealtht−1Þ ð2Þ
SpD is a dummy variable which takes a value of 0 to indicate a pre-spinoff year and a value of 1 to indicate a post-spinoff year. We first estimate Equation (2) using one pre-spinoff year (Year−1) and one post-spinoff year (Year + 1), and to ensure robustness and persistence of the results in the long run, we also repeat the test by combining the Year−1 and a sample composed of all the post spinoff event years (i.e., Year + 1 to Year + 3).
The key variables of interest in this model are the interaction terms: SpD×Δ (share-holder wealtht)and SpD×Δ(shareholder wealtht-1). Both variables capture the change in
pay-performance sensitivity before and after the spinoff event. If spinoffs improve CEO contracting efficiency according to the interest alignment hypothesis, we expect the co-efficients of these two interaction terms (i.e.,β5,β6) to be positive and significant.
Alter-natively, the risk aversion hypothesis will predict the opposite.
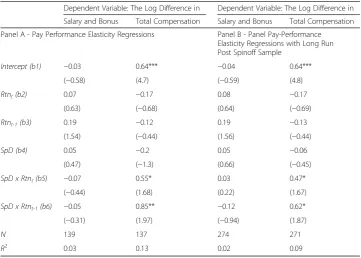
Table4displays the results for the panel pay-performance sensitivity regressions. Panel A reports the panel regressions including only the pre-spinoff year (Year−1) and the immedi-ate post spinoff year (Year + 1), whereas Panel B extends the sample by combining two add-itional post spinoff years (i.e., Year + 2 and Year + 3) in order to capture the long-run impact. We can see from the short-run regression results in Panel A of Table 4, the inter-action terms in the cash compensation model are insignificant at the conventional sig-nificance levels, but the interaction terms in the total compensation model are both statistically significant at the 5% level. These results are consistent with yearly regres-sions in Table3, suggesting that in the short run, CEO total compensation, with equity pay included, is much more sensitive to firm performance after spinoff.
cash compensation and firm performance, but do improve CEO total pay-performance sensitivity in the long run. Specifically, the interaction terms remain insignificant in the cash compensation model, and are positive and significant at the 5% level in the total compensation model. These findings are consistent with the yearly regression results observed in Table3.
Overall, our findings in Table 4 suggest that, in both the short run (one year after spinoff ) and the long run (three years after spinoff ), there is a significant im-provement in the association between the annual change in total CEO pay and market-based annual shareholder wealth creation. Again, equity compensation plays a major role in improving interest alignment for spinoff firms. Our results from both Tables 3 and 4 support the interest alignment. This finding complements the spinoff value gain explanation advanced by Hite and Owers (1983) and Schipper and Smith (1983); both of these studies suggest that spinoff creates value by im-proving contracting efficiency. In addition, our empirical evidence supports the the-oretical model from Aron (1991), suggesting that spinoff allows the firm to write and enforce performance-based incentive contracts in a less costly manner. From a broader perspective, our results are consistent with the view from a strand of spin-off studies (Seward and Walsh 1996; Burch and Nanda 2003; and Ahn and Walker
2007) which suggest that spinoff creates value by mitigating agency costs present in multi-divisional organizations.
Table 4Pay-performance elasticity panel regressions
Dependent Variable: The Log Difference in Dependent Variable: The Log Difference in
Salary and Bonus Total Compensation Salary and Bonus Total Compensation
Panel A - Pay Performance Elasticity Regressions Panel B - Panel Pay-Performance Elasticity Regressions with Long Run Post Spinoff Sample
Intercept (b1) −0.03 0.64*** −0.04 0.64***
(−0.58) (4.7) (−0.59) (4.8)
Rtnt(b2) 0.07 −0.17 0.08 −0.17
(0.63) (−0.68) (0.64) (−0.69)
Rtnt-1(b3) 0.19 −0.12 0.19 −0.13
(1.54) (−0.44) (1.56) (−0.44)
SpD (b4) 0.05 −0.2 0.05 −0.06
(0.47) (−1.3) (0.66) (−0.45)
SpD x Rtnt(b5) −0.07 0.55* 0.03 0.47*
(−0.44) (1.68) (0.22) (1.67)
SpD x Rtnt-1(b6) −0.05 0.85** −0.12 0.62*
(−0.31) (1.97) (−0.94) (1.87)
N 139 137 274 271
R2 0.03 0.13 0.02 0.09
This table reports results on the panel pay-performance elasticity regression for the pre- and post-spinoff parent. Panel A shows the panel regression results combines one pre-spinoff year (Year−1) sample and one post-spinoff year (Year + 1) sample. Panel B shows the panel regression estimation combines the same pre-spinoff sample with three post-spinoff years (Year + 1 to Year + 3) sample. Parents firms’sample is taken for both pre- and post-spinoff period. Both the log difference in salary and bonus and total CEO compensation are used as proxy for the dependent variable as indicated in the table.SpDis an indicator variable which takes a value of 0 before spinoff and 1 otherwise. All other variables are previously defined in Table3. In both panels,t-statistics, which are based on White standard errors robust to within firms’ cluster correlation, are reported in parenthesis. ***, ** and * denote significance at the 1%, 5%, and 10% level
Governance and interest alignment of spinoff firms
The relationship of corporate governance to interest alignment of spinoff firms
In this section, we examine the effect of corporate governance on interest alignment. This is a natural extension of our analyses above as corporate governance aims to foster interest alignment between shareholders and managers. To do so, we modify Equation (2) with the inclusion of governance variables:
lnðCEOpayt=CEOpayt−1Þ ¼β1þβ2ΔðshareholderwealthtÞ þβ3Δðshareholderwealtht−1Þ
þβ4SpDΔðshareholderwealthtÞ þβ5SpDΔðshareholderwealtht−1Þ þβ6RCG
þβ7SpDþβ8SpDΔðshareholderwealthtÞ RCGþβ9SpDΔðshareholderwealtht−1Þ
RCGþIndustryDummiesþY earDummies
ð3Þ
The new variable included in Equation (3) is RCG, which represents the rank of each governance component (board structure, committee independence, board and committee meetings, and institutional ownership) and the overall rank averaged across the ranks of the four components. The use of this rank makes it easier to compare the effect of each corporate governance component and to assess the im-pact of a firm’s overall governance. Accordingly, in the five models we present in Table 5, the governance rank variable RGC denotes the rank on each of the four components as discussed in Section 3.1 and the rank of the aggregated governance components. Briefly, Component 1 is the rank of board structure, which includes the percentage of outside independent directors, the percentage of interlocked di-rectors and CEO Power; Component 2 is the rank of committee independence, which comprises the percentage of outside independent directors in compensation and audit committees; Component 3 is the rank of board and committee activities, which consists of the number of board meetings per year, and the number of audit and compensation committee meetings per year; Component 4 is the rank of the percentage of shares owned by institutional investors; and Component Total is the averaged rank of the four components above.
The key explanatory variables in Equation (3) are the RCG variable and the three-way interaction terms. Equation (3) is estimated with panel data, spanning from Year −1 to Year + 3. If corporate governance is related to the improvement in interest alignment as hypothesized, the coefficient β5 is expected to be positive
and significant. In addition, if the interest alignment for the stronger governance group is more pronounced as hypothesized, the coefficients β8, β9 or both are
ex-pected to be positive and significant. Table 5 reports the regressions results. As can be seen in Table 5, the coefficients for RCG on all four corporate govern-ance components as well as the overall governgovern-ance score are positive. Moreover, the coefficients on board structure, institutional ownership, and the overall govern-ance score are statistically significant at 10% or better. These results are generally consistent with Hartzell and Starks (2003), who document a positive association between institutional ownership and CEO pay-performance sensitivity, and Seward and Walsh (1996), who argue that spinoffs facilitate the implementation of effective governance and control mechanisms.
term with board and committee meetings (Component 3), which is negative and statistically significant at 5%. This suggests that firms with more board and com-mittee activities are associated with weaker interest alignment. This is broadly con-sistent with findings from Vafeas (1999) that firm value is inversely associated with board meetings.
The change in governance and post-spinoff interest alignment
Empirical results from the previous section have provided some evidence that govern-ance structure present in spinoff firms is associated with interest alignment. To sharpen our results, we examine the effect of the change in corporate governance on CEO pay-performance sensitivity by estimating the following model:
Table 5Corporate governance & pay-performnace elasticity regressions Dependent Variable: Log Difference in Total Compensation
Component 1 Board Structure
Component 2 Committee Independence
Component 3 Board and Committee Meetings
Component 4 Institutional Ownership
Component Total
Intercept (b1)
0.634** 0.955*** 0.803*** 0.657*** 0.472
(2.21) (3.92) (3.19) (3.21) (1.45)
Rtnt(b2) −0.102 0.010 −0.046 −0.156 0.039
(−0.42) (0.04) (−0.15) (−0.67) (0.14)
Rtnt-1(b3) −0.139 −0.063 −0.226 −0.095 0.057
(−0.53) (−0.24) (−0.79) (−0.35) (0.21)
SpD × Rtnt
(b4)
0.155 0.031 0.338 0.352 0.252
(0.38) (0.09) (0.73) (1.2) (0.52)
SpD × Rtnt-1
(b5)
0.732* 0.445 1.077*** 0.620** 0.771
(1.86) (1.27) (2.67) (2.06) (1.56)
RCG (b6) 0.002* 0.000 0.002 0.007** 0.001*
(1.75) (0.18) (1.41) (2.38) (1.81)
SpD (b7) −0.291** −0.224* −0.28* −0.203 −0.172
(−2.33) (−1.88) (−1.86) (−1.48) (−1.39)
SpD× RCG × Rtnt(b8)
0.001 0.003 −0.001 −0.001 0.000
(0.49) (0.82) (−0.36) (−0.39) (−0.31)
SpD× RCG × Rtnt-1(b9)
−0.002 −0.002 −0.006** −0.008 −0.002
(−0.87) (−0.74) (−2.11) (−1.35) (−1.32)
Industry Dummies
Included Included Included Included Included
Year Dummies Included Included Included Included Included
N 257 247 233 262 223
R2 0.211 0.211 0.194 0.213 0.193
lnðCEOpayt=CEOpayt−1Þ ¼β1þβ2ΔðshareholderwealthtÞ þβ3Δðshareholderwealtht−1Þ
þβ4ΔRCGþβ5ΔðshareholderwealthtÞ ΔRCGþβ6Δðshareholderwealtht−1Þ ΔRCG ð4Þ
The ΔRCG variable in Equation (4) is the rank change for each of the four govern-ance components as well as the overall governgovern-ance score. To construct eachΔRCG, we first obtain the average of a corporate governance variable rank in Year−2 and Year− 1, and then the average of the same variable ranks in Year + 1 to Year + 3. We obtain each ΔRCG by subtracting the post-spinoff average rank from the pre-spinoff rank for each corporate governance variable. A higher ΔRCG value represents a stronger gov-ernance improvement. If spinoff firms’post spinoff interest alignment is associated with the change in corporate governance as hypothesized, the coefficientsβ5, β6or both are
expected to be positive and significant.
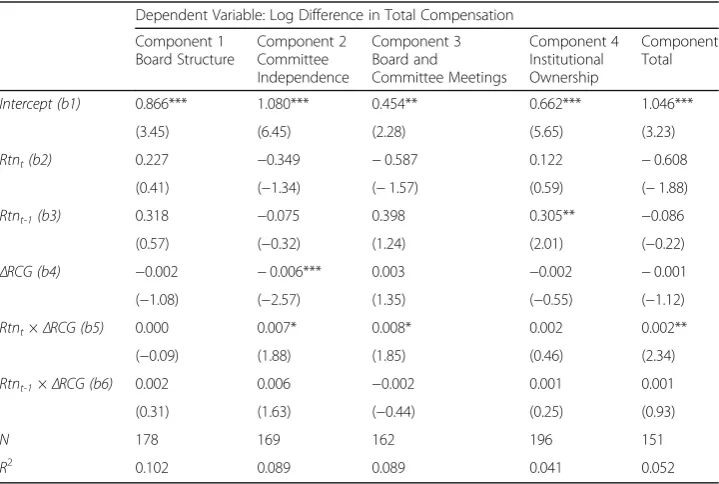
The results for this analysis are displayed in Table6. The coefficient forRtnt×ΔRCG
for committee independence (Component 2) and board and committee activities (Com-ponent 3) are positive and significant at the 10% level. In other words, improving com-mittee independence and board and comcom-mittee activities can reduce agency problems by promoting interest alignment of firms after spinoff. This result is consistent with the view from Klein (1998) that committee independence is important regarding their roles; and the argument from Conger et al. (1998) that frequency of board meetings is a fac-tor in board effectiveness. From a broader standpoint, it also supports the contention
Table 6Change in governance & post spinoff pay-performance elasticity regressions Dependent Variable: Log Difference in Total Compensation
Component 1 Board Structure
Component 2 Committee Independence
Component 3 Board and
Committee Meetings
Component 4 Institutional Ownership
Component Total
Intercept (b1) 0.866*** 1.080*** 0.454** 0.662*** 1.046***
(3.45) (6.45) (2.28) (5.65) (3.23)
Rtnt(b2) 0.227 −0.349 −0.587 0.122 −0.608
(0.41) (−1.34) (−1.57) (0.59) (−1.88)
Rtnt-1(b3) 0.318 −0.075 0.398 0.305** −0.086
(0.57) (−0.32) (1.24) (2.01) (−0.22)
ΔRCG (b4) −0.002 −0.006*** 0.003 −0.002 −0.001
(−1.08) (−2.57) (1.35) (−0.55) (−1.12)
Rtnt×ΔRCG (b5) 0.000 0.007* 0.008* 0.002 0.002**
(−0.09) (1.88) (1.85) (0.46) (2.34)
Rtnt-1×ΔRCG (b6) 0.002 0.006 −0.002 0.001 0.001
(0.31) (1.63) (−0.44) (0.25) (0.93)
N 178 169 162 196 151
R2 0.102 0.089 0.089 0.041 0.052
from prior studies that committee independence improves firms’ governance (Klein
2002; Anderson et al.2004; and Vafeas2003; etc.).
For the overall change in the governance score, Component Total, the coefficients for both interaction terms are positive, with the contemporaneous interaction term being significant at the 5% level. Thus, the improvements in the overall governance mecha-nisms have a positive influence on pay-performance sensitivity. Therefore, the evidence lends support to hypothesis H4, which is consistent with the argument from Seward and Walsh (1996) that spinoff facilitates efficient governance and control practices. Taken together, the results support our hypothesis that improvement in corporate governance mechanisms enhances CEO pay-performance sensitivity after spinoffs.
Additional tests
Given that spinoff is an outcome of a firm’s choice, the spinoff sample may not repre-sent a random one. As a result, it is possible that underlying factors that motivate firms to spin off entities can also be correlated with the improvement in pay-performance elasticity, similar to an omitted variable problem.
To address the selection bias issue, we follow Heckman’s two stage regression procedure (Heckman1979). In essence, the first stage employs the Probit model to esti-mate the probability that a firm undertakes a spinoff based on their underlying charac-teristics. The Inverse Mills ratio of the Probit regression, representing the likelihood of the spinoff decision, is obtained and entered into the second stage regression as an ex-planatory variable to re-estimate the pay-performance elasticity (i.e., Model 2).
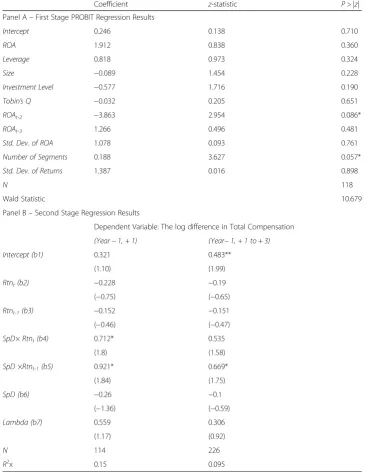
For the first stage of the Heckman procedure, we obtain the matched firms by select-ing one firm which has the same 4-digit SIC code, closest in size (proxied by Total As-sets) as the sample firms, and in the same year and month of the spinoff distribution. The sample firms are combined with the matched firms to yield a pooled sample of 118 firms. The explanatory variables for the first stage regression include ROA (defined as operating income before extraordinary items divided by total assets), standard devi-ation of the past 3 years of ROAs, leverage (calculated by total debt divided by total as-sets), size (proxy by total asas-sets), investment level (calculated by dividing capital expenditures by total sales), Tobin’s Q (defined as the market value of total assets di-vided by the book value of total assets, where the market value is computed by book value of total assets plus market value of common equity minus book value of common equity and deferred taxes), the number of business segments, and the standard devi-ation of monthly returns. All variables for the first-stage regression are measured at Year −1 in order to represent the parent firms’characteristics immediately before the spinoff decision. The results of the first stage regression are reported in Panel A of Table 7. The results in this panel suggest that firms with poor prior performance and greater structural complexity are more likely to spin off. The inverse Mill’s ratio ob-tained from this regression is then included as an explanatory variable to re-estimate Model (2) in the second stage.
Table 7Second-stage results of Heckman two-stage estimation
Coefficient z-statistic P > |z|
Panel A–First Stage PROBIT Regression Results
Intercept 0.246 0.138 0.710
ROA 1.912 0.838 0.360
Leverage 0.818 0.973 0.324
Size −0.089 1.454 0.228
Investment Level −0.577 1.716 0.190
Tobin’s Q −0.032 0.205 0.651
ROAt-2 −3.863 2.954 0.086*
ROAt-3 1.266 0.496 0.481
Std. Dev. of ROA 1.078 0.093 0.761
Number of Segments 0.188 3.627 0.057*
Std. Dev. of Returns 1.387 0.016 0.898
N 118
Wald Statistic 10.679
Panel B–Second Stage Regression Results
Dependent Variable: The log difference in Total Compensation
(Year−1, + 1) (Year−1, + 1 to + 3) Intercept (b1) 0.321 0.483**
(1.10) (1.99)
Rtnt(b2) −0.228 −0.19
(−0.75) (−0.65)
Rtnt-1(b3) −0.152 −0.151
(−0.46) (−0.47)
SpD× Rtnt(b4) 0.712* 0.535
(1.8) (1.58)
SpD ×Rtnt-1(b5) 0.921* 0.669*
(1.84) (1.75)
SpD (b6) −0.26 −0.1
(−1.36) (−0.59)
Lambda (b7) 0.559 0.306
(1.17) (0.92)
N 114 226
R2x 0.15 0.095
Further, both interaction terms for the first specification are significant (p< 0.1) whereas the lagged interaction term for the second specification is significant (p< 0.1). This result is again consistent with those displayed in Table4despite a minor decrease in significance.
Taken together, the results from the Heckman two-stage regression methodology indicate that the incremental pay-performance elasticity results are largely unaffected even with the inclusion of a sample selection bias correction term.
To ensure our findings conform to different specifications, we have conducted a few additional tests. We repeat the same analysis using return on equity (ROE) as an accounting-based measure of shareholders’wealth and the results are broadly consist-ent with those reported previously. For the pay-performance elasticity analysis, we repeat the same tests by including the year, industry dummies and firm size (proxied by Total Assets). The test again yields similar results. Finally, we repeat the same tests by replacing the corporate governance components using dichotomized variables rather than ranked variables and the results are qualitatively similar.
Conclusions
This study documents evidence supporting the hypothesis that spinoff improves interest alignment. We first provide evidence that CEO total direct compensation (including both cash and equity-based compensation) is statistically significantly associated with changes in shareholders’wealth after spinoff, whereas this association is not significant before spinoff.
Next, we extend the analysis by examining the impact of corporate governance to-wards the interest alignment improvement from the spinoff transaction. Four compo-nents of corporate governance mechanisms are examined in this study: board structure, committee independence, board and committee activities, and institutional ownership. The findings generally suggest that corporate governance plays some role in improving interest alignment after spinoff. In addition, we also find some evidence that stronger improvements in corporate governance enhance CEO pay-performance sensitivity.
A potential limitation of this study is that the sample is not drawn from a more recent period. Nevertheless, the more distant sample period may provide a greater opportunity to examine governance mechanisms in the absence of the extensive governance-related regulations introduced by the Sarbanes-Oxley Act of 2002. The governance arrangements and changes in those arrangements are less likely to merely comply with mandatory government regulations in the years before 2002.
Endnotes
1
Prior studies such as Hite and Owers (1983), Schipper and Smith (1983), Seward and Walsh (1996) and Daley et al. (1997) have raised similar arguments. This study provides a direct test on the interest alignment argument to complement the estab-lished literature.
2
The value is measured based on the abnormal return from spinoff announcements.
3
relationship between a firm’s risk and pay-performance sensitivity. Cichello (2005) empir-ically shows that the negative association between pay-performance sensitivity and a firm’s risk is diminished once controlled for firm size. A recent study from Ju and Wan (2012) suggests that pay-performance sensitivity and a firm’s risk bears a non-monotonic rela-tionship. A related study from Cao and Wang (2013) shows both theoretically and empir-ically that the equilibrium pay-performance sensitivity is positively associated with the firm’s idiosyncratic risk, yet negatively associated with the firm’s systematic risks.
4
The sample commences from 1990 as CEO compensation data prior to 1990 are unavailable from Execucomp or Lexis-Nexis.
5
We have repeated all the tests with the inclusion of these extreme samples and the results are consistent with the ones reported here. To further ensure robustness of results, we have repeated the analysis excluding firms with annual returns higher than 3.0. Again, no significant deviation of results is observed.
6
Other compensation represents compensation which cannot be classified in other categories, such as life insurance premiums, retirement payments, tax reimbursements, retirement plan contributions, etc.
7
This definition is consistent with Burch and Nanda (2003) and Ahn and Denis (2004).
8
We also acknowledge that a number of studies find that independent / outside direc-tors do not enhance the firms’governance (e.g., Agrawal and Knoeber (1996), Bhagat and Black (2001) etc.). However, Duchin et al. (2010) contends that the effectiveness of the outside independent directors on the board is dependent on their ability to acquire firm-specific information. Knowing that a spinoff creates value by reducing information asymmetry (e.g., Krishnaswami and Subramaniam (1999), Huson and MacKinnon (2003)), an increase in outside independent directors after the spinoff can promote more effective governance in post-spinoff firms.
9
We use the pay-performance elasticity model throughout this study to examine the notion of interest alignment. The difference between pay-performance elasticity and the pay-performance sensitivity model lies solely in the measurement of the dependent and independent variables. The pay-performance sensitivity model expresses both pay and performance in dollars whereas for pay-performance elasticity, pay is expressed and logarithms and change in shareholder wealth is expressed in returns. As compared to pay-performance sensitivity, pay-performance elasticity is relatively robust to firm size (Gibbons and Murphy 1992). The use of pay-performance elasticity in this study appropriately addresses the issue of firm-size variation in the sample, along with the firm-size variation before and after the spinoff event.
Acknowledgements
We are grateful to the participants of the Asian Finance Association conference and theFrontiers of Business Research in Chinaannual conference for their helpful comments.
Funding
Not applicable.
Availability of data and materials
Please contact author for data requests.
Author’s contributions
We declare that both authors have equal contribution in this paper. Both authors read and approved the final manuscript.
Competing interests
Publisher’s Note
Springer Nature remains neutral with regard to jurisdictional claims in published maps and institutional affiliations.
Author details
1School of Accounting and Finance, The Hong Kong Polytechnic University, Hung Hom, Hong Kong, China.2College
of Business, City University of Hong Kong, Kowloon Tong, Hong Kong, China.
Received: 7 March 2018 Accepted: 30 October 2018
References
Adams, R., Almeida, H., & Ferreira, D. (2005). Powerful CEOs and their impact on corporate performance.Review of Financial Studies, 18, 1403–1432.
Adams, R. B., & Ferreira, D. (2009). Women in the boardroom and their impact on governance and performance.Journal of Financial Economics, 94, 291–309.
Aggarwal, R., & Samwick, A. (1999). The other side of the trade-off: The impact of risk on executive compensation.Journal of Political Economy, 107, 65–105.
Agrawal, A., & Knoeber, C. R. (1996). Firm performance and mechanisms to control agency problems between managers and shareholders.Journal of Financial and Quantitative Analysis, 31, 377–397.
Ahn, S., & Denis, D. J. (2004). Internal capital markets and investment policy: Evidence from corporate spinoffs.Journal of Financial Economics, 71, 489–516.
Ahn, S., & Walker, M. D. (2007). Corporate governance and the spinoff decision.Journal of Corporate Finance, 13, 76–93. Anderson, R. C., Mansi, S. A., & Reeb, D. M. (2004). Board characteristics, accounting report integrity and the cost of debt.
Journal of Accounting and Economics, 37, 315–342.
Andres, P., & Vallelado, E. (2008). Corporate governance in banking: The role of the board of directors.Journal of Banking and Finance, 32, 2570–2580.
Armstrong, C. S., Core, J. E., & Guay, W. R. (2014). Do independent directors cause improvements in firm transparency?Journal of Financial Economics, 113(3), 383–403.
Aron, D. J. (1991). Using the capital market as a monitor: Corporate spinoffs in an agency framework.The Rand Journal of Economics, 22, 505–518.
Beasley, M. S., Carcello, J. V., Hermanson, D. R., & Lapides, P. D. (2000). Fraudulent financial reporting: Consideration of industry traits and corporate governance mechanisms.Accounting Horizons, 14, 441–454.
Bebchuk, L. A., Cremers, K. J. M., & Peyer, U. C. (2011). The CEO pay slice.Journal of Financial Economics, 102, 199–221. Bena, J., Ferreira, M. A., Matos, P., & Pires, P. (2017). Are foreign investors locusts? The long-term effects of foreign institutional
ownership.Journal of Financial Economics, 126(1), 122–146.
Bhagat, S., & Black, B. (2001). The non-correlation between board independence and long-term firm performance.Journal of Corporation Law, 27, 231–274.
Bizjak, J., Lemmon, M., & Whitby, R. (2009). Option backdating and board interlocks.The Review of Financial Studies, 22, 4821–4847.
Boone, A. L., & White, J. T. (2015). The effect of institutional ownership on firm transparency and information production.
Journal of Financial Economics, 117(3), 508–533.
Burch, T. R., & Nanda, V. (2003). Divisional diversity and the conglomerate discount: Evidence from spinoffs.Journal of Financial Economics, 70, 69–98.
Cao, M., & Wang, R. (2013). Optimal CEO compensation with search: Theory and empirical evidence.The Journal of Finance, 68(5), 2001–2058.
Carter, D., Simkins, B., & Simpson, W. (2003). Corporate governance, board diversity, and firm value.Financial Review, 38, 33–53.
Chemmanur, T. J., Jordan, B. D., Liu, M. H., & Wu, Q. (2010). Antitakover provisions in corporate spin-offs.Journal of Banking and Finance, 34, 813–824.
Chemmanur, T. J., Krishnan, K., & Nandy, D. K. (2014). The effects of corporate spin-offs on productivity.Journal of Corporate Finance, 27, 72–98.
Chemmanur, T. J., & Yan, A. (2004). A theory of corporate spin-offs.Journal of Financial Economics, 72(2), 259–290. Cheng, S. (2008). Board size and the variability of corporate performance.Journal of Financial Economics, 87, 157–176. Chhaochharia, V., & Grinstein, Y. (2009). CEO compensation and board structure.Journal of Finance, 64, 231–261. Chou, H. I., Chung, H., & Yin, X. (2013). Attendance of board meetings and company performance: Evidence from Taiwan.
Journal of Banking & Finance, 37(11), 4157–4171.
Cichello, M. S. (2005). The impact of firm size on pay-performance sensitivities.Journal of Corporate Finance, 11, 609–627. Conger, J., Finegold, D., & Lawler III, E. (1998). Appraising boardroom performance.Harvard Business Review, 76, 136–148. Conyon, M. J., & Murphy, K. J. (2000). The prince and the pauper? CEO pay in the United States and United Kingdom.The
Economic Journal, 110, F640–F671.
Core, J. E., Holthausen, R. W., & Larcker, D. F. (1999). Corporate governance, chief executive officer compensation, and firm performance.Journal of Financial Economics, 51, 371–406.
Cornett, M. M., Marcus, A. J., & Tehranian, H. (2008). Corporate governance and pay-for-performance: The impact of earnings management.Journal of Financial Economics, 87, 357–373.
Crane, A. D., Michenaud, S., & Weston, J. P. (2016). The effect of institutional ownership on payout policy: Evidence from index thresholds.The Review of Financial Studies, 29(6), 1377–1408.
Cusatis, P., Miles, J., & Woolridge, J. (1993). Restructuring through spin-offs: The stock market evidence.Journal of Financial Economics, 33, 293–311.
Dah, M. A., & Frye, M. B. (2017). Is board compensation excessive?Journal of Corporate Finance, 45, 566–585.
Duchin, R., Matsusaka, J. G., & Ozbas, O. (2010). When are outside directors effective?Journal of Financial Economics, 96, 195–214.
Fama, E., & Jensen, M. (1983). Separation of ownership and control.Journal of Law and Economics, 26, 301–325.
Feng, Y., Nandy, D. K., & Tian, Y. S. (2015). Executive compensation and the corporate spin-off decision.Journal of Economics and Business, 77, 94–117.
García-Meca, E., Garcia-Sanchez, I. M., & Martínez-Ferrero, J. (2015). Board diversity and its effects on bank performance: An international analysis.Journal of Banking & Finance, 53, 202–214.
Garen, J. E. (1994). Executive compensation and principal-agent theory.Journal of Political Economy, 102, 1175–1199. Garvey, G., & Milbourn, T. (2003). Incentive compensation when executives can hedge the market: Evidence of relative
performance evaluation in the cross section.Journal of Finance, 58, 1557–1581.
Gertner, R., Powers, E., & Scharfstein, D. (2002). Learning about internal capital markets from corporate spinoffs.Journal of Finance, 57, 2479–2506.
Gibbons, R., & Murphy, K. J. (1992). Optimal incentive contracts in the presence of career concerns: Theory and evidence.
Journal of Political Economy, 100, 468–505.
Green, C. P., & Homroy, S. (2018). Female directors, board committees and firm performance.European Economic Review, 102, 19–38. Guo, L., & Masulis, R. W. (2015). Board structure and monitoring: New evidence from CEO turnovers.The Review of Financial
Studies, 28(10), 2770–2811.
Hall, B. J., & Liebman, J. B. (1998). Are CEOs really paid like bureaucrats?Quarterly Journal of Economics, 113, 653–691. Hallock, K. (1997). Reciprocally interlocking boards of directors and executive compensation.Journal of Financial and
Quantitative Analysis, 32, 331–344.
Hartzell, J. C., & Starks, L. T. (2003). Institutional investors and executive compensation.Journal of Finance, 58, 2351–2374. Heckman, J. J. (1979). Sample selection bias as a specification error.Econometrica, 47, 153–161.
Hite, G., & Owers, J. (1983). Security price reactions around corporate spin-off announcements.Journal of Financial Economics, 12, 409–435.
Holmstrom, B. (1979). Moral hazard and observability.The Bell Journal of Economics, 10, 74–91.
Huson, M. R., & MacKinnon, G. (2003). Corporate spinoffs and information asymmetry between investors.Journal of Corporate Finance, 9, 481–503.
Jensen, M. (1993). The modern industrial revolution, exit, and the failure of internal control systems.Journal of Finance, 48, 831–880.
Jensen, M., & Meckling, W. (1976). Theory of the firm: Managerial behavior, agency costs, and ownership structure.Journal of Financial Economics, 3, 305–360.
Jensen, M., Murphy, K. and Wruck, E., 2004. Remuneration: Where we've been, how we got to here, what are the problems, and how to fix them. Harvard NOM Working Paper.
Jensen, M. C., & Murphy, K. J. (1990). Performance pay and top-management incentives.Journal of Political Economy, 98, 225–264. Jin, L. (2002). CEO compensation, diversification, and incentives.Journal of Financial Economics, 66, 29–63.
Ju, N., & Wan, X. (2012). Optimal compensation and pay-performance sensitivity in a continuous-time principal-agent model.
Management Science, 58, 641–657.
Karamanou, I., & Vafeas, N. (2005). The association between corporate boards, audit committees, and management earnings forecasts: An empirical analysis.Journal of Accounting Research, 43, 453–486.
Klein, A. (1998). Firm performance and board committee structure.Journal of Law and Economics, 41, 275–299. Klein, A. (2002). Audit committee, board of director characteristics, and earnings management.Journal of Accounting and
Economics, 33, 375–400.
Korkeamäki, T., Liljeblom, E., & Pasternack, D. (2017). CEO power and matching leverage preferences.Journal of Corporate Finance, 45, 19–30.
Krishnaswami, S., & Subramaniam, V. (1999). Information asymmetry, valuation and the corporate spin-off decision.Journal of Financial Economics, 53, 73–112.
Larcker, D., Richardson, S., Seary, A., and Tuna, I., 2005. Back door links between directors and executive compensation. Working Paper, Stanford University.
Lavy, V., & Schlosser, A. (2011). Mechanisms and impacts of gender peer effects at school.American Economic Journal: Applied Economics, 3(2), 1–33.
Lilienfeld-Toal, U. V., & Ruenzi, S. (2014). CEO ownership, stock market performance, and managerial discretion.The Journal of Finance, 69(3), 1013–1050.
Liu, Y., & Jiraporn, P. (2010). The effect of CEO power on bond ratings and yields.Journal of Empirical Finance, 17, 744–762. Miles, J. A., & Rosenfeld, J. D. (1983). The effects of voluntary spinoff announcements on shareholder wealth.Journal of
Finance, 38, 1597–1606.
Morck, R. (2008). Behavioral finance in corporate governance: Economics and ethics of the devil’s advocate.Journal of Management and Governance, 12, 179–200.
Morck, R., Shleifer, A., & Vishny, R. W. (1989). Alternative mechanism for corporate control.American Economic Review, 79, 842–852. Morse, A., Nanda, V., & Seru, A. (2011). Are incentive contracts rigged by powerful CEOs?Journal of Finance, 66, 1779–1821. Murphy, K. J. (1999). Executive compensation. In O. Ashenfelter & D. Card (Eds.),Handbook of Labor Economics, vol. 3.
Amsterdam: North-Holland.
Nguyen, B. D., & Nielsen, K. M. (2010). The value of independent directors: Evidence from sudden deaths.Journal of Financial Economics, 98, 550–567.
Patro, S. (2008). The evolution of ownership structure of corporate spin-offs.Journal of Corporate Finance, 14, 596–613. Rajan, R., Servaes, H., & Zingales, L. (2000). The cost of diversity: The diversification discount and inefficient investment.Journal
of Finance, 55, 35–80.
Rosenstein, S., & Wyatt, J. G. (1990). Outside directors, board independence, and shareholder wealth.Journal of Financial Economics, 26, 175–191.
Scharfstein, D. S., & Stein, J. C. (2000). The dark side of internal capital markets: divisional rent-seeking and inefficient investment.Journal of Finance, 55, 2537–2564.
Schipper, K., & Smith, A. (1983). Effects of re-contracting on shareholder wealth: The case of voluntary spinoffs.Journal of Financial Economics, 12, 437–467.
Schwartz-Ziv, M. (2017). Gender and board activeness: The role of a critical mass.Journal of Financial and Quantitative Analysis, 52(2), 751–780.
Seward, J. K., & Walsh, J. P. (1996). The governance and control of voluntary corporate spin-offs.Strategic Management Journal, 17, 25–39.
Shin, H., & Stulz, R. M. (1998). Are internal capital markets efficient?Quarterly Journal of Economics, 113, 531–552. Uzun, H., Szewczyk, S. H., & Varma, R. (2004). Board composition and corporate fraud.Financial Analyst Journal, 60, 33–43. Vafeas, N. (1999). Board meeting frequency and firm performance.Journal of Financial Economics, 53, 113–142. Vafeas, N. (2003). Further evidence on compensation committee compensation as a determinant of CEO compensation.
Financial Management, 32, 53–70.