Published online May 10, 2014 (http://www.sciencepublishinggroup.com/j/ajce) doi: 10.11648/j.ajce.20140203.13
Characterization of the layered pavement by modelling
and calibration of resilient modulus
Ahmed Ebrahim Abu El-Maaty Behiry
Faculty of Engineering, Minufiya University, Shibeen El-kom, City, Egypt
Email address:
To cite this article:
Ahmed Ebrahim Abu El-Maaty Behiry. Characterization of the Layered Pavement by Modelling and Calibration of Resilient Modulus.
American Journal of Civil Engineering. Vol. 2, No. 3, 2014, pp. 74-86. doi: 10.11648/j.ajce.20140203.13
Abstract:
Paving materials characterization in terms of resilient modulus (MR) has become crucial for pavement designand analysis. In fact, it is extremely difficult to measure MR in laboratory as well as in field. The main objective of this study
is to achieve a basis for the performance based design specifications of flexible pavements in Egypt. Thus, a methodology of an experimentally program is presented to evaluate the deformation characteristics and develop a possible correlations between different characteristics of Egyptian pavement layers under various saturation degrees and compaction efforts. Calibration of the predicted models is investigated by using international correlations to substantiate their predictability and evaluate the feasibility of using one or more of those equations in predicting MR of Egyptian base, subbase or subgrade soil.
The results show that the obtained base course model is close to the TRPL theoretical relationship while Georgia equation is suited for predicting MR of Egyptian subbase layer. For subgrade soil, the obtained equation should be used with caution. The
predictive capability of the proposed models is proven for use in flexible pavement design in Egypt where CBR or modulus of subgrade reaction is expected to simplify the effort in determination of the MR.
Keywords:
Resilient Modulus, California Bearing Ratio, Prediction Equations, Permanent Deformation1. Introduction
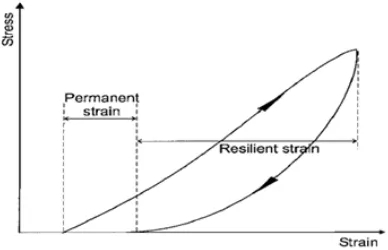
The stress pattern induced in a pavement due to a moving wheel load is quite complex. In unbound layers, the vertical and horizontal stresses are positive, whereas the shear stress is reversed as the load passes, thus causing a rotation of the principal stress axes. The deformational response of paving layers under traffic loading is conveniently characterized by a recoverable (resilient) deformation and a residual (permanent) deformation, as illustrated in Fig.1 [1].
Figure 1.Strains in paving materials during one cycle of load application.
When designing pavements, the characteristic of each layer is an essential design parameter that needs to be considered. Pavement materials are typically characterized by their resistance to deformation under load, which can be either a measure of their strength or stiffness. In general, the more resistant to deformation a pavement layer is the more loads it can support before reaching a critical deformation value. A basic layer stiffness/strength characterization is resilient modulus (MR). Resilient modulus is a measurement
Determination of resilient modulus value for pavement layers using dynamic triaxial shear test is difficult, costly and time consuming. Due to these reasons, many researchers aim to find a simple, cheap and fast method to determine resilient modulus value. Many empirical correlations between resilient modulus and other soil strength parameters have been established to facilitate estimating MR value.
California Bearing Ratio (CBR) and modulus of subgrade reaction (Ks) are two main soil strength parameters, which are mostly used to calculate resilient modulus value [4]. CBR test is commonly used to determine the suitability of a material as a subgrade, subbase or base course for highway design and construction. Field plate load test is commonly used to predict the deformations and failure characteristics of the subgrade and Ks which used in foundation design, soil-structure interaction studies and design of highway pavement (flexible and rigid pavements) [5&6].
2. Problem Statement and Research
Objective
The quality assurance for constructed base, subbase and subgrade layers are based on comparing in situ moisture content and dry density with optimum moisture content (OMC) and maximum dry density (γd max), assuming that the flexible pavement layers will perform satisfactorily when achieving a certain value. However, the AASHTO 1993 design [7] method is based on dynamic parameters such as resilient modulus MR. There are a gap between
quality assurance and the design procedure because the laboratory/field dry density is not a direct indication for the material stiffness used in the flexible pavement design. Applying CBR or plate loading test can be a better guide for the pavement layer stiffness during flexible pavement layers construction. Thus, the correlations developed between MR
and CBR and Ks will estimate the resilient modulus of pavement layers during the construction process. There has been considerable discussion on the suitability of using any of these approaches but there are no consistent results. For example, Thompson and Robnett (1979)[8], Unlike many research, could not find a suitable correlation between CBR and MR where they concluded that the CBR test is a
measure of the shear strength of the material and does not necessarily correlate with a measure of stiffness or modulus such as the MR. Since several correlations are available from
past studies, there is a need to substantiate the predictability of these equations. Those equations, if proved to be valid, could serve a vital role in proposing a preliminary pavement design for budgeting purposes. Final design can await completion of the grading contract, followed by additional in-situ tests.
The main objective of this study is to evaluate the deformation performance and predict the resilient modulus, used in the mechanistic design of pavement structures, for the material types used in Egypt. The correlations between resilient modulus and other performance tests are also
investigated in order to develop reliable models for asphalt pavement design. The research objectives can be summarized as follows:
1. Presenting an experimentally framework that enables the engineer to estimate or refine the resilient modulus with the results of plate load test.
2. Studying the effect of compaction energy (CE) and moisture content (MC) on the layers properties such as γd or CBR as well as on the deformation characteristics.
3. Investigation the effect of number of loading cycles on the accumulated elastic and plastic deformation in base, subbase and subgrade soil.
4. Developing statistical correlations between Egyptian paving materials parameters to determine whether it is possible to predict the MR.
5. Verifying the obtained empirical formulas with international models to study the possibility to be used in the mechanistic-empirical design of flexible pavements.
3. Methodology
This paper presents comparative studies to evaluate the resilient modulus of dolomite base course, limestone subbase and silt subgrade soil and their deformation characteristics from the laboratory plate load test. The laboratory testing program is divided into two stages. In the first stage, CBR and γd have been determined for the pavement layers of different moisture contents (MC) and different compaction energies (CE). In the second stage, MR and Ks have been determined.
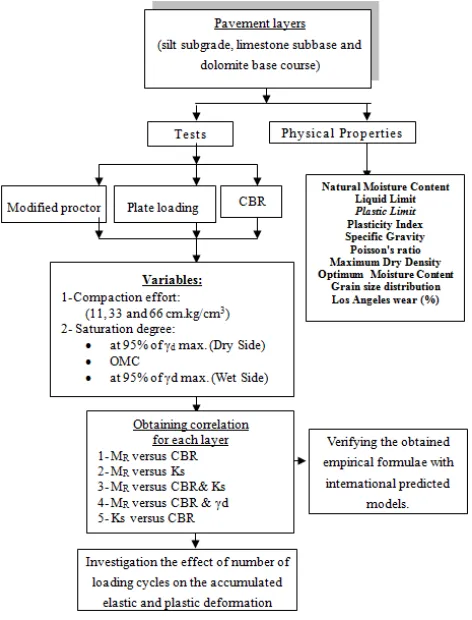
The different percentages of saturation degree used in the testing program are determined according to the allowable field water content limits stated in the Egyptian Code of Practice (ECP) to construct road pavement layers (OMC, water content corresponding to 95% of γd max at both dry and wet sides). In addition, compaction efforts were determined according to the ECP for CBR test procedure as 11, 33 and 66 cm.kg/cm3 based on 10, 30 and 60 blows respectively. The flow chart of the experimental study and design parameters are presented in Fig. 2.
4. Literature Review
4.1. AASHTO Guide for the Design of Pavement Structures
soil support value (SSV). SSV has a scale ranging from 1 to 10, with a value of 3 representing the natural soil at the Road Test. In the revised 1986 AASHTO guide, the road bed resilient modulus, MR, was selected to replace the SSV, used
in the previous editions of the guide, for the following reasons [9]:
1. It indicates a basic material property, which can be used in mechanistic analysis of multilayered systems for predicting roughness, cracking, rutting, faulting, etc. 2. MR has been recognized internationally as a method for
characterizing materials for use in pavement design and evaluation.
3. Methods for determination of MR are described in
AASHTO test method T274-82 and others, the latest being Harmonized Test, NCHRP 1-28A.
4. Techniques are available for estimating the resilient properties of various materials in place by non-destructive tests.
4.2. Factors Affecting Resilient Modulus of Cohesive Soils
The resilient modulus of fine-grain soils is not a constant stiffness property but depends upon various factors like load state or stress state, which includes the deviator and confining stress, soil type and its structure. This primarily depends on compaction method and compaction effort. Previous studies showed that the deviator stress is more significant than confining stress for fine-grain soils. However, resilient modulus was found to increase with a decrease in moisture content and an increase in density. It also decreases with an increase in deviator stress [10].
4.3. Factors Affecting Resilient Modulus of Coarse Soils
Since 1960, numerous research efforts have been devoted to characterizing the resilient behavior of granular materials. It is well known that granular pavement layers show a nonlinear and time-dependent elastoplastic response under traffic loading. To deal with this nonlinearity and to differentiate from the traditional elasticity theories, the resilient response of granular materials is usually defined by resilient modulus and Poisson’s ratio. Alternatively, the use of shear and bulk moduli has been suggested. For design purposes, it is important to consider how the resilient behavior varies with changes in different influencing factors. From the studies found in the literature, it appears that the resilient behavior of unbound granular materials may be affected, with varying degrees of importance, by several factors as described below [1].
effect of stress, effect of density,
effect of grading, fines content, and maximum grain size,
effect of moisture content,
effect of stress history and number of load cycles, effect of aggregate type and particle shape,
effect of load duration, frequency, and load sequence. Studies have also indicated that there is a critical degree of
saturation near 80-85 percent, above which granular material becomes unstable and undergoes degradation rapidly under repeated loading. Resilient modulus of granular materials increases with increasing confining stress and principal stresses (known as bulk stress (θ)), and slightly increases with deviator stress [9].
Figure 2. Flow chart of the experimental plan.
4.4. Correlation between MR and CBR
Simple correlation equations have been reported to predict MR from standard CBR, R value, and soil physical
properties. A widely used empirical relationship developed by Heukelom and Klomp (1962) [11]. This equation is restricted to fine grained materials with soaked CBR values of 10% or less as stated in ECP, 2008 [12] and used in the 1993 AASHTO guide is :
MR=1500*CBR (1)
Where MR, Resilient modulus (psi); CBR, California
Bearing Ratio.However, Hossain S.M. (2009)[13] explained that the current practice of converting a CBR value to a resilient modulus value does not provide a reliable estimate of the resilient modulus using Heukelom and Klomp equation. Various correlations between MR and CBR are
used around the world:
* U.S. Army corps of engineers (Green and Hall
1975)[14].
* South African council on scientific and industrial
research (CSIR)[14]
MR = 3000 (CBR)0.65 (3)
* Transportation and road research laboratory (Powell et
al.) (TRRL) (1984)[15]
MR = 2555 (CBR) 0.64 (4)
* The Georgia department of transportation (2004) tested
a number of granular materials in repeated load triaxial test following the AASHTO procedure to create a database so that the resilient modulus can be predicted. A typical equation for stabilized lime stone is as follows: [16]
MR = 3116 (CBR)0.49 (5)
* In addition, NAASRA (1950) developed the following
equations [5]:
MR = 2350 (CBR)0.7 (For CBR less than 5%) (6)
MR = 3250 (CBR)0.5 (For CBR more than 5%) (7)
Çöleri E. (2007)[17] stated that resilient modulus prediction models can be improved by including soil index parameters in order to minimize residual errors. The most effective parameters that have high significance in representing the MR variation are CBR, liquid limit (LL) and
optimum moisture content (OMC). The regression model predicting resilient modulus (R2 = 0.7089) is as follows in equation:
MR = 228376.7946 – (1479.8978 * LL) – (12381.4217 *
OMC) + (689.5*CBR)+(152.9164* LL * OMC) (8) However, CBR is widely used to calculate resilient modulus empirically due to the easiness of determining CBR value. The fundamental problem with empirical relationships developed to correlate resilient modulus with CBR is that those tests themselves are empirical, whereas resilient modulus is a mechanistic parameter and depends on soil index properties and stress state [17].
4.5. Correlation between MR and Ks
The modulus of subgrade reaction, ks (also referred to as Coefficient of Elastic Uniform Compression) is a relationship between soil pressure (P) and deflection (δ ) which is proportional to its vertical displacement as idealized in Winkler’s soil model. It can also be defined as the ratio of uniform pressure imposed on the soil to the elastic part of the settlement [5].
Ks = P/ δ (9)
A theoretical relationship between the Ks (pci) and MR
(psi) was developed in the appendix HH of the AASHTO design guide [7] which is as follows:
4
.
19
R
M
Ks
=
(10)It should be noted that this theoretical relationship was developed based on the assumption that the roadbed material is linear elastic. The relationship between the Ks(MPa/m) and MR (MPa) developed in the mechanistic-empirical
pavement design guide (MEPDG), as quoted by Ping and Sheng [4] , was given in the following equal:
Ks = 0.296*MR (11)
Recently, Kim et al. [3]. adopted the portable falling weight deflectrometer to evaluate material characteristics of well-compacted subgrades. In addition, the static plate-bearing load test was used to evaluate the Ks. The test results show that there is a reasonable linear correlation between the dynamic deflection modulus and the Ks of well compacted subgrades .Florida method of test for non-repetitive static plate test determined Ks (Pci) using the plate radius (R) as the following equations [1]:
Ks= MR/(1.18*R) (12)
Sheng B.[18] stated that the relation between modulus of subgrade reaction (Ks) and resilient modulus (MR) could be
expressed using Poisson's ratio (µ) by the following equation:
Ks = 2MR/[3.14(1-µ2)*R] (13)
5. Experimental Work
5.1. Materials
Figure 3. Sieve analysis for dolomite base course.
0 20 40 60 80 100 120
0.01 0.1 1 10 100
Sieve size (mm)
P
as
si
n
g
b
y
w
ei
g
h
t
(%
)
Used gradation Maximim limit Minimum limit
Figure 4. Sieve analysis for limestone subbase.
Figure 5.Sieve analysis for silt subgrade soil.
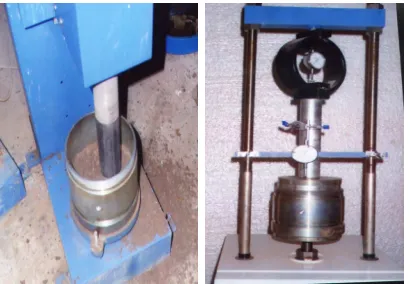
Figure 6.Modified Proctor and CBR tests.
5.2. Laboratory Plate Loading Test
The behavior of the layers under traffic loading is an important factor in the design of pavement systems. Plate load tests have been conducted by a number of researchers to investigate the response and performance of the pavement layers under repetitive loads, and compared the deformation response of a pavement section predicted using resilient module to that measured in plate load tests.
Table 1. Physical Properties of pavement layers.
Test Subgrade Subbase Base
Type silt limestone dolomite
Natural moisture content ( %) 7.0 3.5 2.7
Liquid limit ( % ) 54.0 26.0 19.0
Plastic limit ( % ) 40.0 19.0 13.6
Plasticity index ( %) 14.0 7.0 5.4
Specific gravity 2.68 2.66 2.65
Poisson's ratio 0.45 0.4 0.35
Maximum dry density (gm/cm3) 1.66 1.975 2.22
Optimum moisture content ( %) 16.0 8.0 6.1
AASHTO classification group A-7-5 A-1-B A-1-a
Unified classification group MH GP GP
Los Angeles wear (%) - 39.5 32.2
Amount of fines (%) - 9 5
They observed a reasonable match between the two approaches for selected cases. However, the material stiffness in large scale sections may not always be replicated by the laboratory test and may actually change due to applied repetitive loads [19]. In this paper, the laboratory test-model basically consists of 0.5*0.5*0.5m iron box as shown in Fig. 7 where the soil has been spread into the model and compacted in five layers of 10.0 cm thickness. In order to obtain a certain degree of compaction, the ECP stated that the compaction effort is determined using the following equation [20]:
Figure7. Plate loading process on limestone subbase.
5.3. The resilient Modulus MR and Modulus Subgrade
Reaction "Ks"
The resilient modulus obtained from the laboratory loading test is based on the elastic theory. When a rigid plate is put on the layer surface, the resilient modulus is as follows [21]:
w
a
p
M
R2
.
)
µ
1
(
−
2=
π
(15)Where MR , resilient modulus (Mpa); p, uniform applied
pressure "Mpa"; a, radius of circular plate "mm"; w, deflection after the third loading cycle "mm"; µ, poisson's ratio of the soil. From stress-deflection curve of the first cycle of plate loading test, the vertical stress "P" that give deflection "δ" of 1.25 mm is read and modulus of subgrade reaction "Ks" is calculated as shown in equation 9.
6. Experimental Analysis
6.1. Influence of Compaction Effort on Layers Properties
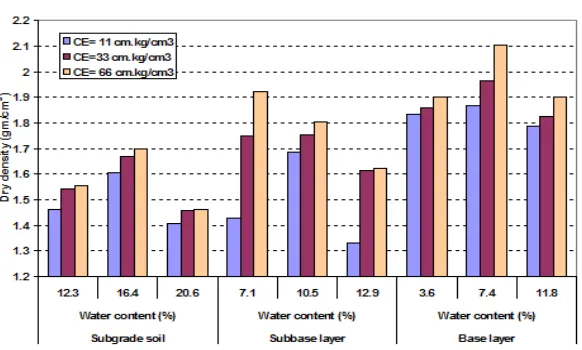
Figs 8&9 and Table 2 show CBR and dry density (γd) with different CE and MC. It is clearly noticed that with increasing the compaction effort, the density and strength increase by different ratios where the highest values are achieved at OMC while the lowest values are obtained at wet side of compaction curve. Therefore, the flexible pavement layers should be compacted using water content range corresponding to 95% dry density up to OMC.
Figure 8. Influence of compaction effort on CBR values.
Table 2. Effect of compaction effort on layers properties.
Silt subgrade soil
Compaction effort (cm.kg/cm3)
WC = 12.3% at 95% of γd max.
(Dry Side) OWC = 16.4%
WC = 20.6% at 95% of γd max. (wet Side)
γd (gm/cm3) CBR γd (gm/cm3) CBR γd (gm/cm3) CBR
11 1.461 8.19 1.604 5.34 1.408 2.45
33 1.542 11.17 1.667 8.82 1.455 3.93
66 1.556 12.42 1.7 15.73 1.462 7.84
Limestone subbase layer
Compaction effort (cm.kg/cm3)
WC = 7.1% at 95% of γd max.
(Dry Side) OWC = 10.5%
WC = 12.9% at 95% of γd max. (wet Side)
γd (gm/cm3) CBR γd (gm/cm3) CBR γd (gm/cm3) CBR
11 1.429 30.5 1.684 41.88 1.33 24.35
33 1.748 55.25 1.752 50.34 1.613 29.77
66 1.923 96.46 1.802 108.63 1.622 33.62
Dolomite base course layer
Compaction effort (cm.kg/cm3)
WC = 3.6% at 95% of γd max.
(Dry Side) OWC = 7.4%
WC = 11.8% at 95% of γd max. (wet Side)
γd (gm/cm3) CBR γd (gm/cm3) CBR γd (gm/cm3) CBR
11 1.833 43.32 1.865 40.73 1.785 41.63
33 1.857 80.35 1.964 84.64 1.823 67.66
66 1.9 133.84 2.103 158.5 1.902 95.78
Table 3 illustrates the improvement ratio (IVR) in both CBR and γd due to increasing of compaction effort more than 11 cm.kg/cm3 where CBR is extremely improved by
compaction effort more than dry density. For subgrade soil, the highest IVR in CBR is achieved at OMC while the highest IVR in γd is obtained at wet side.
Table 3. Improvement ratio due to compaction effort increasing
Silt Subgrade soil Compaction effort
(cm.kg/cm3)
WC = 12.3% at 95% of γd max. (Dry Side) OWC = 16.4% WC = 20.6% at 95% of γd max. (wet Side)
γd (gm/cm3) CBR γd (gm/cm3) CBR γd (gm/cm3) CBR
11 - - - -
33 3.33 36.38 3.93 65.16 5.54 60.4
66 3.83 51.64 5.98 194.56 6.5 220.0
Limestone Subbase layer Compaction effort
(cm.kg/cm3)
WC = 7.1% at 95% of γd max. (Dry Side) OWC = 10.5% WC = 12.9% at 95% of γd max. (wet Side)
γd (gm/cm3) CBR γd (gm/cm3) CBR γd (gm/cm3) CBR
11 - - - -
33 22.32 81.1 4.03 20.2 21.27 22.25
66 34.56 216.2 7.0 159.38 21.95 38.0
Dolomite Base course layer Compaction effort
(cm.kg/cm3)
WC = 3.6% at 95% of γd max. (Dry Side) OWC = 7.4% WC = 11.8% at 95% of γd max. (wet Side)
γd (gm/cm3) CBR γd (gm/cm3) CBR γd (gm/cm3) CBR
11 - - - -
33 1.3 92.6 5.3 95.38 2.12 66.65
66 3.65 220.8 12.76 265.8 6.55 135.73
The lowest IVR in both CBR and γd is obtained at dry side. For subbase layer, the highest IVR in both CBR and γd is achieved at dry side while the lowest value is obtained at OMC. In case of base layer, the highest IVR in both CBR and γd is achieved at OMC while the lowest IVR in CBR is obtained at wet side and for γd is obtained at dry side.
As shown in Fig. 10, the base layer achieves the maximum improvement reaches to 265% at the highest CE followed by subgrade soil and subbase layer at the last. Thus, it can be concluded that the CE advantages in increasing the CBR are clearly appeared at base layer.
6.2. Plate Loading Test Results
It can be noticed that in the first load cycle the cumulative deformation under the plate increases rapidly with increasing the vertical pressure as shown in Fig. 11. The returned division represents the elastic deformation, while the remained part symbolizes the plastic deformation. The rate of accumulated deformation becomes slight in the second and third load. Table 4 shows the total accumulated deformations measured after the third loading cycle. The resilient modulus "MR" can be calculated considering a
uniform applied pressure equals to 0.5 N/mm2 and the poisson's ratio of 0.45. Moreover, modulus of subgrade reaction "Ks" is calculated and illustrated in Table 4.
Figure 11. Plate loading test results for subgrade soil.
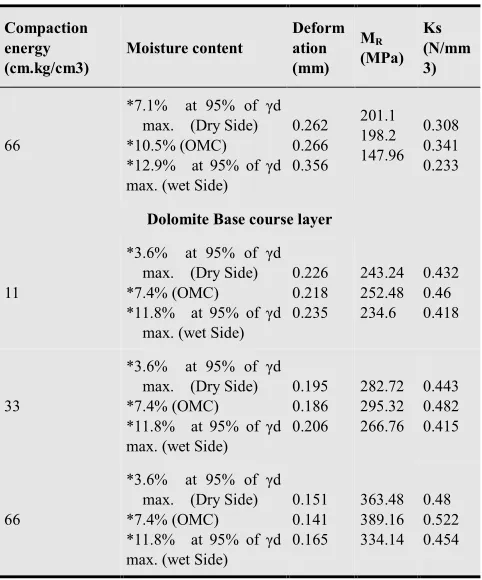
Table 4. Plate loading test results.
Ks (N/mm 3) MR (MPa) Deform ation (mm) Moisture content Compaction energy (cm.kg/cm3)
Silt Subgrade soil
0.088 0.108 0.04 10.09 10.64 7.26 4.96 4.7 6.9 *12.3% at 95% of γd
max. (Dry Side) *16.4% (OMC) *20.6% at 95% of γd
max. (wet Side) 11 0.093 0.124 0.062 11.73 14.0 7.7 4.27 3.55 6.5 *12.3% at 95% of γd
max. (Dry Side) *16.4% (OMC) *20.6% at 95% of γd max. (wet Side) 33 0.106 0.137 0.079 13.93 16.09 10.77 3.59 3.11 4.65 *12.3% at 95% of γd
max. (Dry Side) *16.4% (OMC) *20.6% at 95% of γd max. (wet Side) 66
Limestone Subbase layer
0.265 0.321 0.225 123.6 162.36 122.4 0.427 0.325 0.431 *7.1% at 95% of γd
max. (Dry Side) *10.5% (OMC) *12.9% at 95% of γd
max. (wet Side) 11 0.3 0.334 0.23 153.2 170.22 136.23 0.344 0.31 0.387 *7.1% at 95% of γd
max. (Dry Side) *10.5% (OMC) *12.9% at 95% of γd max. (wet Side) 33 Ks (N/mm 3) MR (MPa) Deform ation (mm) Moisture content Compaction energy (cm.kg/cm3) 0.308 0.341 0.233 201.1 198.2 147.96 0.262 0.266 0.356 *7.1% at 95% of γd
max. (Dry Side) *10.5% (OMC) *12.9% at 95% of γd max. (wet Side) 66
Dolomite Base course layer
0.432 0.46 0.418 243.24 252.48 234.6 0.226 0.218 0.235 *3.6% at 95% of γd
max. (Dry Side) *7.4% (OMC) *11.8% at 95% of γd
max. (wet Side) 11 0.443 0.482 0.415 282.72 295.32 266.76 0.195 0.186 0.206 *3.6% at 95% of γd
max. (Dry Side) *7.4% (OMC) *11.8% at 95% of γd max. (wet Side) 33 0.48 0.522 0.454 363.48 389.16 334.14 0.151 0.141 0.165 *3.6% at 95% of γd
max. (Dry Side) *7.4% (OMC) *11.8% at 95% of γd max. (wet Side) 66
6.2.1. Effect of Moisture Content and Compaction Effort
As shown in Table 4, the moisture content of paving materials has been found to affect the resilient response characteristics of these materials. It is generally agreed that the resilient response of dry and most partially saturated (wet) materials is similar, but as complete saturation is approached, the resilient behavior and Ks value may be affected significantly where decreases steadily as the moisture content increases above its optimum value. This result agrees with many researchers [2, 17, 18 and 21] who studied the behavior of granular materials, have all reported a notable dependence of resilient modulus on moisture content, with the modulus decreasing with growing saturation level. Haynes and Yoder [22], for instance, observed a 50% decrease in resilient modulus in gravel as the degree of saturation increased from 70 to 97%.
For compaction effort, Fig. 9 and Table 3 indicate that the density is influenced by the compaction effort. It has been known for many years that increasing density of a granular material significantly alters its response to static loading, causing it to become both stiffer and stronger. However, the effect on resilient stiffness has been less thoroughly studied. The literature available is somewhat ambiguous regarding the impact of density on resilient response of granular materials. Table 4 shows that with increasing CE, MR and Ks
increase. This may be due to the number of particle contacts per particle increases greatly with increased density resulting from additional compaction of the particulate system. This, in turn, decreases the average contact stress corresponding to a certain external load. Hence, the deformation in particle contacts decreases and the MR or Ks
6.2.2. Effect of Material Type and Fines Content on MR
and Ks
The effect of aggregate type (dolomite and limestone) provides an obvious effect on MR and Ks, where the
dolomite base course gets the highest values due to having angular to subangular shaped particles and rough particle surface that provides better load spreading properties and a higher resilient modulus than limestone aggregate. Granular materials consist of a large number of particles, normally of different sizes. Previous research in this area shows that the stiffness of such material is dependent on particle size and its distribution. The literature is not quite clear regarding the impact of fines content on material stiffness. The base aggregate of 5% fine content achieves MR higher than subbase aggregate of 9% fine content. Thus
it can be concluded that the resilient modulus generally decreases when the amount of fines increases. This result agrees with many researches such as [1, 21& 24] where a dramatic drop of about 60% in MR when the amount of
fines was increased from 0 to 10%. This improvement in stiffness is attributed to increased contacts as pore space is filled. Gradually, excess fines displace the coarse particles so that the mechanical performance relies only on the fines, and stiffness decreases.
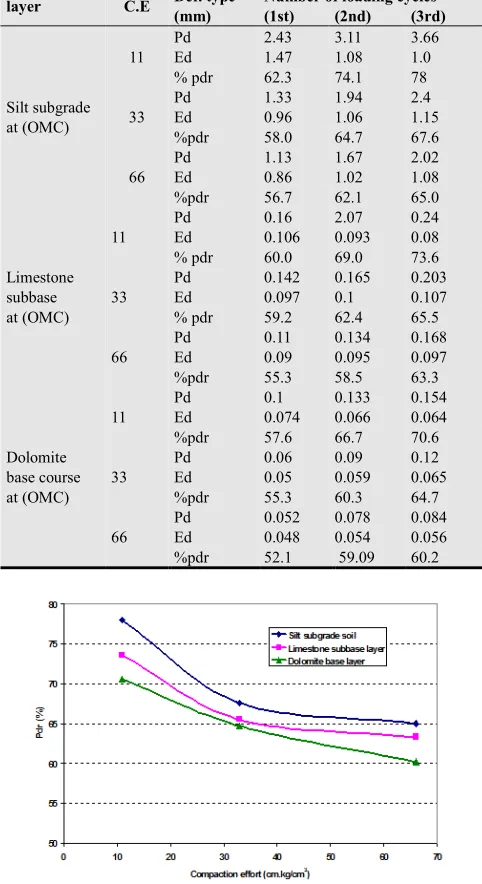
6.3. Effect of Number of Load Cycles on the Deformation Characteristics
Table 5 shows the effect of compaction effort on the plastic deformation "Pd" and elastic deformation "Ed" after each loading cycle for each pavement layer at OMC. Moreover, the plastic deformation ratio "Pdr" to the total deformation has been calculated and illustrated in Fig. 12 which correlates between the compaction effort and the Pdr after the third loading cycle. The following points can be remarked:
1. With increasing the loading cycles, the total deformation of each cycle decreases and consequently the resilient modulus increases.
2. With increasing the loading cycles, the Pd increases while the Ed decreases at CE of 11cm.kg/cm3. For higher compaction effort, the Ed increases.
3. The plastic deformation is higher than elastic deformation in all cases. The lowest Pd obtained at base layer while the highest one obtained at subgrade soil.
4. The lower Pd, Ed and Pdr obtain at higher compaction effort. For both subgrade and subbase, the Pdr extremely decreases with increasing CE from 11 to 33 cm.kg/cm3 while the Pdr slightly decreases with increasing CE from 33 to 66 cm.kg/cm3. Thus it can be concluded that compaction advantage in reducing the Pdr is clearly appeared at lower effort. For base layer, the Pdr gradually decreases by a constant rate.
Table 5. Effect of compaction effort on deformation characteristics.
layer C.E Def. type (mm)
Number of loading cycles (1st) (2nd) (3rd)
Silt subgrade at (OMC) 11 Pd Ed 2.43 1.47 3.11 1.08 3.66 1.0
% pdr 62.3 74.1 78
33 Pd Ed 1.33 0.96 1.94 1.06 2.4 1.15
%pdr 58.0 64.7 67.6
66 Pd Ed 1.13 0.86 1.67 1.02 2.02 1.08
%pdr 56.7 62.1 65.0
Limestone subbase at (OMC) 11 Pd Ed 0.16 0.106 2.07 0.093 0.24 0.08
% pdr 60.0 69.0 73.6
33 Pd Ed 0.142 0.097 0.165 0.1 0.203 0.107
% pdr 59.2 62.4 65.5
66 Pd Ed 0.11 0.09 0.134 0.095 0.168 0.097
%pdr 55.3 58.5 63.3
Dolomite base course at (OMC) 11 Pd Ed 0.1 0.074 0.133 0.066 0.154 0.064
%pdr 57.6 66.7 70.6
33 Pd Ed 0.06 0.05 0.09 0.059 0.12 0.065
%pdr 55.3 60.3 64.7
66 Pd Ed 0.052 0.048 0.078 0.054 0.084 0.056
%pdr 52.1 59.09 60.2
Figure12. Effect of compaction effort on plastic deformation ratio.
6.4. Correlation between CBR and Ks
One of the parameters obtained from the field plate load test is the spring constant modulus of subgrade reaction Ks which used as a primary input in pavement design models. It can be measured using a field plate load test conducted on top of the subgrade [25]. However, this test is costly to perform besides being time consuming. Also it is difficult to conduct a plate load test at depths beyond 1 or 2 m below ground level. Thus CBR test is expected to simplify the effort in determination of the Ks which is used in Foundation design, soil structure interaction, design of highway formations etc. As shown in Fig.13, a power regression is obtained between CBR and Ks as follows:
Figure 13. Obtained correlation between CBR and Ks.
6.5. Predicted MR Based on Single Soil Parameter
6.5.1. Correlations between MR and CBR
The correlations of measured CBR vs. measured MR for
each pavement layer are presented in Fig.14. Power relationships may be given to approximate the relationship between them. It is clearly noted that the subgrade soil is more sensitive to the change in the CBR where it has the sharpest curve followed by base layer. This may be indicates that the MR of subgrade soil is extremely improved with
increasing CBR value.
• MR dolomite base = 9372.5*CBR0.3496 R2 = 0.9412 (17)
• MR limestone subbase = 10328*CBR0.211 R2 = 0.8102(18)
• MR silt subgrade = 3460.3*CBR0.4187 R2 = 0.8526 (19)
Figure14. Obtained correlations between MR and CBR.
6.5.2. Validation of the Obtained Model (MR-CBR)
The question now arises; which model(s) satisfies validation criteria. Validation refers to the process to confirm that the proposed model can produce robust and accurate predictions for cases other than those used in model development and/or calibration. To accomplish this task, the predicted value shall agree with the obtained equation that based on laboratory measured value using the tangent of slope angle (n). Fig. 15 shows a comparison between resilient modulus of coarse layers (base and subbase) predicted from the obtained correlations and five known international models. It has been found that the MR increases
with the increase in the CBR where the relation is basically linear for all international as well as obtained equations and may therefore be expressed as a law, MR= t+ n*(CBR),
where t is a constant and n is a dimensionless constant representing the tangent of the slop angle. Table 6 illustrates which international equation is satisfied with the obtained model according to (n) value.
Figure15. Validation of the obtained model (MR-CBR) for coarse layers.
Table 6. The tangent of the slop angle (n) for coarse layers.
Equations US army Obtained
subbase Georgia Obtained base TRPL CSIR NAASRA
the slop angle (n) values 1126.7 82.64 179.79 217.36 358.19 445.31 462.84
t 26926 18548 11059 24075 11824 14065 11611
R2 0.992 0.9302 0.9732 0.9543 0.9873 0.9881 0.9914
comments
Satisfactory for Egyptian subbase
Satisfactory for Egyptian base
course
It can be indicated that the MR values predicted by the US
army equation do not agree with the laboratory values while the results of NAASRA and CSIR equations are near to be identical but considered unsatisfactory as well. MR value
predicted from the obtained equation for base course and
from TRPL equation is in a good agreement where the obtained equation provides MR values higher than them
values higher than them predicted by Georgia equation up to CBR of 75%, more than that the curve is reversed to become lower than the Georgia curve. Thus it can be clearly noted that the obtained equations for base and subbase layers is suitable for predicting the resilient modulus of flexible pavements in Egypt.
For silt subgrade soil, the relation between MR and CBR
Like coarse layers is basically linear as shown in Fig. 16. It can be indicated that the obtained equation, NAASRA and Heukelom equations provide the same result at CBR of 4.5%. Before this value, the obtained equation of subgrade soil achieves higher results than other international models. For CBR more than 4.5%, the obtained equation provides lower results than other international models. Thus, this equation should be used with caution for predicting the MR
values of Egyptian fine grained subgrade. Table 7 shows the slop of the curve (n) for each obtained and international models.
Figure16. Validation of the obtained model (MR-CBR) for subgrade.
Table 7. The tangent of the slop angle (n) for subgrade soil.
Equations Heukelom Obtained NAASRA
the slop angle (n) values 1500 450.9 892.19
t 0.0 4302.4 2583.1
R2 1.0 0.9782 0.9946
comments should be used
with caution
6.5.3. Correlations between MR and Ks
It is necessary to develop a relationship between modulus of subgrade reaction (Ks) and resilient modulus (MR). This
allows the designer to predict (MR) that will be used for
flexible pavement design by converting (Ks) using a (MR-Ks)
model. Power relationships may be given as shown in Fig. 17 where the base course is more sensitive to the change in Ks due to getting the sharpest curve followed by the subgrade soil and subbase layer. In another hand, the correlation quality that obtained from R2 coefficient indicates that MR for base or subbase layers is strongly
correlated with CBR value (R2 is about 0.9) more than Ks value (R2 is about 0.64). Thus, it can be said that the significance of CBR value in predicting MR for Egyptian
coarse layers is obvious compared with Ks value. While the predicting quality of MR for fine subgrade soil using
CBR or Ks values is the same (R2 is about 0.85).
• MR limestone subbase = 61.4*Ks0.8529 R2 = 0.6218 (20)
• MR dolomite base = 0.0205*Ks1.9637 R2 = 0.6622 (21)
• MR fine subgrade = 189.45*Ks0.6497 R2 = 0.8486 (22)
Figure 17. Obtained correlations between MR and Ks.
6.5.4. Validation of the Obtained Model (MR-Ks)
Fig. 18 shows a comparison between MR of fine grained
subgrade as well as coarse layer predicted from obtained correlations and the international AASHTO model. the relation is basically linear for subbase, subgrade and AASHTO models and power correlation for base course. The results suggest that AASHTO design guide is suited for purposes of predicting resilient modulus of Egyptian subbase layer where the slope of the two curve (n) are approximately the same (about 19.35). For base aggregate, its predicted resilient modulus is not agreed with AASHTO design guide. Thus, prediction of MR Egyptian base course
using Ks may need to be revised. For subgrade soil, the obtained equation should be used with caution for predicting approximate value of MR.
Figure18. Validation of the obtained model (MR-Ks).
6.6. Predicted Resilient Modulus Based on Multi Soil Parameters
strength and index tests could simplify the design process of flexible pavement. In this research project, the objective is to determine the resilient modulus, used in the mechanistic-empirical design of pavement structures, for the material types used in Egypt, and develop correlation models with soil properties and specifications to incorporate the resilient modulus in the pavement design process. The following correlations are obtained for this purpose where MR is the resilient modulus (psi), γd is the dry density (pci)
and Ks is modulus of subgrade reaction (pci): *MR subbase = 3652.5+ (77*CBR) + (256733.3*γd)
R2= 0.95 (23) *MR base = 21810+ (182.8*CBR) + (86821.2* γd)
R2=0.95 (24)
*MR subgrade = -5170.88+ (417*CBR) + (178406.47*γd)
R2= 0.924 (25)
*MR coarse layers = 6.34*CBR0.188*Ks1.07
R2=0.95 (26)
*MR subgrade = 2587.88+ (241.88*CBR)+ (10.755*Ks)
R2=0.935 (27)
7. Conclusions
This paper presents comparative studies to predict the resilient modulus of pavement layers and evaluate their performance and deformation characteristics in Egypt. The targeted goal is three-fold: a) to develop correlation relationships between the measured resilient modulus of each pavement layer and other parameters such as CBR, Ks and γd under various moisture conditions and compaction effort; b) to validate the obtained relationships by using other international equations; c) to evaluate the plastic and elastic deformation after each loading cycle for each pavement layer. The following conclusions may be a basis for the performance based design specifications of flexible pavements in Egypt.
1. CBR test is expected to simplify the effort in determination of modulus of subgrade reaction where a power regression is achieved between CBR and Ks. 2. Power relationships are given to approximate the
relationship between the resilient modulus and CBR where MR of subgrade soil is extremely improved with
increasing CBR value compared with other layers. The obtained equations for base and subbase layers are suitable for predicting the resilient modulus of flexible pavements in Egypt where they agree with TRPL and Georgia models respectively. While obtained equation of the Egyptian silt subgrade should be used with caution for predicting the MR values.
3. Power relationships are proven to illustrate the relationship between the resilient modulus and Ks where MR of base course is more sensitive to the
change in Ks value compared with other layers. For subgrade soil, the obtained equation should be used with caution for predicting approximate value of MR.
While prediction of MR for Egyptian base course using
Ks may need to be revised to agree with AASHTO design guide.
4. The resilient modulus generally decreases when the amount of fines increases where the dolomite base aggregate of 5% fine content achieves resilient modulus higher than limestone subbase aggregate of 9% fine content.
5. The plastic deformation is higher than elastic deformation. The compaction advantage in reducing the plastic deformation ratio is clearly appeared at lower compaction effort. With increasing the loading cycles, the Pd increases while the Ed decreases at lower compaction effort and increases at higher effort.
References
[1] Fredrick Lekarp,1 Ulf Isacsson,2 and Andrew Dawson3, "Resilient Response of Unbound Aggregates ", Journal of Transportation Engineering, Vol. 126, No. 1, 2000. [2] Jean-Pascal Bilodeau, Guy Doré, "Relating resilient
behaviour of compacted unbound base granular materials to matrix and interlock characteristics, Construction and Building Materials, Vol.37, P.P 220–228, 2012.
[3] Jingang Wang, Kim Jenkins, Andre Molenaar, Shaopeng Wu, "Evaluation Of Resilient Modulus Models For A High Quality Crushed Stone", 10th Conference On Asphalt Pavements For Southern Africa, 11 to 14 September 2011. [4] Ping W.V. and Sheng B., "Developing Correlation
Relationship between Modulus of Subgrade Reaction and Resilient Modulus for Florida Subgrade Soils", Paper No. 11-3731, Transportation Research Board (TRB), 2011. [5] Putri E.E., Kameswara N.R., Mannan M.A., "Evaluation of
Modulus of Elasticity and Modulus of Subgrade Reaction of Soils Using CBR Test", Journal of Civil Engineering Research, Civil Engineering Department, University of Malaysia Sabah, Kota Kinabalu, Sabah, Malaysia, 2012. [6] Florida Method of Test for Nonrepeatitive Static Plate Load
Test of Soils and Flexible Pavement Components, September 2000, Designation: FM 5-527, September 1, 2000,
[7] American Association of State Highway and Transportation Official (AASHTO), Guide for Design of Pavement Structures. Volume I & II, Joint Force on Pavements, Highway Sub-committee on Design, Washington D.C., 1993. [8] Thompson, M.R., and Robnett, Q.L. (1979), “Resilient properties of subgrade soils,” Journal of Transportation Engineering, ASCE, Vol. 105, No. 1, pp. 71-89.
[9] K.P.George, "Prediction Of Resilient Modulus From Soil Index Properties", M.SC, The University Of Mississippi, November 2004.
[11] Heukelom, W., and Klomp, A.J.G. (1962), “Dynamic testing as a means of controlling pavement during and after construction,” Proceedings of the 1st international conference on the structural design of asphalt pavement, University of Michigan, Ann Arbor, MI.
[12] Egyptian Code of Practice for Urban and Rural Roads, ECP – 2008.
[13] Hossain S.M., "Estimation of Subgrade Resilient Modulus for Virginia Soil", Transportation Research Board (TRB), 2009.
[14] Beena Sukumaran, Suitability of Using California Bearing Ratio Test to Predict Resilient Modulus, The Federal Aviation Administration Airport Technology Transfer Conference, 2005
[15] Hashiro R.S., "Correlation of Resistance Value (R-Value) with California Bearing Ratio (CBR) for Use in the Design of Flexible Pavements ", Master of Science, Civil Engineering Department, University of Hawaii, USA, 2005.
[16] George KP,"Prediction of resilient modulus from soil index properties", University of Mississippi, US department of transportation, federal highway administration; 2004. [17] Çöleri E., "Relationship Between Resilient Modulus And
Soil Index Properties Of Unbound Materials", Master Of Science in Civil Engineering Department, The Graduate School of Natural and Applied Sciences of Middle East Technical University, 2007.
[18] Sheng B., 2010, "Evaluation of Granular Subgrade Modulus from Field and Laboratory Tests", the Florida State
University Famu-Fsu College of Engineering, Department of Civil and Environment Engineering.
[19] Jaehun Ahn1,*, Ben Cote2, Brent Robinson3, Mohammed A. Gabr4, Roy H. Borden, "Inverse Analysis of Plate Load Tests To Assess Subgrade Resilient Modulus", 88th Transportation Research Board Annual Meeting, January 11-15, 2009, Washington, D.C.
[20] Cancelli, A., Montanelli, F., Rimoldi, P. and Zhao, A., “Full Scale Laboratory Testing on Geosynthetics Reinforced Paved Roads”, Proceedings of the International Symposium on Earth Reinforcement, Japan, pp. 573-578, 1996.
[21] Alvian J.S., Devapriya C. W., Lim S.M. , Adnan Z., "Innovative Laboratory Assessment of the Resilient Behaviour of Materials (Rigid, Elastic and Particulates)", Procedia Engineering 53 , 156 – 166, 2013 .
[22] Haynes, J. G., and Yoder, E. J. ‘‘Effects of repeated loading on gravel and crushed stone base course materials used in the AASHO Road Test.’’ Hwy. Res. Rec. 39. 1963.
[23] Kolisoja, P. , ‘‘Resilient deformation characteristics of granular materials,’’, PhD thesis, Tampere University of Technology, Publ. No. 223, Tampere, Finland, 1997. [24] Xiao Zhang, "Discrete element modeling of the resilient
behavior of subgrade sandy soils", Procedia - Social and Behavioral Sciences 96, 490 – 495, 2013.