Applying Data Mining Techniques for Predicting
Diseases
Basant Ali Sayed
Teaching Assistant, Department of Information System Higher Institute of Qualitative Studies, Egypt
[email protected] Mona Nasr
Department of Information Systems, Faculty of Computers & Information Helwan University, Egypt
---ABSTRACT ---The techniques of data mining are very popular of Diseases. ---The advancement in health analysis has been improved by technical advances in computation, automation and data mining. Nowadays, data mining is getting used in a vast area .The Nature of the medical field is made with the knowledge wherever there’s a spread of data but untapped during a correct. and thus, the foremost serious challenge facing this area is the quality of service provided which suggests to create the diagnose during a correct manner in a timely manner and supply acceptable medications to patients. Thus Health information technology has emerged as a replacement technology within the health care sector in a short amount by utilizing Business Intelligence ‘BI’ that could be a data-driven Decision Support System. The various techniques of data mining are used and compared during this analysis.
Keywords - Business Intelligence, Data Mining, Data-Driven Decision Support System, Knowledge Discovery in Database (KDD).
--- Date of Submission: June 18, 2019 Date of Acceptance: Sep 21, 2019
---I.
INTRODUCTION
T
he appearance of information technology in numerous fields needs to lead the massive volumes of data stored in various formats like records, files, documents, images, sound, videos, scientific data, and plenty of new data formats. The data collected from totally different applications need a correct technique of extracting data from massive repositories for better decision making. Knowledge discovery in databases (KDD), typically known as data mining, aims at the invention of helpful info from massive collections of data [1]. The main functions of data mining are applying numerous ways and algorithms so as to find and extract patterns of hold on data [2]. It additionally includes the activities of decision support systems, query and reporting, on-line analytical process ‘OLAP' applied mathematics analysis, prediction, and data and text mining. The most objective of this paper is to use data mining methodologies to review HealthCare in end the data will be extracted from the electronic health record as a supply of patient medical history and health standing and touched to the Data warehouse repositories. Data mining provides several tasks that would be accustomed study HealthCare. In this research, the classification task is used to evaluate HealthCare and as there are a unit several approaches that are used for data classification, the decision tree technique is employed here.II.
DATA MINING DEFINITION AND ITS
TECHNIQUES
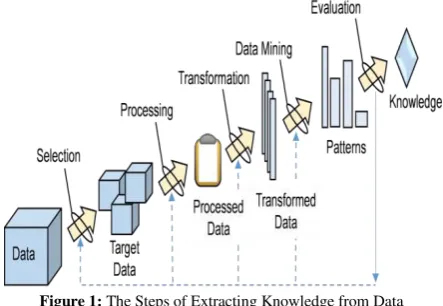
Data mining could be a method of extraction of helpful info and patterns from immense data. It's additionally known as a knowledge discovery method, knowledge mining from data, knowledge extraction or data /pattern analysis. The sequences of steps known in extracting knowledge from data are: shown in Figure 1.
Figure 1: The Steps of Extracting Knowledge from Data
2.1.CLASSIFICATION
Classification is that the most ordinarily applied data mining technique that employs a group of pre-classified examples to develop a model that may classify the population of records at massive. This approach oft employs a decision tree or neural network-based classification algorithm. In our case study, the used REP, Decision Stump, FT and J48 Decision Tree to represent logical rules of patient medical record and health status.
2.2. CLUSTERING
Clustering is finding teams of objects specified the objects in one group will be similar to one cluster are almost like each other and totally different from the objects in another cluster. In Healthy data mining, clump has been accustomed cluster blubber and polygenic disorder Indicators per their pathological case.
2.3. ASSOCIATION RULES
Association and correlation is a unit typically to search out frequent item set findings among massive data sets. This kind of finding helps Health Care to create sure decisions. Association Rule algorithms have to be compelled to be able to generate rules confidently values but one.
III.
DATA MINING PROCESS
3.1. DATA PREPARATIONSThe used data set Community Health Obesity and Diabetes Related Indicators. This data set collected from one of in the period from 2008 to 2012. Community Health Obesity and Diabetes Related Indicators data set consists of 2734 records. In this step data stored in different tables were joined in a single table after joining process errors were removed. This Obesity and Diabetes Related Indicators dataset provides a subset of data (40 indicators) for the two topics:
Obesity and Diabetes. The dataset includes percentage or rate for Cirrhosis/Diabetes and Obesity and Related Indicators, where available, for all counties, regions and state.
New York State Community Health Indicator Reports (CHIRS) were developed in 2012, and annually updated to provide data for over 300 health indicators, organized by 15 health topic and data for all counties, regions and state are presented in table format with links to trend graphs and maps.
Most recent county and state level data are provided. Multiple year combined data offers stable estimates for the burden and risk factors for these two health topics.
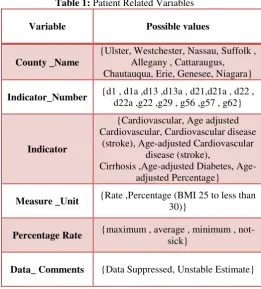
3.2. DATA SELECTION AND TRANSFORMATION In this step, solely those fields were selected which were required for data mining. A few derived variables were selected. While some of the information for the variables was extracted from the database. All the predictor and response variables that were derived from the database are given in table1.
Table 1: Patient Related Variables
Variable Possible values
County _Name
{Ulster, Westchester, Nassau, Suffolk , Allegany , Cattaraugus, Chautauqua, Erie, Genesee, Niagara}
Indicator_Number {d1 , d1a ,d13 ,d13a , d21,d21a , d22 , d22a ,g22 ,g29 , g56 ,g57 , g62}
Indicator
{Cardiovascular, Age adjusted Cardiovascular, Cardiovascular disease
(stroke), Age-adjusted Cardiovascular disease (stroke),
Cirrhosis ,adjusted Diabetes, Age-adjusted Percentage}
Measure _Unit {Rate ,Percentage (BMI 25 to less than 30)}
Percentage Rate {maximum , average , minimum , not-sick}
Data_ Comments {Data Suppressed, Unstable Estimate}
IV.
CLASSIFICATION ALGORITHMS
Classification is the most commonly applied data mining technique, which employs a set of pre-classified examples to develop a model that can classify the population of records at large. This approach frequently employs decision tree or neural network-based classification algorithms. Decisions trees are commonly used in operations research, specifically in decision analysis, to assist establish a method possibly to achieve a goal [3].A decision tree could be a flow-chart-like tree structure, wherever every internal node is denoted by rectangles, and leaf nodes are a unit denoted by ovals. All internal nodes have 2 or additional child nodes. All internal nodes contain splits, which test the value of an expression of the attributes. Arcs from an internal node to its children are labeled with distinct outcomes of the take a look at. Every leaf node contains a category label related to it [4].
In our case study we used REP tree, Decision Stump, FT and J48 Decision Tree to represent logical rules of patient medical record and health status.
4.1. REP TREE
repository and the confusion matrix is generated for sophistication gender having six potential values. [6] [7] [8]
4.2. J48 DECISION TREE
Classification is the process of building a model of classes from a set of records that contain class labels. Decision Tree Algorithm is to find out the way the attributes-vector behaves for a number of instances. Also on the bases of the training instances, the classes for the newly generated instances are being found [9]. This algorithm generates the rules for the prediction of the target variable. With the help of the tree classification algorithm, the critical distribution of the data is easily understandable [10].
4.3. DECISION STUMPS
Decision stumps (DS) are one level decision trees [11]. We can find the best stump just as we would learn a node in a decision tree: we search over all possible features to split on, and for each one, we search over all possible thresholds induced by sorting the observed values. In classification problems, each node in a decision stump represents a feature in an instance to be classified, and each branch represents a value that the node can take. Instances are classified starting at the root node and sorting them based on their feature values. In regression problems, DS (or regression stumps) do regression based on mean-squared error where each node in a decision stump represents a feature in an instance to be predicted, and each branch represents a value that the node can take. At worst a decision stump will reproduce the most common sense baseline, and may do better if the selected feature is particularly informative.
4.4. FUNCTIONAL TREES (FT)
FT combines a standard univariate DT[11], such as C4.5, with linear functions of the attributes by means of linear regressions. While a univariate DT uses simple value tests on single attributes in a node, FT can use linear combinations of different attributes in a node or in a leaf.
Figure 2: Illustration of Dataset File
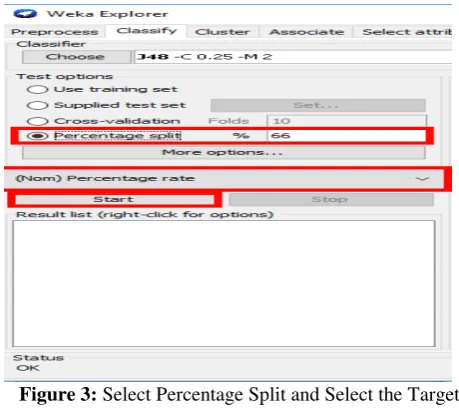
Illustrates select percentage split and select the target class as represented in Figure3.
Figure 3: Select Percentage Split and Select the Target Class
Illustrates test the classifier as represented in Figure 4.
Figure 4: Results for Training and Testing
V.
RESULTS AND DISCUSSION
The data set used in our work was the “Community Health Obesity and Diabetes Related Indicators”, which was collected within the period from 2008 to 2012. Also, it consisted of about 2734 object based on 12 attributes. After the Preprocessing and filtering Steps as with the Filtering Capabilities, the missing values capability was selected to determine every object that missed values and edit these missed values with a customized value, which we supported to handle this situation.
Basically, REP, Tree Decision Stump, FT and J48 algorithms are selected as the classification modeling algorithms, and we performed a significant comparisons between the four selected classifications algorithms based on three dimensions: Accuracy Classified, Incorrectly Classified and Time Build Model and also using different split percentages 30%, 40%, 50%, 66% and 70%, as represented in figure 3 that show the selection of 66% as the split percentage.
After performing all modeling using the four algorithms with different split percentages, the results presented in the following tables & figures.
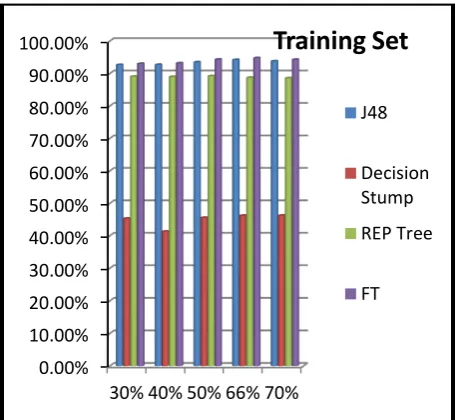
Table 2: Accuracy Comparison between J48, Decision Stump, REP Tree AND FT Algorithm in Percentage
Figure 5: Graph Showing the Accuracy Comparison between J48, Decision Stump, REP Tree AND FT Algorithm in Percentage.
Table 3: Incorrectly Comparison between J48, Decision Stump, REP Tree AND FT Algorithm in Percentage.
Figure 6: Graph showing the Incorrect Comparison between J48, Decision Stump, REP Tree AND FT Algorithm in Percentage.
Table 4: Models Build Time Comparison between J48, Decision Stump, REP Tree AND FT Algorithm in Sec
Using FT algorithm gives the best accuracy in comparison to J48, Decision Stump and REP Tree that reach to 94.73 %, and the decision stump algorithm
0.00% 10.00% 20.00% 30.00% 40.00% 50.00% 60.00% 70.00% 80.00% 90.00% 100.00%
30% 40% 50% 66% 70%
Training Set
J48
Decision Stump
REP Tree
FT
0.00% 10.00% 20.00% 30.00% 40.00% 50.00% 60.00%
30
%
40
%
50
%
66
%
70
%
J48
DecisionStump
REPTree
FT
Training Set
30% 40% 50% 66% 70%
J48 92.63 % 92.68 % 93.48 % 94.19 % 93.78 %
Decision Stump
45.27 % 41.28 % 45.53 % 46.18 % 46.22 %
REP Tree
89.02 % 88.96 % 89.17 % 88.69 % 88.54 %
FT 92.99 % 93.17 % 94.29 % 94.73 % 94.27 %
Training Set
30% 40% 50% 66% 70%
J48 0.02 sec 0.03 sec 0.03 sec 0.02 sec 0.03 sec
Decision Stump
0 sec 0 sec 0 sec 0 sec 0.02 sec
REP Tree
0.05 sec 0.03 sec 0.03 sec 0.02 sec 0.02 sec
FT 48 sec 50 sec 50 sec 48 sec 48 sec Training Set
30% 40% 50% 66% 70%
J48 7.37% 7.31% 6.52 % 5.81 % 6.22 %
Decision Stump
54.73 % 58.72 % 54.47 % 53.82 % 53.78 %
REP Tree
10.98 % 11.04 % 10.83 % 11.30 % 11.46 %
present the worst accuracy 41.28% as presented in table 2 .
The FT algorithm provides the lowest incorrect Classification in comparison to J48, Decision Stump and REP Tree (5.27 %), and the decision stump algorithm present the worst incorrect Classification 58.72% as shown in table 3 .
The performance of FT is better than J48, Decision Stump and REP Tree, as presented in table 4.
Thus, the FT algorithm is supporting the best results for our analysis processes but the decision stump algorithm presents the worst results.
VI.
CONCLUSION
In this paper, decision tree method is used on Health Care database to predict the Diseases on the basis of patient's database. We use some attribute were collected from the patient's database to predict the Diseases. This study will help the student's to improve the patient diagnosis, to identify those patient which needed special attention to reduce The rate of the disease and taking appropriate action at right time.
REFERENCES
[1]Abeer Badr El Din Ahmed1, Ibrahim Sayed Elaraby, “Data Mining: A prediction for Student's Performance Using Classification Method”, World Journal of
ComputerApplication and Technology, 2(2), 2014, 43-47.
[2] Ahmed, S., Seddawy, A. Nasr, A Proposed Framework for Detecting and Predicting Diseases through Business Intelligence Applications, International Journal of
Advanced Networking and Applications (IJANA), Volume
10, Issue 04, Jan - Feb 2019 issue, pp 3951-3957
[3] Hongjie Sun, Research on Student Learning Result System based on Data Mining, 2010.
[4] Surjeet Kumar Yadav, Brijesh Bharadwaj, and Saurabh Pal, “Mining Education Data to Predict Student’s Retention: A comparative Study”, 2012.
[5] Ian H. Witten and Eibe Frank. “Data Mining: Practical machine learning tools and techniques”. Morgan Kaufmann Publishers Inc., San Francisco, CA, USA, 2nd edition, 2005.
[6] Ian H. Witten, Eibe Frank & Mark A. Hall., “Data Mining Practical Machine Learning Tools and Techniques, Third Edition.” Morgan Kaufmann Publishers is an imprint of Elsevier,2011.
[7] Dr. B. Srinivasan, P.Mekala, “Mining Social Networking Data for Classification Using REPTree”, International Journal of Advance Research in Computer Science and Management Studies, Volume 2, Issue 10, October 2014 pp155-160
[8] Payal P.Dhakate, Suvarna Patil, K. Rajeswari, Deepa Abin, “Preprocessing and Classification in WEKA Using Different Classifier”, Int. Journal of Engineering Research and Applications, Vol. 4, Issue 8( Version 5), August 2014, pp91-
[9] Korting, Thales Sehn. "C4. 5 algorithm and Multivariate Decision Trees." Image Processing Division, National Institute for Space Research--INPE.
[10] Nadali, A; Kakhky, E.N.; “Nosratabadi, H.E., "Evaluating the success level of data mining projects based on CRISP-DM methodology by a Fuzzy expert system,” Electronics Computer Technology (ICECT), 2011 3rd International Conference on , vol.6, no., pp.161,165, 8- 10 April.
[11] W. Iba, & P. Langley, Induction of one-level decision trees. Proc. of the Ninth Inter. Machine Learning