196
Short Communication
Study of karyotype and Nucleolar Organizer Regions (NORs)
in wild, synthetic and cultivated wheats
M. Arabbeigi, A. Arzani∗ and G. Saeidi
Agronomy and Plant Breeding Department, College of Agriculture, Isfahan University of Technology, Isfahan-84156 83111, Iran
Abstract: Wild relatives of bread wheat are potential sources of valuable genetic materials for wheat improvement. Karyotype analysis plays an important role in the identification and designation of chromosomes in many plant species. In this study, the karyotype features and nucleolar organizer regions (NORs) of 21 wheat genotypes representing diploid, tetraploid and hexaploid species and belonging to wild, cultivated and synthetic groups were investigated. Total chromosome length (TCL) values vary across the genotypes. The highest value (99.1 µm) was recorded in one of a synthetic hexaploid wheat (Doy1/ Ae. squarrosa (458)) with a mean chromosome length (MCL) of 5.67±0.59 µm, while the lowest value (39.48µm) was found in T. monococcum species with a mean chromosome length (MCL) of 4.06±0.51 µm. Cluster analysis based on chromosomal characteristics and karyotype asymmetry indices including symmetry index (S %), total form percentage (TF %), Romero-Zarco’s indices (A1and A2) and Stebbin’s classification divided the genotypes into three groups. Results revealed that group 1, including synthetic hexaploid wheat accessions, had the most asymmetric karyotype in terms of centromere position and chromosome length. Ag-NOR banding identified two nucleolus organizer regions (NORs) on the long arms of the chromosomes 1B and 6B in both tetraploid and hexaploid wheats.
Keywords: Wild relatives, synthetic wheat, chromosome, karyotype, nucleolus organizer regions.
ﺔﺳارد
ﻲﻣﻮﺳﻮﻣوﺮﻜﻟا
زﺮﻄﻟا
)
يوﻮﻨﻟا
ﻢﻈﻨﻤﻟا
ﻖﻃﺎﻨﻣو
NORs
عورﺰﻤﻟاو
يﺮﺒﻟا
ﺢﻤﻘﻟا
ﻰﻓ
(
ﻲﻧازرا .ا ، ﻲﺠﺑارا .م * يدﺎﻴﺳ ج و ﺔﻋارﺰﻟا ﺔﻴﻠآ ، تﺎﺒﻨﻟا ﺔﻴﺑﺮﺗو ﻞﻴﺻﺎﺤﻤﻟا ﻢﺴﻗ ، ﺎﻴﺟﻮﻟﻮﻨﻜﺘﻠﻟ نﺎﻬﻔﺻا ﺔﻌﻣﺎﺟ ، نﺎﻬﻔﺻا 84156 ناﺮﻳا ، ﺺﺨﻠﻤﻟا : ﻷا برﺎﻗ ﺔﻳﺮﺒﻟا ﻟ ﺰﺒﺨﻟاﺢﻤﻘ ﺪﻌﺗ ﻟﺔﻠﻤﺘﺤﻣردﺎﺼﻣ ﻞﻴﻠﺤﺗﺐﻌﻠﻳ .ﺢﻤﻘﻟاﻦﻴﺴﺤﺘﻟﺔﻤﻴﻗﺔﻴﻨﻴﺟداﻮﻤ ا ﻲﻣﻮﺳﻮﻣوﺮﻜﻟازﺮﻄﻟ ﻲﻓﺎﻣﺎهارود ﻮﻣوﺮﻜﻟا ﻦﻴﻴﻌﺗو ﺪﻳﺪﺤﺗ ﺳ .ﺔﻴﺗﺎﺒﻨﻟا عاﻮﻧﻷا ﻦﻣ ﺪﻳﺪﻌﻟا ﻲﻓ تﺎﻣﻮ ﺖﺜﺤﺑ ﺔﺳارﺪﻟا ﻩﺬه ﻲﻣﻮﺳﻮﻣوﺮﻜﻟا زﺮﻄﻟا يوﻮﻨﻟا ﻢﻈﻨﻤﻟا ﻖﻃﺎﻨﻣو ) NORs ( ) ﻦﻣ 21 ﻦﻣ ﺢﻤﻘﻟاعاﻮﻧأ ﻲﺋﺎﻨﺜﻟ ﻲﻋﺎﺑرو، ﻲﺳاﺪﺳو ﻲﺛارﻮﻟاﻢﻗﺎﻄﻟا ﻲﻤﺘﻨﺗ ﻰﻟإ عاﻮﻧﻷا ﻤﻟاوﺔﻳﺮﺒﻟا وﺔﻋورﺰ نﺎآ . ﺔﺒآﺮﻤﻟا مﻮﺳﻮﻣوﺮﻜﻟالﻮﻃعﻮﻤﺠﻣ (TCL) ﺮﺒﻋﻢﻴﻘﻟاﻒﻠﺘﺨﺗ ﺔﻴﺛارﻮﻟاﺐﻴآاﺮﺘﻟا ﺖﻠﺠﺳو . ﻂﺳﻮﺘﻣ ) ﺔﻤﻴﻗﻰﻠﻋا 99.1 ﺢﻤﻘﻟاﻦﻣةﺪﺣاوﻲﻓ (نوﺮﻜﻴﻣ ﺔﻴﻐﺒﺼﻟاﺔﻐﻴﺼﻟاﻲﺳاﺪﺳ ﺔﺒآﺮﻤﻟا
(Doy1 / Ae squarrosa (458)) .
ﻊﻣ ﻂﺳﻮﺘﻣ مﻮﺳﻮﻣوﺮﻜﻟالﻮﻃ
(MCL) 5،67
نوﺮﻜﻴﻣ
±
0،59
ﻦﻴﺣﻲﻓ، ﺖﻧﺎآ ) ﺔﻤﻴﻗﻰﻧدأ 39.48 μm عاﻮﻧﻷاﻲﻓ monococcum ﻊﻣ ﻂﺳﻮﺘﻣ ﻦﻣمﻮﺳﻮﻣوﺮﻜﻟالﻮﻃ
0،51 ± 4،06 .نوﺮﻜﻴﻣ ﻢﺴﻗ ﻢﺋﺎﻘﻟاﻞﻴﻠﺤﺘﻟا ) تﺎﻋﻮﻤﺠﻤﻟاﻢﺴﻘﺗﻰﻠﻋ Cluster analysis ( ًءﺎﻨﺑ ﺎﻤﺑيوﻮﻨﻟاﻂﻤﻨﻟاتوﺎﻔﺗتاﺮﺷﺆﻣوتﺎﻣﻮﺳﻮﻣوﺮﻜﻟاﺺﺋﺎﺼﺧﻰﻠﻋ ﺮﺷﺆﻣ ﻚﻟذ ﻲﻓ ) ﻞﺛﺎﻤﺘﻟا S% و ( عﻮﻤﺠﻣ ) جذﻮﻤﻨﻟاﺔﺒﺴﻧ TF% وﺮﻴﻣورتاﺮﺷﺆﻣو ،( -ﻮآراز ) ل (A1and A2 ﻒﻴﻨﺼﺗو Stebbin ﺔﻋﻮﻤﺠﻤﻟانأ ﺞﺋﺎﺘﻨﻟاﺖﻔﺸآو .تﺎﻋﻮﻤﺠﻣ ثﻼﺛﻰﻟإتﺎﺛرﻮﻤﻟا 1 ﻲﺳاﺪﺳﻚﻟذ ﻲﻓﺎﻤﺑ، ﻲﺛارﻮﻟا ﻢﻗﺎﻄﻟا ﺔﺒآﺮﻤﻟا ﻰﻠﻋأﺖﻧﺎآ ﺐﻴآاﺮﺘﻟا ﺣ ﻦﻣﺔﻬﺑﺎﺸﺘﻣﺮﻴﻐﻟاتﺎﻣﻮﺳﻮﻣوﺮﻜﻟاﺚﻴﺣﻦﻣﺔﻴﺛارﻮﻟا و .مﻮﺳﻮﻣوﺮﻜﻟالﻮﻃوﺮﻴﻣوﺮﺘﻨﺴﻟا ﻊﻗﻮﻣﺚﻴ دﺪﺣ رﺎﺒﺘﺧا تﺎﻗﺎﻄﻨﻟا Ag-NOR ﻮﻧﻢﻈﻨﻣﻦﻴﺘﻘﻄﻨﻣ يو (NORs) ﻲﻓﺔﻠﻳﻮﻄﻟاعارﺬﻟاﻰﻠﻋ تﺎﻣﻮﺳﻮﻣوﺮﻜﻟا 1B 6 B , .ﺔﻴﺳاﺪﺴﻟاوﺔﻴﻋﺎﺒﻟاحﺎﻤﻗﻷاﻦﻣﻞﻜﻟ
Introduction
Wheat is one of the most important cereal crops in the world. It is estimated that more than 75% of the world’s population consume wheat as part of their daily diet (Ginkel and Ogbonnaya, 2007).Wild relatives of wheat are a valuable source of genetic variation that can be utilized in wheat improvement (Linc et al., 1999). The genera Aegilops L. and Triticum L. have contributed two (B and D) and one (A) of the three bread wheat genomes, respectively. A large number of genes have been transferred from wild Triticum and Aegilops species to the cultivated wheat, including those for resistance to leaf rust, stem rust, yellow rust and powdery mildew as well as various pests (cereal cyst nematode, root knot nematode, Hessian fly, and green bug) (Schneider et al., 2008). There are still many untapped genetic resources in the wild Triticum and Aegilops species that could be used as resistance sources for plant breeding. However, the directed exploitation of this variability requires detailed knowledge of the genetic and cytogenetic structure of these species. Synthetic hexaploid wheat, produced by crossing T. turgidum L. spp (2n = 4x = 28, AB genomes) with A. tauschii Coss. (2n = 2x =14, D genome), is considered as a promising source of exotic alleles for introgression into wheat (Mujeeb-Kazi et al., 2008). Because hexaploid wheat has no close relative species at the hexaploid ploidy level, the synthetic hexaploid wheat can be also used as an intermediary for transferring the desired traits from the wild ancestor to the cultivated wheat (Del Blanco et al., 2001). Cytogenetic studies provide the opportunity to compare wild and domesticated populations with a view to chromosome characteristics during cell division. Chromosomal differences in structure and size indicate the genetic variation among plant species. Systematic study of landraces from centers of diversity where the effect of modern breeding is minimal may provide a good opportunity to gain knowledge on the natural karyotype evolution (Belay et al., 1994). Therefore, cytogenetic information will make a substantial contribution to the effective
utilization of these landraces in plant breeding. Karyotype analysis has played an important role in the identification and designation of chromosomes in many plant species. Karyotype studies are principally based on the idea that symmetrical karyotypes are more primitive than asymmetrical ones (Razik Kamel, 2006).
Nucleolus organizer regions are a very important landmark for recognition and identification of chromosomes in plant species. Ag-NOR banding has been vastly used to analyze nucleolus activity in diploid and polyploidy plants, interspecific hybrids and chromosome addition lines (Fukui and Nakayama, 1997). The method of staining nucleolus organizing regions (NORs) of chromosomes with silver nitrate (the silver-staining procedure) is also suitable for estimation of rDNA transcription rate in plants. For example, this approach has been used for the estimation of NOR activity in onion leaves and wheat roots treated with plant growth (Fatkhutdinova et al., 2002). In hexaploid wheat, three chromosome pairs (IB, 6B, and 5D) are known to possess nucleolar activity; however, usually only 1B and 6B show a secondary constriction (Cermeno et al., 1984). Each diploid Triticeae species has either one or two chromosome pairs with NORs, which are present in different locations on the chromosomes of homoelogous groups 1, 5 and 6. These major NORs contain from hundreds to thousands of 18S-26S rRNA repeated gene units and their expression can be visualized by their nucleolus organizing activity and Ag-NOR banding (Badaeva et al., 1996).
The objective of the present work was to investigate the karyotypic characteristics and Ag-NOR banding pattern of 21 genotypes possessing the three ploidy levels of diploid, tetraploid and hexaploid, belonging to the three wild, cultivated and synthetic growing statuses.
Materials and Methods Plant materials
198 genotypes (belonging to the nine species of Ae. umbellulata, Ae. cylindrica, Ae. crassa, Ae. triuncialis, Triticum monococcum, T. dicoccoides, T. dicoccum, T. compactum, and T. durum) in addition to four synthetic
hexaploid wheats were used in this study. Details of the genetic materials used including species, genome, growing status and origin are given in Table 1.
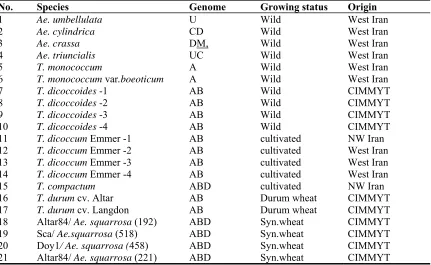
Table 1. Plant materials (Aegilops ssp, Triticum ssp and synthetic hexaploid wheat) used in this study.
No. Species Genome Growing status Origin
1 Ae. umbellulata U Wild West Iran
2 Ae. cylindrica CD Wild West Iran
3 Ae. crassa DM, Wild West Iran
4 Ae. triuncialis UC Wild West Iran
5 T. monococcum A Wild West Iran
6 T. monococcum var.boeoticum A Wild West Iran
7 T. dicoccoides -1 AB Wild CIMMYT
8 T. dicoccoides -2 AB Wild CIMMYT
9 T. dicoccoides -3 AB Wild CIMMYT
10 T. dicoccoides -4 AB Wild CIMMYT
11 T. dicoccum Emmer -1 AB cultivated NW Iran
12 T. dicoccum Emmer -2 AB cultivated West Iran
13 T. dicoccum Emmer -3 AB cultivated West Iran
14 T. dicoccum Emmer -4 AB cultivated West Iran
15 T. compactum ABD cultivated NW Iran
16 T. durum cv. Altar AB Durum wheat CIMMYT
17 T. durum cv. Langdon AB Durum wheat CIMMYT
18 Altar84/ Ae. squarrosa (192) ABD Syn.wheat CIMMYT
19 Sca/ Ae.squarrosa (518) ABD Syn.wheat CIMMYT
20 Doy1/ Ae. squarrosa (458) ABD Syn.wheat CIMMYT 21 Altar84/ Ae. squarrosa (221) ABD Syn.wheat CIMMYT
Cytological procedures
Cytological preparations were carried out using root tips obtained from seeds germinated on sterile moist filter paper in Petri dishes at 25°C. Roots were pretreated with α -bromonaftalin solution for 5–6 h, fixed in a chromic-acid formaldehyde fluid (1:1 of 1% chromic acid + 10% formaldehyde) for 24 h and stored in 70% ethanol at 4°C. Then, the root tips were hydrolyzed in 1 N HCl at 60°C for 10 min, stained with hematoxylin (4%) for 4 h at 30°C, and squashed in 45% glacial acetic acid. Chromosome images were taken under a Nikon Eclipse E600 light microscope using the Photograb 300Z software (Fuji Photo Film Co. Ltd).
Karyotypic features such as total chromosome length (TCL), mean chromosome length (MCL), mean arm ratio (MAR), and
difference of range relative length (DRL) were measured by the Micromeasure software. Some karyotype asymmetry indices such as symmetry index (S%), total form percentage (TF%), Romero-Zarco’s indices and Stebbin’s classification were calculated statistically.
Results and Discussion Karyotype features
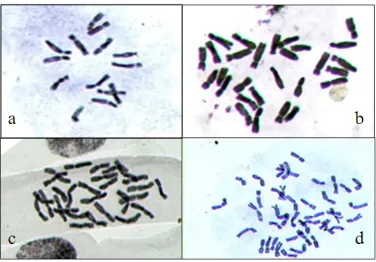
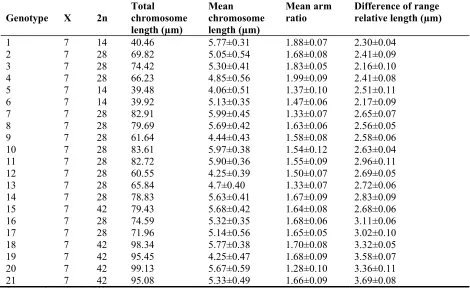
The mitotic metaphase chromosomes of Ae. umbellulata as a wild diploid species relative of wheat, Ae. crassa as a wild tetraploid species relative of wheat, T. durum cv. Altar as a tetraploid cultivated wheat and Altar84/ Ae. squarrosa (192) as a synthetic hexaploid wheat are shown in Figure 1. A summary of the karyological features of the studied genotypes is given in Table 2. Total chromosome length (TCL) values vary across the genotypes. The highest value (99.1 µm) was recorded in one of a synthetic hexaploid wheat (Doy1/ Ae. squarrosa (458)) with a mean chromosome length (MCL) of 5.67±0.59 µm, while the lowest value (39.48µm) was found in T. monococcum species with a mean chromosome length (MCL) of 4.06±0.51 µm. These results are in agreement with those of
Razik Kamel (2006) who reported that total chromosome length (TCL), mean chromosome length (MCL) and mean arm ratio (MAR) varied among some genotypes of T. aestivum. The highest value for difference of range relative length (DRL: 3.69±0.08 µm) was found in one of the synthetic hexaploid wheat (Altar84/ Ae. squarrosa (221)) and the lowest value (2.16±0.10 µm) was recorded in Ae. crassa. Difference of range relative length (DRL) indicates variations between maximum and minimum relative lengths in a karyotype, which is used as a parameter for determining the rate of symmetry in a karyotype. Genotypes with less DRL have a more symmetric karyotype. Chromosomal characteristics also showed variations within the species that confirmed the results from previous studies (Friebe et al., 1995; Belay et al., 1994; Linc et al., 1999).
200
Table 2. Means (±SE) of karyological characteristics of the wheat genotypes studied.
Genotype X 2n
Total chromosome length (µm)
Mean chromosome length (µm)
Mean arm ratio
Difference of range relative length (µm)
1 7 14 40.46 5.77±0.31 1.88±0.07 2.30±0.04
2 7 28 69.82 5.05±0.54 1.68±0.08 2.41±0.09
3 7 28 74.42 5.30±0.41 1.83±0.05 2.16±0.10
4 7 28 66.23 4.85±0.56 1.99±0.09 2.41±0.08
5 7 14 39.48 4.06±0.51 1.37±0.10 2.51±0.11
6 7 14 39.92 5.13±0.35 1.47±0.06 2.17±0.09
7 7 28 82.91 5.99±0.45 1.33±0.07 2.65±0.07
8 7 28 79.69 5.69±0.42 1.63±0.06 2.56±0.05
9 7 28 61.64 4.44±0.43 1.58±0.08 2.58±0.06
10 7 28 83.61 5.97±0.38 1.54±0.12 2.63±0.04
11 7 28 82.72 5.90±0.36 1.55±0.09 2.96±0.11
12 7 28 60.55 4.25±0.39 1.50±0.07 2.69±0.05
13 7 28 65.84 4.7±0.40 1.33±0.07 2.72±0.06
14 7 28 78.83 5.63±0.41 1.67±0.09 2.83±0.09
15 7 42 79.43 5.68±0.42 1.64±0.08 2.68±0.06
16 7 28 74.59 5.32±0.35 1.68±0.06 3.11±0.06
17 7 28 71.96 5.14±0.56 1.65±0.05 3.02±0.10
18 7 42 98.34 5.77±0.38 1.70±0.08 3.32±0.05
19 7 42 95.45 4.25±0.47 1.68±0.09 3.58±0.07
20 7 42 99.13 5.67±0.59 1.28±0.10 3.36±0.11
21 7 42 95.08 5.33±0.49 1.66±0.09 3.69±0.08
Genotype numbers are based on Table 1.
Karyotype asymmetry indices
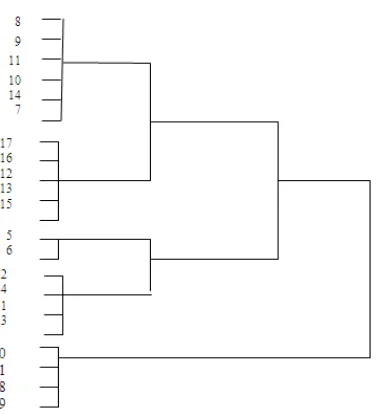
Cluster analysis based on chromosomal characteristics and karyotype asymmetry indices divided the genotypes into three groups (Table 3; Figure 2). Synthetic hexaploid wheats were included in the first group, wild relatives of wheat including the Aegilops species and T. monococcum were grouped in the second group, and other genotypes were classified in the third group. A symmetrical karyotype is characterized by the predominance of metacentric and submetacentric chromosomes of approximately the same size. Increasing asymmetry can occur either through the shift of centromere position from median/submedian to
terminal or subterminal positions, or through the accumulation of differences in the relative size between the chromosomes of the complement. The average values of the symmetry index (S%) in groups 1, 2, and 3 were 49.93, 70.08 and 61.08, respectively. Symmetry index is the ratio of the length of the lowest chromosome in a complement to the length of the largest chromosome, which is used for investigating the symmetry karyotype. Value of this index close to 100% indicates that the chromosomes are of similar length while some differences may exist in other karyotype features.
Table 3. Karyotype asymmetry indices of 3 groups in the cluster analysis.
Group symmetry index %
total form percentage %
intrachromosomal
asymmetry index interchromosomal asymmetry index Stebbinsclassification ُ
1 49.93 35.47 0.33 0.13 A
2 70.08 34.39 0.37 0.12 A
Figure 2. Cluster analysis of wheat genotypes based on karyotypic characteristics.
Group 3 possessed the highest value for total form percentage (TF% = 39.59). The values for this parameter in groups 1 and 2 were 35.47 and 34.39, respectively. The TF% index is expressed by the ratio of sum of short arm lengths of individual chromosomes to the total haploid length of the complement. The TF% index has frequently been used to describe karyotype asymmetry and to determine the karyotypic relationships between species of genera (Mercado-Ruaro and Delgado-Salinas, 1998; Ruas et al., 2000; Costa and Forni-Martins, 2003). The TF% index is one of the karyotype asymmetry indices that indicates the variation in centromere position in a chromosome complement. Therefore, the chromosomes in the first group containing synthetic hexaploid wheat had a greater variation in centromere position than other studied genotypes. Romero Zarco (1986) provided an alternative method for measuring karyotype asymmetry by using quantification and graphic representation. He proposed two numerical parameters to estimate karyotype asymmetry. The first was named ‘intrachromosomal asymmetry index’ (A1) that
ranges from 0 to 1, and the second,
‘interchromosomal asymmetry index’ (A2),
which is the ratio between the standard deviation and the mean chromosome length. Both Romero Zarco indices have been used to estimate karyotype asymmetry between different species (Seijo and Fernandez, 2003; Liu, 2004; Cozzolino et al., 2004). Results indicated that group 1 (e.g. synthetic hexaploid wheat accessions) had the highest values of both the intrachromosomal asymmetry index (A1 =0.45) and the interchromosomal
asymmetry index (A2 = 0.18). The A1 index
was designed to evaluate variation in centromere position in a chromosome complement. The A2 index was created to
assess the variation in chromosome length in a complement and is a relative standard deviation of chromosome length. From a statistical point of view, it is a sensible parameter which adequately assesses the relative variation in chromosome length in a complement. Stebbin’s classification (1971) method indicated that group 1 belongs to class B while other groups may be classified in different degrees of class A. Karyotype asymmetry of a complement is determined by the variation in chromosome length and the variation in centromere position. The two methods, Stebbin’s classification (1971) and Romero Zarco (1986) indices (A1
and A2), use a combination of both types of
variation that affect karyotype asymmetry (Paszko, 2006).
202
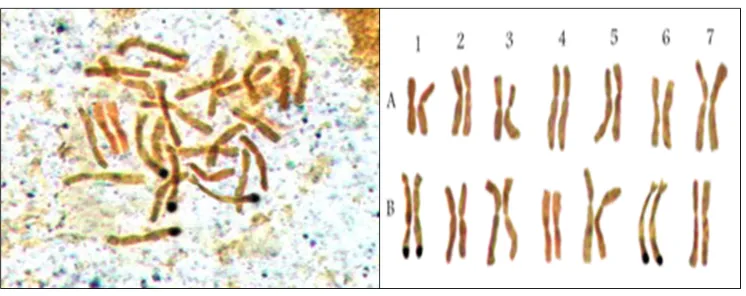
Figure 3. Ag-NOR staining in a tetraploid wheat (T. durum cv. ‘Langdon’).
Ag-NOR banding identified two nucleolus organizer regions (NORs) on the long arms of the homologue chromosomes 1B and 6B in tetraploid wheat (Figure 3), confirming the results from previous studies (Hutchinson and Millert, 1982). In diploid and tetraploid Aegilops species, nucleolus organizer regions were observed on group 1, 5, and 6 chromosomes, confirming previous observations (Friebe et al., 1995; Badaeva et al., 2004). In the hexaploid wheat, three pairs of chromosomes showed a secondary constriction identified as being 1B, 6B, and 5D, while two NORs were identified on the homologue chromosomes 1B and 6B by Ag-NOR banding. This result does not entirely agree with those from some of the previous studies that concluded that three chromosome pairs – IB, 6B, and 5D – possess nucleolar activity in the hexaploid wheat; however, usually only 1B and 6B show a secondary constriction (Cermeno et al., 1984). Inconsistency in NOR-resolution is a common phenomenon reported in several species. Waines and Kimber (1973) observed this in T. monococcum L., and Endo and Gill (1984) reported it for chromosome 6B in 'Chinese spring' cultivar (T. aestivum L.).
References
Badaeva, E. D., B. Friebe and B. S. Gill. 1996. Genome differentiation in Aegilops. 2.
Physical mapping of 5s and 18s-26s ribosomal RNA gene families in diploid species. Genome 39:1150-1158.
Badaeva, E. D., B. Friebe, S. A. Zoshchuk, A. V. Zelenin, and B. S. Gill. 1998. Molecular cytogenetic analysis of tetraploid and hexaploid Aegilops crassa. Chromosome Res. 6:629-637.
Badaeva, E. D., A. V. Amosova, T. E. Samatadze, S. A. Zoshchuk, N. G. Shostak, N. N. Chikida, A. V. Zelenin, W. J. Raupp, B. Friebe and B. S. Gill. 2004. Genome differentiation in Aegilops. 4. Evolution of the U-genome cluster. Plant Syst. Evol. 246:45–76.
Belay, G., A. Merker and T. Tesemma. 1994. Cytogenetic studies in Ethiopian landraces of tetraploid wheat (Triticum turgidum L.). Hereditas 121:45-52.
Cermeno, M. C., J. Orellana, J. L. Santos and J. R. Lacadena. 1984. Nucleolar organizer activity in wheat, rye, and derivatives analyzed by a silver staining procedure. Chromosoma 89:370-376.
Costa, J. Y. and E. R. Forni-Martins, 2003. Karyology of some Brazilian species of Alismataceae. Bot. J. Linn. Soc. 143:159– 164.
selection in Mediterranean orchids: karyotype differences compensate for the lack of pollinator specificity. Proc. Roy. Soc. Lond. B (Suppl.) 271:259–262.
DelBlanco, I. A., S. Rajaram and W. E. Kronstad. 2001. Agronomic potential of synthetic hexaploid wheat-derived populations. Crop Sci. 41:670-676.
Endo, T. R. and B. S. Gill. 1984. Somatic karyotype, heterochromatin distribution, and nature of chromosome differentiation in common wheat, Triticum aestivum L. em Thell. Chromosoma 89:361 -369.
Fatkhutdinova, R. A., F. M. Shakirova, A. V. Chemeris, B. E. Sabirzhanov, and A. V. Vakhitov. 2002. NOR activity in wheat species with different ploidy levels treated with phytohormones. Rus. J. Genet. 38:1335-1338.
Friebe, B., J. Jiang, N. A. Tuleen and B. S. Gill. 1995. Standard karyotype of Triticum umbellulata and the characterization of derived chromosome addition and translocation lines in common wheat. Theor. Appl. Genet.90:150-156.
Fukui, K. and S. H. Nakayama. 1997. Plant Chromosomes: Laboratory Methods. CRC Press. New York. U.S.A.
Ginkel, M. and F. Ogbonnaya. 2007. Novel genetic diversity from synthetic wheats in breeding cultivars for changing production conditions. Field Crops Res. 104:86-94. Hirai, H., Y. Hasegawa, Y. Kawamoto and E.
Tokita. 1998. Tandem duplication of nucleolus organizer region (NOR) in the Japanese macaque Macaca fuscata fuscata. Chromosome Res. 6:191–197.
Hutchinson, J. and T. E. Millert. 1982. The nucleolar organizers of tetraploid and hexaploid wheats revealed by in situ hybridization. Theor. Appl. Genet. 61:285-288.
Linc, G., B. R. Friebe, R. G. Kynast, M. Molnar-Lang, B. Koszegi J. Sutka and B. S. Gill. 1999. Molecular cytogenetic analysis
of Aegilops cylindrica Host. Genome 42:497-503.
Liu, J. Q. 2004. Uniformity of karyotypes in Ligularia (Asteraceae: Senecioneae), a highly diversified genus of the eastern Qinghai – Tibet Plateau highlands and adjacent areas. Bot. J. Linn. Soc. 144:329–342.
Mercado-Ruaro, P. and A. Delgado-Salinas. 1998. Karyotypic studies on species of Phaseolus (Fabaceae: Phaseolinae). Am. J. Bot. 85:1–9.
Mujeeb-Kazi, A., A. Gul, M. Farooq, S. Rizwan and I. Ahmad. 2008. Rebirth of synthetic hexaploids with global implications for wheat improvement. Aust. J. Agric. Res. 59:391–398.
Paszko, B. 2006. A critical review and a new proposal of karyotype asymmetry indices. Plant Syst. Evol. 285:39-48.
Razik Kamel, E. A. 2006. Karyotype characterization and polyploidy variation in some genotypes of Triticum aestivum L. Cytologia 71:169-174.
Romero Zarco, C. 1986. A new method for estimating karyotype asymmetry. Taxon 35:526–530.
Ruas, P. M., C. F. Ruas, E. M. D. Maffei and M. A. Marin- Morales. 2000. Chromosome studies in the genus Mikania (Asteraceae). Genet. Mol. Biol. 23:979–984.
Schneider, A., L. Molnar and M. Lang. 2008. Utilisation of Aegilops (goatgrass) species to widen the genetic diversity of cultivated wheat. Euphytica 163:1-19.
Seijo, J. G. and A. Fernandez. 2003. Karyotype analysis and chromosome evolution in South American species of Lathyrus (Leguminosae). Am. J. Bot. 90:980–987. Stebbins, G. L. 1971. Chromosomal evolution
in higher plants. Ltd., London, UK.