Asian J. Med. Biol. Res. 2017, 3 (1), 38-43; doi: 10.3329/ajmbr.v3i1.32034
Asian Journal of
Medical and Biological Research
ISSN 2411-4472 (Print) 2412-5571 (Online) www.ebupress.com/journal/ajmbr
Article
Genotype x environment interaction of wheat genotypes under salinity
environments
Md. Saleh Uddin1*, Md. Sultan Alam1, Nasrin Jahan1, Kazi Md. Wayaz Hossain2 and Md. Ali Newaz2
1
Regional Agricultural Research Station, BARI, Rahmatpur, Barisal-8211, Bangladesh
2
Department of Genetics and Plant Breeding, BAU, Mymensingh, Bangladesh
*Corresponding author: Dr. Md. Saleh Uddin, PSO, Regional Agricultural Research Station, BARI, Rahmatpur, Barisal-8211, Bangladesh. E-mail: [email protected]
Received: 12 January 2017/Accepted: 13 March 2017/ Published: 30 March 2017
Abstract: Genotypes x environment interaction as well as stability of performance were determined for grain yield and yield contributes of 12 wheat genotypes under four salinity levels of environments (control, 8, 12, 16 dS/m). Significant genotype-environment interaction (linear) for days to heading, plant height, number of spikes per plant and grains per spikes, 1000-grain weight and grain yield per plant at 1% level of probability when tested against pooled deviation. Both the environment (linear) and genotype x environment (linear) components of variation for stability were also significant indicating that prediction of the genotypes on the environment appeared feasible for all the characters. The variance due to pooled deviation was significant for only days to heading. Considering all the three stability parameter, genotype G11 was found most stable among all the genotypes for grain weight of wheat. Among the genotypes G11, G22, G24, G33 and G40 were most desirable for yield per plant. The genotype G32 showed more responsiveness to changing environment and was suited only for highly favorable environments. Based on three stability parameters, G11, G22 and G37 were the most stable and desirable genotypes with reasonable good yield among the all.
Keywords: genotype; environment; stability; wheat genotype; salinity
1. Introduction
environments (Morale et al., 1991). Therefore, the experiment was conducted to estimate the nature of genotype and environment interaction in wheat under artificially induced saline environment.
2. Materials and Methods 2.1. Treatment
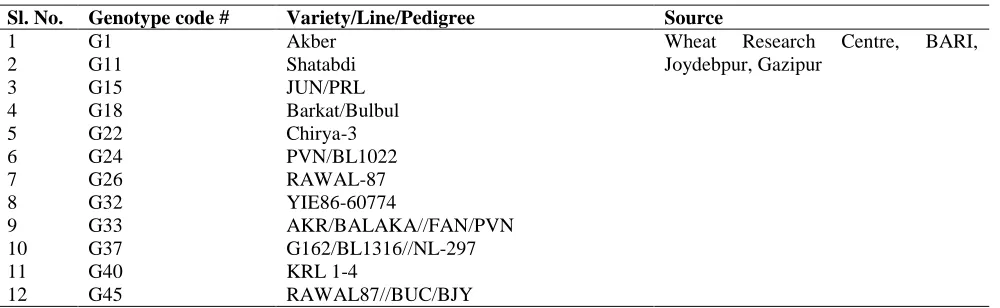
In this experiment, 12 genotypes were evaluated under four artificially induced saline environment (control, 8, 12, 16 dS/m). List of wheat genotypes are shown in Table 1.
Table 1. List of wheat entries with pedigree used in the experiment.
Sl. No. Genotype code # Variety/Line/Pedigree Source
1 G1 Akber Wheat Research Centre, BARI,
Joydebpur, Gazipur
2 G11 Shatabdi
3 G15 JUN/PRL
4 G18 Barkat/Bulbul
5 G22 Chirya-3
6 G24 PVN/BL1022
7 G26 RAWAL-87
8 G32 YIE86-60774
9 G33 AKR/BALAKA//FAN/PVN 10 G37 G162/BL1316//NL-297
11 G40 KRL 1-4
12 G45 RAWAL87//BUC/BJY
The experiment was conducted in pot culture under semi-controlled environment (inside plastic greenhouse) and natural light during the season of 2009-10. This was two factor experiment following randomized complete block design with three replications.
2.2. Pot preparation and plant raising
Pots were prepared with the dried soil and evenly mixed well rotten cow dung at the ratio of 3:1 (by volume). Clean and dry plastic pots of 12 liter size were used for each hybrid. Each pot was then filled with 10 kg previously prepared growth media (soil and cow dung mixture). Fertilizations were done following BARC fertilizer recommendation guide-2005. After pot preparation ten seeds per pot were sown by making holes and keeping more or less equal distances. Ten days after germination five seedlings of each genotypes in each pot and after seedling establishment two uniform healthy plants were allowed to grow in each pot.
2.3. Salinity development
Salt solution was prepared artificially by dissolving calculated amount of commercially available NaCl with tap water to make 80, 120 and 160 mM NaCl solution. The electric conductivity (EC) of the respective salt solutions was equivalent to 8, 12, 16 dS/m, respectively and 0.8 dS/m for tap water (control). The salt solution was applied with an increment of 30 mM at every alternate day till the respective concentrations were attained. Plants in control group were irrigated with tap water. Treatment solution was applied in excess so that extra solution dripped out from the bottoms of the pots (Ashraf and McNeilly, 1988; Aziz et al., 2005, 06).
2.4. Data collection and analysis
Days to heading, days to maturity, plant height (cm), number of spikes per plant, number of grains per spike, 1000-grain weight (g), grain yield/plant were recorded with standard procedure. Genotype and environmental interactions were estimated according to Eberhart and Russell (1966).
3. Results and Discussion 3.1. Pooled analysis of variance
al. (2002) reported significant genotype-environment interaction (linear) for plant height, while Madariya et al. (2001) also observed significant genotype-environment interactions (linear) for grain number per spike, 1000 grain weight and yield. This indicates that the genotypes differed considerably with respect to their stability in different environments (salinity levels). Both the environment (linear) and genotype x environment (linear) components of variation for stability were also significant indicating that prediction of the genotypes on the environment appeared feasible for all the characters. The variance due to pooled deviation was significant for only days to heading. This suggest that the genotypes fluctuated significantly from their respective linear path of response to environments as well as considerable genetic diversity among the materials for days to heading. Mean square due to pooled deviation was not significant for all characters except days to heading which indicated that the major components of differences in stability for these characters was due to the linear regression and not the deviation from linear function (Ghose and Das, 1981; Ahmed and Khatum, 1996; Hossain et al., 2004).
3.2. Stability and response parameter
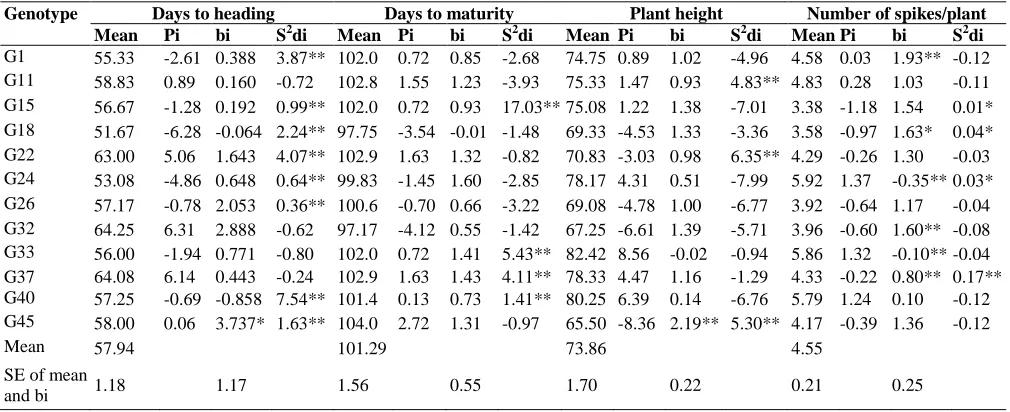
The mean performance of individual genotypes along with their estimated stability parameters for yield and its contributing characters are presented in Table 3 and Table 4. The results were discussed character wise as follows:
3.2.1. Days to heading
For days to heading, early to medium flowering type are generally preferred i.e. negative phenotypic index (Pi) is desirable. Seven genotypes such as G1, G15, G18, G24, G26, G33 and G40 to be desirable for this character. A genotype with larger bi value indicates its highest degree of response to environmental changes. In the study genotyped G22, G26, G32, and G45 was very sensitive to changes of environments. The genotypes G1, G15, G18, G22, G24, G26, G40 and G45 showed significant S2di values which indicate that they were more affected by the environmental fluctuations i.e. performance of these genotypes were unpredictable. Genotype G45 had both bi and S2di significant, indicating high genotype x environment interaction for this trait. Genotypes G11, G33, G37 and G40 however, exhibited non-significant S2di values which suggest that the performance among the genotypes were predictable in nature. Among the genotypes, G33 showed bi value of nearly unity (0.771) with non-significant S2di and also had the higher negative indices, indicating that the genotype was fairly stable and less sensitive to environmental changes.
3.2.2. Days to maturity
The genotype environment interaction (linear) was non-significant for days to maturity. Genotypes G18, G24, G26, and G32 had the negative phenotypic indices, therefore, they are desirable genotypes with early maturity. Genotypes G11, G22, G24, G33, G37 and G45 showed bi value higher than the unity, indicating their suitability only for favorable environmental condition Genotype G15, G33, G37, and G40 exhibited significant S2di, thus prediction of their performance over environments would be not authentic. The rest of the genotypes showed non-significant S2di values, therefore, their performance was predictable in nature. Genotype G1 possessed the regression coefficient (bi) value were close to unity with non-significant S2di and genotypes G32 and G18 had the higher negative phenotypic indices with non-significant S2di values, indicating that they were to be more or less stable for this trait. Based on all the three estimates of stability parameters (negative phenotypic index, bi value close to unity and non-significant S2di value) into consideration, it appeared that G32 might be regard as suitable genotype among the all.
3.2.3. Plant height
Table 2. Pooled analysis of variance (MS) for genotype X environment interaction for seven economic characters in twelve wheat genotypes.
Items df Days to heading
Days to maturity
Plant height (cm)
Spikes/ plant (no.)
Grains/ plant (no.)
1000-grain weight (g)
Grain yield (g/plant)
Genotypes 11 65.51** 17.71** 117.49** 3.12** 73.86** 138.47** 8.83** Env. + (Gen.X
Env.)
36 3.62** 9.68** 55.43** 0.74** 42.32** 41.69** 3.88**
Env. (linear) 1 24.35** 193.45** 1571.32** 16.22** 1184.92** 1079.96** 109.76** Gen.X Env.
(linear)
11 3.58** 3.52 29.56** 0.74** 26.99** 31.74** 2.59**
Pooled deviation
24 2.78** 4.85 5.72 0.09 1.74 2.99 0.06
Pooled error 96 1.20 3.96 8.02 0.12 4.07 4.32 0.44
and ** indicate significant at 5% and 1% level of probability, respectively
Table 3. Mean performance, phenotypic index (Pi), regression coefficient (bi), deviation from regression (S2di) of twelve genotypes of wheat for yield and its components.
Genotype Days to heading Days to maturity Plant height Number of spikes/plant
Mean Pi bi S2di Mean Pi bi S2di Mean Pi bi S2di Mean Pi bi S2di
G1 55.33 -2.61 0.388 3.87** 102.0 0.72 0.85 -2.68 74.75 0.89 1.02 -4.96 4.58 0.03 1.93** -0.12 G11 58.83 0.89 0.160 -0.72 102.8 1.55 1.23 -3.93 75.33 1.47 0.93 4.83** 4.83 0.28 1.03 -0.11 G15 56.67 -1.28 0.192 0.99** 102.0 0.72 0.93 17.03** 75.08 1.22 1.38 -7.01 3.38 -1.18 1.54 0.01* G18 51.67 -6.28 -0.064 2.24** 97.75 -3.54 -0.01 -1.48 69.33 -4.53 1.33 -3.36 3.58 -0.97 1.63* 0.04* G22 63.00 5.06 1.643 4.07** 102.9 1.63 1.32 -0.82 70.83 -3.03 0.98 6.35** 4.29 -0.26 1.30 -0.03 G24 53.08 -4.86 0.648 0.64** 99.83 -1.45 1.60 -2.85 78.17 4.31 0.51 -7.99 5.92 1.37 -0.35** 0.03* G26 57.17 -0.78 2.053 0.36** 100.6 -0.70 0.66 -3.22 69.08 -4.78 1.00 -6.77 3.92 -0.64 1.17 -0.04 G32 64.25 6.31 2.888 -0.62 97.17 -4.12 0.55 -1.42 67.25 -6.61 1.39 -5.71 3.96 -0.60 1.60** -0.08 G33 56.00 -1.94 0.771 -0.80 102.0 0.72 1.41 5.43** 82.42 8.56 -0.02 -0.94 5.86 1.32 -0.10** -0.04 G37 64.08 6.14 0.443 -0.24 102.9 1.63 1.43 4.11** 78.33 4.47 1.16 -1.29 4.33 -0.22 0.80** 0.17** G40 57.25 -0.69 -0.858 7.54** 101.4 0.13 0.73 1.41** 80.25 6.39 0.14 -6.76 5.79 1.24 0.10 -0.12 G45 58.00 0.06 3.737* 1.63** 104.0 2.72 1.31 -0.97 65.50 -8.36 2.19** 5.30** 4.17 -0.39 1.36 -0.12
Mean 57.94 101.29 73.86 4.55
SE of mean
and bi 1.18 1.17 1.56 0.55 1.70 0.22 0.21 0.25
* and ** indicate significant at 5% and 1% level of probability, respectively
Table 4. Mean performance, phenotypic index (Pi), regression coefficient (bi), deviation from regression (S2di) of twelve Genotypes of wheat for number of grains per spike, 1000-grain weight and grain yield per plant.
Genotype Number of grains/spike 1000-grain weight Grain yield (g/plant)
Mean Pi bi S2di Mean Pi bi S2di Mean Pi bi S2di
G1 28.458 -8.628 0.913 -3.280 34.958 -5.226 0.997 -3.297 5.518 -0.228 1.407** -0.397 G11 36.633 -0.453 0.961 1.623** 44.717 4.533 0.874 -3.311 6.345 0.600 0.914** -0.387 G15 33.733 -3.353 1.820** 0.093* 35.317 -4.867 1.387* -4.282 5.019 -0.726 1.342** -0.393 G18 36.617 -0.469 1.683** -3.950 34.183 -6.001 1.496* -3.745 3.671 -2.075 1.096 -0.429 G22 35.025 -2.061 0.987 -3.048 36.750 -3.434 0.759 8.380** 6.166 0.420 0.968** -0.357
G24 42.700 5.614 0.274 -3.002 48.625 8.441 0.283 -0.159 7.458 1.713 -0.061 -0.396
G26 36.325 -0.761 0.982 -2.793 39.958 -0.226 1.679** -1.121 3.727 -2.019 1.382** -0.334 G32 34.775 -2.311 1.671** -2.484 31.792 -8.392 1.747** -3.789 4.589 -1.156 1.598** -0.256 G33 42.558 5.472 0.310 -4.063 50.108 9.924 0.499 2.812** 7.708 1.962 0.567** -0.408 G37 39.092 2.006 0.888 -1.566 41.525 1.341 1.088** -3.953 5.318 -0.427 1.127** -0.400
G40 43.375 6.289 0.387 -3.676 44.567 4.383 -0.208 -1.238 8.232 2.486 0.151 -0.354
G45 35.742 -1.344 1.124 -1.800 39.708 -0.476 1.400** -2.275 5.195 -0.550 1.508** -0.429
Mean 37.07 40.19 5.75
SE of mean and
bi 0.93 0.13 1.22 0.18 0.17 0.08
3.2.4. Number of spikes per plant
Genotypes G1, G11, G24, G33 and G40 had positive phenotypic indices, therefore they were desirable for this character G1, G32, and G33 showed significant linear component (bi significant and S2di non-significant) for spikes/plant. Such a linear response is predictable. Both the regression coefficient (bi) and deviation from regression (S2di) were non-significant for G11, G22, G26, G40 and G45. So these genotypes are stable for both favorable and unfavorable environments. Genotype G40 had the lowest bi value (0.01) with non-significant S2di values indicates the genotype was suited only for poor environmental condition. Talking all the three stability parameter genotype G11 considered as stable and desirable for number of spikes per plant.
3.2.5. Number of grains per spike
This trait is considered to have higher variation due to variable size of spikes for most of the varieties/genotypes of wheat. The genotypes G24, G33, G37 and G40 exhibited positive phenotypic indices, so these genotypes were desirable for this character. G15, G18, G32 and G45 tended to be responsive to change in environments as affirmed by their high bi values (1.82, 1.68, 1.67 and 1.12, respectively). These genotypes could be exploited favorable environment. The genotypes G33 and G40 with lower bi values (0.3 and 0.39, respectively) can be considered less responsive than that of the previous four genotypes. The genotypes G11 and G15 had the significant S2di values, therefore, performance of these genotypes were somewhat unpredictable. Again the genotypes G15 showed combined linear and linear sensitivity indicating that both linear and non-linear components were responsible for significant G X E interactions. While the genotypes G18 and G32 had significant bi values with non- significant S2di values indicating that genotypes are responsive and stable to favorable environment (bi >1). Considering all the three stability parameters, G37 having bi ≈ 1 an S2di ≈ 0 was most stable and desirable genotypes.
3.2.6. 1000-grain weight
This character is important as to indicate the size of the seed. The phenotypic indices of G11, G24, G33, G37 and G40 were positive. This indicates that these genotypes had 1000-grain weight higher than the average and are desirable. The genotype G15, G18, G26, G32, G37 and G45 exhibited higher bi values (bi >1) and were suitable only for highly favorable environments. All the others genotypes gave low bi values and thus indicated better performance to average environmental condition. The regression coefficient of genotypes G15, G18, G26, G32, G37 and G45 were also significantly different from unity with non-significant S2di values demonstrating their responsiveness to changing environments, which suggested that the performances of these genotypes were predictable in nature. All the other genotypes had the bi values, which were not significantly differed from unity. The genotypes G22 and G33 showed significant S2di values with non-significant bi values which indicate that they are more affected by the environmental fluctuations i.e. performance of these genotypes over environments (salinity level) were unpredictable. Considering all the three parameters (Pi, bi and S2di), the genotype G11 was found most stable among all the genotypes having bi value near to unity with non-significant S2di value.
3.2.7. Grain yield per plant
The most predictive parameter was the phenotypic index (Pi) of the individual genotypes. The genotypes G11, G22, G24, G33 and G40 exhibited positive Pi value. So these were desirable for this trait while the same for others were negative and therefore, are not desirable. However, it was the highest in G40 (Pi=2.49) while the lowest in G18 (Pi=-2.08). The genotype G32 showed the highest bi value (bi=1.6**) with non-significant S2di value, demonstrating their responsiveness to changing environments, which suggested that, the performance of the genotype was predictable in nature and was suited only for highly favorable environments. But the genotype G33 exhibited lower bi value (bi=0.57**) with non-significant S2di value indicating that this genotype was less responsive to environmental changes and were suited only for poor environments. All the genotypes possessed non-significant S2di values, indicating that their performance was predictable. Based on all the three stability parameters into consideration, it was observed that G11, G22 and G37 having bi ≈1 and S2di≈0 were most stable and desirable genotypes with reasonable good yield among the all.
4. Conclusions
favorable environments. Based on three stability parameters, G11, G22 and G37 were the most stable and desirable genotypes with reasonable good yield among the all.
Conflict of interest
None to declare.
References
Ahmed SS and R Khatun, 1996. Phenotypic adaptibility and stability of seed yield and its component in oletorius Jute. Bangladesh J. P1. Breed. Genet., 9: 25-28.
Allard RW and AD Bradshaw, 1964. Implications of genotype x environment interaction in applied plant breeding. Advances in Agronomy, 16: 280-324.
Ashraf M and T McNeilly, 1988. Variability in salt tolerance of nine spring wheat Cultivars. J. Agron. Crop Sci., 160: 14-21.
Aziz MA, MA Karim, MA Hamid, QA Khaliq and M Hossain, 2005. Salt tolerance in mungbean: growth and yield response of some selected mungbean genotypes to NaCl salinity. Bangladesh J. Agri. Res., 30: 529 - 535.
Aziz MA, MA Karim, MA Hamid, QA Khaliq and AJMS Karim, 2006. Salt tolerance of mungbean at different growth stage: effect of NaCl salinity on yield and yield components. Bangladesh J. Agri. Res., 31: 313-322. Barma NCD, SH Khan, MAK Miah and A Islam, 1990. Variability and interrelationship of eight quantitative
characters in bread wheat (Triticum aestivum L.) Bangladesh. J. Pl. Breed and Genet., 3: 71-75.
Eagles HA and KT Frey, 1977. Repeatability of the stability variance parameter in oats. Crop Sci., 17: 253-256. Eberhart SA and WA Russell, 1966. Stability parameters for comparing varieties. Crop Sci., 6: 36-40.
Ghose D and PK Das, 1981. Phenotypic adaptability and stability in tossa Jute for fibre yield and its components. Bangladesh J. Bot., 10: 140-146.
Hossain MG, 2004. Genotype – environment interaction on growth period, yield and yield contributing characters in spring wheat (Triticum aestivum L). M. S. Thesis. Dept. of Genet. and plant Breed. Bangladesh Agricultural University, Mymensingh.
Luthra OP, R F Singh and SN Khakar, 1974. Comparison of different stability modes in wheat. Theor. Appl. Genet., 45: 143-149.
Mahak S, RL Srivastava, RK Dixit and M Singh, 2002. Stability analysis for certain advanced lines of bread wheat under rainted condition. Advances in Plant Sci., 15: 295-300.
Madariya RB, VK Poshiya and RH Kavani, 2001. Phenotypic stability of yield and its contributing characters in bread wheat (Triticum aestivum L.) Madras Agri1. J., 88: 648-650.