Using concept definitions and ontology structure to
measure semantic similarity in biomedicine
Olivia Sanchez Graillet
Posgrado en Ciencias e Ingenier´ıa de la Computaci ´on Instituto de Investigaciones en Matem ´aticas Aplicadas y en Sistemas
Universidad Nacional Aut ´onoma de M ´exico Ciudad Universitaria, Coyoac ´an, 04510, M ´exico D.F., M ´exico
ABSTRACT
Semantic similarity is useful in different areas of Natural Language Processing (NLP), such as word-sense disambiguation and name-entity recognition, as well as in information retrieval. On the other hand, specialised NLP tools are required in the biomedical context due to the huge amount of information currently available in digital publications that can be explored. This paper presents a method for calculating the semantic similarity between pairs of biomedical concepts defined in an ontology derived from the SNOMED-CT vocabulary. A final semantic similarity is obtained by calculating the similarity between the components of the two concept definitions based on their shared and unshared ancestors in the ontology hierarchy. The results are compared with other methods as well as with human expert ranks as baseline.
General Terms:
Semantic similarity of biomedical concept pairs, Knowledge discovery
Keywords:
Semantic similarity, Knowledge discovery, Biomedical ontologies, Knowledge representation
1. INTRODUCTION
Semantic similarity is considered a special case of relatedness that is more tied to likeness (e.g. shape and form)[1] or when a linguistic relation between word/concept pairs holds, such as synonymy or hypernymy[2]. A semantic similarity method receives a pair of concepts as input and returns a similarity value that indicates how alike the two concepts are.
In the last years, the amount of digital biomedical information has increased rapidly. This information is mainly presented in textual form, which is why Natural Language Processing (NLP) tools are required, in order to look for valuable information. Semantic similarity plays an important role for NLP tools such as word-sense disambiguation [3, 4], and in the improvement of name-entity recognition (NER) [5]. Information retrieval and knowledge discovery [6, 7, 8] in specialised contexts are also prominent uses of semantic similarity. For health scientists, for example, it would be useful to know whether chicken-pox and varicella are the same disease and how close in meaning “myocardium” is to “heart”. General context tools for calculating semantic similarity may be limited to specialised fields. However, there are sources of specialised information that can help computer programs to determine the degree of similarity between concepts in a specific field.
In this work, a method for calculating semantic similarity between biomedical concept pairs expressed as OWL classes is presented. The concepts are contained in the SNOMED-CT ontology, which is derived from the corresponding vocabulary. The measure considers both SNOMED-CT definitions and
the ontology hierarchy given by “Is a” relationships between concepts.
The remainder of this paper begins with a review of related works on semantic similarity in Section 2. Section 3 describes the SNOMED-CT ontology and the proposed method. Section 4 offers a comparison with other methods, and Section 5 discusses the major findings by way of conclusion.
2. RELATED WORK
There exist several approaches for calculating semantic similarity [9, 10, 11, 12, 13, 14]. This section focuses on a selection of methods, in order to compare them with the proposed method in the evaluation section.
Taxonomy-based methods are applied when concepts are organised in a hierarchy. Several methods of this kind, rely on the principle that the most general concepts are those closer to the root and the most specific concepts are those closer to the leaves. For instance, Rada et al.’s method [9] finds the shortest path length connecting two concepts in a taxonomy where the concepts are connected by “broader than” relationships. Based on Rada et al.’s method, Pedersen et al. [1] calculate similarity as the inverse of the path length between two concepts (including both concepts) in an “Is a” taxonomy. Leackock and Chodorow’s method [15] divides the shortest path between two concepts (path) by twice the maximum depth of the “Is a” hierarchy (depth) and smooths it with −log: −log(2∗depthpath ). More recently, Batet et al. [14] proposed a method that considers all superconcepts and not only the minimal paths regarding the two concepts being compared. This method penalises cases with a small number of shared superconcepts. The final measure is the ratio between the non-shared superconcepts and the sum of non-shared and shared superconcepts smoothed by−log2.
Information content (IC) methods combine the taxonomical information shared by two concepts with the amount of information provided by the probability of the concepts to appear in a corpus (p), where theICof a conceptcis calculated asIC(c) =−log p(c). Resnik [16] estimated similarity between two concepts by calculating the IC of their Least Common Subsumer (LCS):IC(LCS(c1, c2)), since LCS represents the
information shared by the two concepts within the ontology. Lin [17]) developed a variant of Resnik’s method in which theIC of theLCSof the concepts is scaled by the individualICs of each concept:IC(LCS(c1,c2))
IC(c1)+IC(c2).
hierarchy with respect to the root node. Common specificity determines that lower level concept pairs are more similar than higher level concept pairs.
Context vector methods, on the other hand, are based on the idea that similar words are surrounded by similar contexts. Therefore, co-occurrence vectors of words extracted from a certain context (context vectors) are created. Words are obtained from a corpus by using a fix window, and semantic relatedness is calculated as the cosine of the angle between the context vectors of the two concepts being compared. Pedersen et al. adopted their context vector method from the general context [19] to the biomedical context [1]. For their analysis, words and definitions were extracted from 16 million diagnosis phrases contained in the Mayo Clinic corpus applying a one-line window. This corpus contains descriptions of clinical problems that have been collected in the Mayo Clinic. A pre-processing to clean the data from noise and redundancy contained in natural language texts was applied. Term descriptions were added to the associated SNOMED-CT concepts to create the context vectors of concepts. The method obtains high results when all notes are used in the corpus, and lower results, when using only the Impression/Report/Plan (IP) section. The results drop when only 100,000 notes are employed. The availability of suitable corpora, an efficient data-cleaning process, and the amount of text used determine the performance of this kind of method.
3. MATERIAL AND METHODS
3.1 The SNOMED-CT ontology
SNOMED-CT1 (Systematized Nomenclature of
Medicine-Clinical Terms) is a biomedical terminological resource with a wide coverage. It includes “Is a” relationships that link concepts within a hierarchy and attribute relationships that allow links between concepts across hierarchies [20]. The “Is a” relationship relates a concept to its more general concepts. For example, “viral pneumonia” has an “Is a” relationship to the more general concept “pneumonia”. Attribute relationships represent other aspects of the definition of a concept. For example, “viral pneumonia” has a “causative agent” relationship to “virus” and a “finding site” relationship to “lung”.2
For this study, the SNOMED-CT vocabulary was transformed into an OWL file with the Perl tool provided by IHTSDOP (International Health Terminology Standards Development Organisation)3 that is responsible for maintaining
SNOMED-CT. The RF2 SNOMED-CT files used for the ontology transformation were realised in July 2013 by IHTSDOP. The obtained ontology contains 297,327 OWL classes (concept definitions) organized into top-level hierarchies joint together by a root node. The top-level hierarchies are: Body structure, Clinical finding, Environment or geographical location, Observable entity, Organism, Pharmaceutical/biologic product, Physical force, Physical object, Procedure, Qualifier Value, Record artifact, Situation with explicit content, Social context, Special concept, Specimen, Staging and scales, and Substance. The attribute relationships correspond to 62 OWL object properties such as Laterality, Associated With, Finding Method, Finding Site, Has Definitional Manifestation, Has Interpretation, Interprets, Pathological Process, Severity, Occurrence, Component, Has Specimen, Measurement Method, Property, Scale Type, Has Active Ingredient, Has Dose Form, Has Active Ingredient, Has Focus, Has Intent, Method, Priority, Procedure Device, Procedure Morphology, Procedure Site, Surgical Approach, Using Energy, Using Substance, Associated
1www.nlm.nih.gov/research/umls/Snomed/snomed main.html 2http://www.ihtsdo.org/snomed-ct/snomed-ct0/snomed-ct-components/ 3http://www.ihtsdo.org/
Fig. 1. Example of OWL classes
Finding, etc. Some of these relationships are organised into hierarchies. For example, “Causative agent” is an “Associated With” relationship. There are more than 890,000 logically-defining relationships among all concepts.4
Java 1.6.0 27 and Jena 2.11.0 (the ontology framework for Java) are used to automatically traverse and extract information from the ontology.
As an example of the OWL concept representation obtained, Fig. 1 shows the corresponding OWL classes for concepts “Peptic ulcer” and “Necrosis”, and property “Finding site”.
3.2 Semantic similarity measure
A concept can be defined as a subclass of another concept (here called general concept) or as a concept formed by the intersection of concepts and properties with their respective fillers (here called composed concept). In Fig. 1, “Peptic ulcer” is a composed concept and “Necrosis” is a general concept. In a first consideration of the problem, similarity between two conceptscandd, is calculated with (1), in which the ontological hierarchy is employed.
sim(c, d) = λ1
λ1+λ2
(1)
where:
—λ1is the number of shared ancestors betweencandd
—λ2 is the number of unshared ancestors between c and d,
countingcandd
However,simdoes not consider the definition of concepts that may contain valuable information. In order to capture most of the common information between two concepts (OWL classes), the semantic similarity of two defined concepts is calculated
4ihtsdo.org/fileadmin/user upload/doc/download/doc SnomedCT
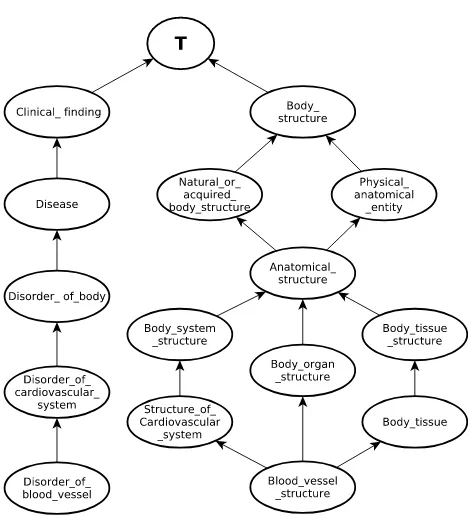
as the average of the sum of similarities (sim) between the corresponding concepts included in the respective definitions. In this way, besides capturing ontological information, the measure also captures important information that otherwise would be omitted when only counting the number of common and uncommon ancestors between concepts. For example, in Fig. 2, where nodes correspond to concepts and edges to “Is a’ relationships, there are several uncommon ancestors and only one common ancestor (>) of “Disorder of blood vessel” and “Blood vessel structure”, which would result in a low similarity value. However, these concepts should be related to some degree. In order to capture this relationship, the measure has to consider that “Blood vessel structure” is present in the definition of “Disorder of blood vessel” as can be seen in definition (a).
(a) Disorder of blood vessel≡
Disorder of cardiovascular systemu ∃finding site(Blood vessel structure) (b) Blood vessel structure≡Soft tissuesu
Structure of cardiovascular systemu
Body organ structure)
Based on the previous considerations, the semantic similarity value between two defined conceptsCandDis calculated with (2):
sem sim(C, D) =
n P
i=1
m P
j=1
sim(ci, dj)
n∗m (2)
Where:
—sim(ci, dj)is the similarity between conceptci ∈ TC and conceptdj∈TD
—TC is either the set of concept names (classes) contained in the intersectionOf and someValuesFrom declarations in the definition ofC (i.e.,C is a combined concept) or C itself, ifChas only one parent in itssubClassOfdeclaration (i.e.,C is a general concept)
—TD is either the set of concept names (classes) contained in the intersectionOf and someValuesFrom declarations in the definition ofD(i.e.,D is a combined concept) orD itself, ifDhas only one parent in itssubClassOfdeclaration (i.e.,D is a general concept)
—n and m are the number of concepts in TC and TD respectively
For example, the semantic similarity value for “Blood vessel structure” (A) and “Disorder of blood vessel” (B) −whose respective definitions are outlined under (a) and (b)−would be calculated as shown in Fig. 3.
4. RESULTS AND EVALUATION
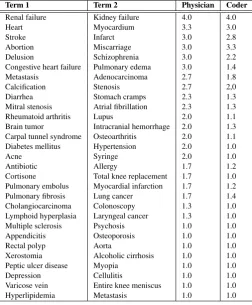
The dataset included in the work of Pedersen et al. [1] has been used as baseline for the evaluation. This dataset consists of 29 pairs of biomedical concepts ranked by three physicians and nine medical experts, using a 4-point scale: synonymous (4), related (3), marginally related (2), and unrelated (1). Table 1 contains the average ranks given by each group.
In order to compare the methods described in section 2 with the proposed method, the Spearman correlation coefficients between the results obtained by the proposed method and the ones for physicians, coders, and both (average of the two groups) were calculated, replicating Pedersen et al. and other authors. The correlation coefficients obtained by the methods of Pedersen et al. Lin, Resnik, and Leacock, and Chodorow, as well as the Path Length method are published in [1]. The correlation coefficients obtained by Batet et al.’s method are published in
Fig. 2. Extract of the SNOMED-CT ontology showing concepts “Disorder of blood vessel” and “Blood vessel structure”
Fig. 3. Example of semantic similarity calculation between “Blood vessel structure” (A) and “Disorder of blood vessel” (B)
[14], and the correlation coefficients obtained by Al-Mubaid and Nguyen’s method are published in [18]. The last authors only report the correlations in the coders group because they consider that the rating scores of coders are more reliable than the ones of physicians, given that the level of agreement and number of participants reported in [1] are higher in the group of coders than in the one of physicians.
5. DISCUSSION AND CONCLUSIONS
5.1 Discussion
Table 1. Baseline data: averaged experts’ relatedness scores (scale 1-4)
Term 1 Term 2 Physician Coder
Renal failure Kidney failure 4.0 4.0 Heart Myocardium 3.3 3.0 Stroke Infarct 3.0 2.8 Abortion Miscarriage 3.0 3.3 Delusion Schizophrenia 3.0 2.2 Congestive heart failure Pulmonary edema 3.0 1.4 Metastasis Adenocarcinoma 2.7 1.8 Calcification Stenosis 2.7 2,0 Diarrhea Stomach cramps 2.3 1.3 Mitral stenosis Atrial fibrillation 2.3 1.3 Rheumatoid arthritis Lupus 2.0 1.1 Brain tumor Intracranial hemorrhage 2.0 1.3 Carpal tunnel syndrome Osteoarthritis 2.0 1.1 Diabetes mellitus Hypertension 2.0 1.0 Acne Syringe 2.0 1.0 Antibiotic Allergy 1.7 1.2 Cortisone Total knee replacement 1.7 1.0 Pulmonary embolus Myocardial infarction 1.7 1.2 Pulmonary fibrosis Lung cancer 1.7 1.4 Cholangiocarcinoma Colonoscopy 1.3 1.0 Lymphoid hyperplasia Laryngeal cancer 1.3 1.0 Multiple sclerosis Psychosis 1.0 1.0 Appendicitis Osteoporosis 1.0 1.0 Rectal polyp Aorta 1.0 1.0 Xerostomia Alcoholic cirrhosis 1.0 1.0 Peptic ulcer disease Myopia 1.0 1.0 Depression Cellulitis 1.0 1.0 Varicose vein Entire knee meniscus 1.0 1.0 Hyperlipidemia Metastasis 1.0 1.0
Table 2. Correlation coefficients of different methods in relation to baseline scores
Method Physician Coder Both
Pedersen et al. (All section, 1M notes) 0.84 0.75 0.76
Proposed method 0.70 0.80 0.74
Pedersen et al. (IP section only, 1M notes) 0.62 0.68 0.69 Batet et al. 0.60 0.79 0.73 Lin 0.60 0.75 0.69 Al-Mubaid and Nguyen – 0.66 – Resnik 0.45 0.62 0.55 Path Length 0.36 0.51 0.48 Leacock and Chodorow 0.35 0.50 0.47
method (i.e., Al-Mubaid and Nguyen), and the taxonomy-based method of Batet et al.
The fact that Pedersen et al. consider relatedness rather than similarity might explain that their method obtains a high correlation with the group of physicians. However, their method needs pre-processing work and a large amount of data in order to get high correlations.
With the exception of Pedersen et al.’s (All sections) method, in general all the methods have obtained higher correlations in the group of coders than in the one of physicians. As Pedersen et al. have observed in the context of their analysis, a possible cause of this is the way coders and physicians are trained, physicians are trained in the diagnosis and treatment of patients, while coders are trained in the use of hierarchical classifications. It can then be speculated that since physicians are more specialised than coders, they are more likely to take further relationships between concepts into account.
5.2 Conclusions
This work has presented a method for calculating semantic similarity between two biomedical concepts defined as OWL classes. The method considers the amount of shared and
non-shared information between the parts of the two concepts by counting the common and uncommon ancestors between them in an “Is a” ontological structure.
The proposed method has shown a good performance and has the advantage that it only requires the structure of a widely used and permanently maintained ontology. It does neither need a big collection of texts nor preprocessing to get rid of noise and ambiguity of text. The proposed method could also be applied in other areas of study provided that there is an OWL ontology with similar class definitions like the ones used in this work. However, it is important to keep in mind that any critical evaluation of results will need to take into account the way in which concepts are defined, the expressive language used, the structure of the ontology, the coverage of the data, and the correctness of the information.
In future work, other types of relationships than “Is a” will be considered, such as attributive relationships included in SNOMED-CT, in order to improve the results of the proposed method, especially in comparison to physicians.
6. ACKNOWLEDGEMENTS
This work was supported by a grant from the Mexican National Council for Science and Technology (CONACYT).
7. REFERENCES
[1] T. Pedersen, S.V. Pakhomov, S. Patwardhan, and C.G. Chute. Measures of semantic similarity and relatedness in the biomedical domain.Journal of Biomedical Informatics, 40(3):288–299, 2007.
[2] A. Budanitsky and G. Hirst. Evaluating wordnet-based measures of semantic relatedness. Computational Linguistics, 32(1):13–47, 2006.
[3] S. Patwardhan, S. Banerjee, and T. Pedersen. Using measures of semantic relatedness for word sense disambiguation. InProceedings of the Forth International Conference on Computational Linguistics and Intelligent Text Processing, CICLing’03, pages 241–257, Mexico City, Mexico, 2003.
[4] L. Kobyli´nski and M. Kope´c. Semantic similarity functions in word sense disambiguation. In Text, Speech and Dialogue, pages 31–38. Springer, 2012.
[5] T. Grego and F.M. Couto. Enhancement of chemical entity identification in text using semantic similarity validation. PLoS ONE, 8(5), 2013.
[6] A. Hliaoutakis, G. Varelas, E. Voutsakis, E.G.M. Petrakis, and E. Milios. Information retrieval by semantic similarity. Int. J. Semantic Web Inf. Syst. (IJSWIS), 2(3):55–73, 2006. [7] G. Varelas, E. Voutsakis, E.G.M. Petrakis, E.E. Milios, and P. Raftopoulou. Semantic similarity methods in wordnet and their application to information retrieval on the web. In7th ACM International Workshop on Web Information and Data Management (WIDM), pages 10–16. ACM Press, 2005.
[8] P. Atzeni, F. Polticelli, and D. Toti. Knowledge discovery from textual sources by using semantic similarity. In 20th Italian Symposium on Advanced Database Systems (SEBD), pages 213–220. ACM Press, 2012.
[9] R. Rada, H. Mili, E. Bicknell, and M. Blettner. Development and application of a metric on semantic nets. IEEE Transactions on Systems, Man, and Cybernetics, 19(1):17–30, 1989.
[11] J.J. Jiang and D.W. Conrath. Semantic similarity based on corpus statistics and lexical taxonomy. InProceedings of International Conference on Research in Computational Linguistics, pages 19–33, 1997.
[12] Y. Li, Z.A. Bandar, and D. McLean. An approach for measuring semantic similarity between words using multiple information sources. IEEE Trans. on Knowl. and Data Eng., 15(4):871–882, 2003.
[13] I. Spasic and S. Ananiadou. A flexible measure of contextual similarity for biomedical terms. In Pacific Biocomputing Symposium, pages 197–208, 2005.
[14] M. Batet, D. S´anchez, and A. Valls. An ontology-based measure to compute semantic similarity in biomedicine. Journal of Biomedical Informatics, 44(1):118–125, 2011. [15] C. Leacock and M. Chodorow. Combining local context
and WordNet similarity for word sense identification, pages 305–332. In C. Fellbaum (Ed.), MIT Press, 1998. [16] P. Resnik. Using information content to evaluate semantic
similarity in a taxonomy. In Proceedings of the 14th International Joint Conference on Artificial Intelligence, pages 448–453, 1995.
[17] D. Lin. An information-theoretic definition of similarity. InProceedings of the Fifteenth International Conference on Machine Learning, ICML ’98, pages 296–304, San Francisco, CA, USA, 1998. Morgan Kaufmann Publishers Inc.
[18] H. Al-Mubaid and H.A. Nguyen. A cluster-based approach for semantic similarity in the biomedical domain. In Engineering in Medicine and Biology Society, 2006. EMBS ’06. 28th Annual International Conference of the IEEE, pages 2713–17, 2006.
[19] S. Patwardhan and T. Pedersen. Using wordnet-based context vectors to estimate the semantic relatedness of concepts. In Proceedings of the EACL 2006 workshop, making sense of sense: Bringing computational linguistics and psycholinguistics together, pages 1–8, 2006.